Europlanet Science Congress 2020
Virtual meeting
21 September – 9 October 2020
Europlanet Science Congress 2020
Virtual meeting
21 September – 9 October 2020

Oral presentations and abstracts

OPS6

Atmospheric aerosols and cloud particles are found in every atmosphere of the solar system, as well as, in exoplanets. Depending on their size, shape, chemical composition, latent heat, and distribution, their effect on the radiation budget varies drastically and is difficult to predict. When organic, aerosols also carry a strong prebiotic interest reinforced by the presence of heavy atoms such as nitrogen, oxygen or sulfur.

The aim of the session is to gather presentations on these complex objects for both terrestrial and giant planet atmospheres, including the special cases of Titan’s and Pluto's hazy atmospheres. All research aspects from their production and evolution processes, their observation/detection, to their fate and atmospheric impact are welcomed, including laboratory investigations and modeling.

Co-organized by TP/EXO
Conveners: Nathalie Carrasco, Panayotis Lavvas, Anni Määttänen

Session assets

Session summary

Chairperson: Nathalie Carrasco
EPSC2020-454ECP
Audrey Chatain, Nathalie Carrasco, Ludovic Vettier, and Olivier Guaitella


Abstract

Titan’s aerosols start forming in the ionosphere, in a reactive environment hosting electrons, ions and radicals. In this work we study the interaction of the aerosols with the ‘carbon free’ plasma species. In this objective, analogues of Titan’s aerosols (tholins) are exposed to a N2-H2 plasma in the laboratory. A previous work observed modifications on the solid aerosols [1]. Complementarily, this study investigates a possible feedback of the tholins erosion on the gas phase composition. The decrease of ammonia and the formation of carbon-bearing (and especially nitrile-bearing) species is observed by neutral and ion mass spectrometry. We suggest surface processes combining reactions with radicals and ion sputtering to explain these observations.


1- Introduction

Saturn’s biggest moon, Titan, has a thick atmosphere of N2 and CH4 (2-5%), covered by a haze of orange organic aerosols. The mission Cassini discovered that these aerosols start forming around 900 – 1200 km, in the ionosphere [2]. The ionosphere is the upper part of the atmosphere, ionized by UV solar photons and energetic particles from Saturn’s magnetosphere. It therefore hosts reactive plasma species (electrons, ions, radicals, excited species) that are likely to interact with the newly formed aerosols.

Carbon-bearing species help the carbon growth of the aerosols, but what is the result of the interaction of the aerosols with the other plasma species? Laboratory analogues of Titan’s aerosols can be formed in plasma discharges (e.g. in the experiment PAMPRE, Szopa et al., 2006); they are called ‘tholins’. A few studies have previously studied the effect of extreme UV photons on tholins [4], [5], and the recombination of atomic hydrogen at the surface of tholins [6].

Nevertheless, the interaction of Titan’s aerosols with the other ‘carbon-free’ plasma species has never been studied before. We built a dedicated experimental setup to expose tholins to a N2-H2 plasma (named ‘THETIS’ for THolins Evolution in Titan’s Ionosphere Simulation). The evolution of the tholins have previously been analysed by IR absorption spectroscopy and reported in Chatain et al. (2020a). We observed a physical erosion of the grains (with holes of ~20 nm) and chemical changes (disappearance of isonitriles and unsaturated structures, and formation of a new nitrile band).

In this context, the aerosols erosion is likely to have a feedback effect on the composition of the gas phase in Titan’s ionosphere. In this work, we therefore investigate the modifications of the gas phase during the exposure of tholins to a N2-H2 plasma.


2- The experimental setup

The ionosphere of Titan ‘free of carbon species’ is simulated by a DC glow plasma discharge in N2-H2 (with up to 5% H2). The pressure is varied from 0.5 to 2 mbar, and the current from 10 to 40 mA. Tholins formed in PAMPRE are spread on a thin metallic grid, which is exposed to the plasma during the experiment. The gas phase composition (neutrals and positive ions) is measured by a mass spectrometer (EQP series from Hiden), whose collecting head is positioned at ~5 cm from the plasma glow, next to the grounded electrode (see Figure 1). The mass spectrometer transmittance has previously been finely determined [7] to enable a quantitative comparison between all the mass intensities.


3- Evolution of neutral species

Figure 2 shows mass spectra acquired close to the N2-H2 plasma discharge, without (blue) and with (yellow) the tholins sample. Ammonia (NH3), which is formed in the N2-H2 plasma, decreases with the insertion of tholins in the plasma. It suggests that ammonia or its precursors are consumed by tholins. On the opposite, we observed the production of HCN and other carbon-containing molecules. Most of them contains nitriles (-CN), like acetonitrile (CH3-CN) and cyanogen (C2N2).


4- Evolution of positive ions

Figure 3 similarly presents mass spectra without (blue) and with (yellow) tholins exposed to the N2-H2 plasma. Observations are consistent with the evolution of neutral species: ammonia related ions (NHx+) are formed in the N2-H2 plasma and decrease with the addition of tholins; HCN related ions (CN+, HCN+, HCNH+) increase strongly; and new carbon-containing ions are formed. Among those we observe nitrile-bearing ions (related to acetonitrile and cyanogen), and highly unsaturated hydrocarbons (C+, CH+, C2+, C2H+, C3+, C3H+…).


5- Conclusions on the production of new volatiles by heterogeneous chemistry

From the evolution of the gas phase species observed in this work, the modifications of the tholins chemical functions presented in Chatain et al. (2020a) and previous heterogeneous chemistry modelling work in microelectronics [8], we suggest in Figure 4 some surface processes.

Radicals are likely to chemically react with the tholins. In particular, we suggest that an interaction of tholins carbon atoms with the radicals N, NH and H leads to the formation of HCN(s) (which stays adsorbed at the surface). In parallel, ion sputtering ejects fragments of tholins into the gas phase. It is especially the case for HCN which is already a stable molecule. This could also explain the nitrile-containing species and the highly unsaturated hydrocarbon ions observed in the previous sections. In addition, NH is fundamental in the production of NH3. The fact that NH is used at the surface of tholins to form HCN(s) is a reasonable explanation to the decrease of ammonia production.

In conclusion, in parallel to their formation in the ionosphere of Titan, aerosols are likely to undergo heterogeneous erosive processes and be a source of new volatiles. It would be interesting to implement such processes in the ionospheric chemical models.


Acknowledgements

A.C. acknowledges ENS Paris-Saclay Doctoral Program. N.C. acknowledges the financial support of the European Research Council (ERC Starting Grant PRIMCHEM, Grant agreement no. 636829).


References

[1]      A. Chatain et al. Icarus 345 (2020)

[2]      J. H. Waite et al. Science 316 (2007)

[3]      C. Szopa et al. Planet. Space Sci. 54 (2006)

[4]      N. Carrasco et al. Nat. Astron. 2 (2018)

[5]      S. Tigrine et al. Astrophys. J. 867 (2018)

[6]      Y. Sekine et al. Icarus 194 (2008)

[7]      A. Chatain et al. Plasma Sources Sci. Technol. (2020)

[8]      K. Van Laer et al. Plasma Sources Sci. Technol. 22 (2013)

How to cite: Chatain, A., Carrasco, N., Vettier, L., and Guaitella, O.: Interaction aerosols - plasma in Titan ionosphere: effect on the gas phase composition, Europlanet Science Congress 2020, online, 21 Sep–9 Oct 2020, EPSC2020-454, https://doi.org/10.5194/epsc2020-454, 2020.

EPSC2020-522
The haze of Pluto: exploring its radiative impact on the climate
(withdrawn)
Tanguy Bertrand, Emmanuel Lellouch, Xi Zhang, Lora Jovanovic, Thomas Gautier, Nathalie Carrasco, Ella Sciamma-O'Brien, Francois Forget, Pascal Rannou, Benjamin Charnay, Ted Roush, and Farid Salama
EPSC2020-707ECP
Lora Jovanovic, Thomas Gautier, Laurent Broch, Marie Fayolle, Eric Quirico, Tanguy Bertrand, Luc Johann, Aotmane En Naciri, and Nathalie Carrasco

I. Introduction

On July 14th, 2015, the New Horizons spacecraft flew by Pluto and revealed the presence of aerosols in the atmosphere [1,2,3] and a curiously dark reddish equatorial region named Cthulhu [1,4]. These photochemical aerosols, extending at more than 350 km of altitude [2,3,5], may affect Pluto atmospheric chemistry and climate [6,7]. Furthermore, it was suggested that these aerosols sediment to constitute the non-icy dark material on the surface of Pluto [4,8]. To interpret the data provided by New Horizons, the atmospheric (e.g. [7]) and surface models (e.g. [4,9]) have so far used the optical constants determined for Titan tholins. Nevertheless, since optical constants strongly depend on the chemical composition of the materials [10], and as Pluto tholins differ chemically from those of Titan [11], Pluto aerosol analogues were synthesized in laboratory and their optical constants were determined by spectroscopic ellipsometry.

II. Experimental setup and analyses protocol

  • Synthesis of Pluto tholins

We used the PAMPRE experimental setup [12] (LATMOS, France) to synthesize Pluto tholins as thin films onto silicon wafers. For this study, the gas mixture injected into the reactor was composed of variable proportions of N2 and CH4, with 500 ppm of CO [5,13], to simulate photochemical aerosols formed at different altitudes on Pluto (Table 1). The experiments were conducted at a pressure of 0.9 ± 0.1 mbar and at ambient temperature.

Table 1: Types of Pluto tholins analyzed in this study

Composition of the gas mixture Corresponding altitude on Pluto [5] Name of the sample
99.5% N2 : 0.5% CH4 : 500 ppm CO < 350 km PH
99% N2 : 1% CH4 : 500 ppm CO 400 km P400
95% N2 : 5% CH4 : 500 ppm CO 600 km P600


  • Spectroscopic ellipsometry

We used the UVISEL (Horiba Jobin Yvon) spectroscopic ellipsometer to analyze Pluto tholins thin films. Spectroscopic ellipsometry is a technique measuring the changes in the polarization state between incident and reflected light on the sample, as a function of wavelength. DeltaPsi2® software was used to fit the ellipsometric data. More precisely, a modified Tauc-Lorentz dispersion model determined the thicknesses of the thin films, and a wavelength-by-wavelength inversion method was used to retrieve the refractive indices n (Fig. 1) and the absorption coefficients k (Fig. 2), from 270 to 2100 nm.

III. Optical constants of Pluto tholins from UV to near-IR

Our study shows: (1) the refractive indices n of Pluto tholins vary from 1.60 to 1.77, and such n-values can correspond to organic polymers [14]; (2) a strong absorption of UV and Visible radiation by Pluto tholins, due to their N- and O-bearing molecules [15,16,17]; (3) a lower absorption in the near-IR with k-values of a few 10-3; (4) a dependency of n and k indices to the altitude of aerosols formation, with especially higher n- and k-values in the UV-Vis spectral range for Pluto low-altitude aerosols (PH and P400).

IV. Discussion and Conclusion

Due to higher n-values for the samples PH and P400, compared to the P600 sample, we can suppose that aerosols formed in Pluto's lower atmosphere (≤ 400 km of altitude) will differently scatter the light compared to aerosols formed at higher altitudes (> 400 km of altitude) [18], and thus differently affect the photon flux reaching the lower atmosphere and the surface. The strong absorption below 600 nm is likely due to the presence of N- and O-bearing molecules with lone pair, N- and O-containing polycyclic aromatic compounds and unsaturated molecules with extensive conjugated multiple bonds [14-17]. Since the nitrogen and oxygen content is higher in low-altitude tholins [11], their k indices are higher in the UV-Vis wavelength range. We can thus suppose that in Pluto's atmosphere the aerosols formed at different altitudes will differently absorb the photon flux and differently affect Pluto atmospheric and surface radiative transfer [18].

As Pluto tholins are chemically different from Titan’s [11], we propose a new set of optical constants to update Pluto atmospheric and surface models that were hitherto based on the optical constants of Titan tholins.

Acknowledgements

We are grateful to the European Research Council Starting Grant PrimChem for funding this work (grant agreement n° 636829).

References

[1] Stern S. A. et al., Science, Vol. 350, aad1815, 2015.
[2] Gladstone G. R. et al., Science, Vol. 351, aad8866, 2016.
[3] Cheng A. F. et al., Icarus, Vol. 290, pp. 112-133, 2017.
[4] Grundy W. M. et al., Icarus, Vol. 314, pp. 232-245, 2018.
[5] Young L. A. et al., Icarus, Vol. 300, pp. 174-199, 2018.
[6] Luspay-Kuti A. et al., Monthly Notices of the Royal Astronomical Society, Vol. 472, pp. 104-117, 2017.
[7] Zhang X. et al., Nature, Vol. 551, pp. 352-355, 2017.
[8] Cruikshank D. P. et al., Icarus, Vol. 246, pp. 82-92, 2015.
[9] Protopapa S. et al., Astronomical Journal, Vol. 159, pp. 159-174, 2020.
[10] Brassé C. et al., Planetary and Space Science, Vol. 109-110, pp. 159-174, 2015.
[11] Jovanović L. et al., Icarus, Vol. 346, 113774, 2020.
[12] Szopa C. et al., Planetary and Space Science, Vol. 54, pp. 394-404, 2006.
[13] Lellouch E. et al., Icarus, Vol. 286, pp. 289-307, 2017.
[14] van Krevelen D. W. and te Nijenhuis K.: Chapter 10: Optical Properties, in Properties of Polymers, pp. 287-320, 2009.
[15] Rao C. N. R.: Ultraviolet and visible spectroscopy, 1975.
[16] Imanaka H. et al., Icarus, Vol. 168, pp. 344-366, 2004.
[17] Lambe A. T. et al., Environmental Science & Technology, Vol. 47, pp. 6349-6357, 2013.
[18] Boucher O.: Atmospheric aerosols – Properties and climate impacts, 2015.

How to cite: Jovanovic, L., Gautier, T., Broch, L., Fayolle, M., Quirico, E., Bertrand, T., Johann, L., En Naciri, A., and Carrasco, N.: Optical constants of Pluto tholins, Europlanet Science Congress 2020, online, 21 Sep–9 Oct 2020, EPSC2020-707, https://doi.org/10.5194/epsc2020-707, 2020.

EPSC2020-694ECP
Jorge Hernandez Bernal, Agustín Sánchez-Lavega, Teresa Del Río-Gaztelurrutia, Ricardo Hueso, Eleni Ravanis, Alejandro Cardesín-Moinelo, Simon Wood, and Dima Titov

During twilight, when the sun is below the horizon, clouds and atmospheric dust can still be illuminated by the sun if they are high enough over the surface, as they escape the shadow of the planet. Observations of this direct illumination can be used to determine the minimum altitude for elevated features. While this is a rare phenomenon on Earth, it is a common occurrence on Mars, where clouds and aerosols can usually reach high altitudes in the mesosphere. Twilight clouds were first observed on Mars by ground-based telescopes, and then by cameras on the Viking orbiters. However, in the last few decades of Mars exploration, most orbiters have been placed in sun-synchronous orbits centered around the afternoon [1], and thus few observations of the twilight have been collected.

Mars Express (MEX) is an excellent platform for the study of twilight clouds due to its non-sun-synchronous orbit, The Visual Monitoring Camera (VMC) [2] onboard MEX hasas a wide Field of View (FOV) that allows regular observations of the full disk of Mars (usually including the region in dawn) from the apocenter of the MEX orbit [3]. The current VMC dataset includes ~50 000 images distributed across ~3000 observations (each observation consisting of several consecutive images), covering 8 Martian Years. We have developed a pipeline to perform a the systematic study of twilight clouds in VMC images. As VMC is a broad-band imager, it is not yet possible to properly study the composition of clouds, as the camera cannot distinguish spectroscopically between water ice, dust or CO2. Therefore for simplicity, we use the word “cloud” to refer to these elevated features, regardless of their actual composition.

We show some examples of twilight clouds in Figure 1. We find three main groups of twilight clouds in a belt around 45ºS. These three groups correspond to the regions of Terra Cimmeria, Terra Sirenum, and Aonia Terra, where the clouds appear mostly in the southern winter. Additionally, some of the highest clouds we find correspond to these regions. It is worth noting that an extremely high altitude plume was observed, also at dawn, and around the southern winter solstice, over Terra Cimmeria [6].

Whilst we find that these twilight clouds are more common during the Aphelion Cloud Belt season (ACB)[4], the latitudinal distribution of clouds differs from that of the ACB, as the biggest concentration of twilight clouds happens in a belt around 45ºS, while the ACB is more or less symmetrical around the equator [5]. This may be explained by the fact that VMC observations are mostly in the early morning, while most ACB studies have been focused on the afternoon [1]. Our results are biased by the fact that we only detect isolated clouds at some altitude over the surface, and that might also be part of the explanation for this discrepancy.

References:

How to cite: Hernandez Bernal, J., Sánchez-Lavega, A., Del Río-Gaztelurrutia, T., Hueso, R., Ravanis, E., Cardesín-Moinelo, A., Wood, S., and Titov, D.: A long term study of twilight clouds on Mars based on Mars Express VMC images, Europlanet Science Congress 2020, online, 21 Sep–9 Oct 2020, EPSC2020-694, https://doi.org/10.5194/epsc2020-694, 2020.

EPSC2020-911ECP
Alex Innanen, Brittney Cooper, Jacob Kloos, Charissa Campbell, and John Moores

ABSTRACT

The Global Dust Storm of Mars Year 34 was observed by the Mars Science Laboratory (MSL) in Gale crater, and many atmospheric effects were seen during its duration. Using atmospheric observations taken by MSL, water-ice cloud opacity and scattering phase function are calculated, allowing comparison of these quantities before and after the dust storm.  The average phase function was calculated for the Mars Year 34 Aphelion Cloud Belt (ACB) season, before the global dust storm, and will be calculated for the ACB season following. Opacity calculations are computed throughout the Martian year. The results of these calculations will indicate any impacts the global dust storm may have on Martian water-ice clouds.

1. INTRODUCTION

The Martian atmosphere has long been the subject of study, both in situ and remotely, and as a result we are able to observe its dynamic nature. Water-ice clouds are one such dynamic feature, and their similarities to Earth-based clouds provide an opportunity to learn more not just about Martian weather but our own climate processes.

The Mars Science Laboratory (MSL) in Gale Crater has been observing cloud activity in the region for the entirety of its mission to date. Cloud movies captured by MSL can be analysed in order to determine optical parameters such as opacity[1] and scattering phase function[2]. The most important time of year for cloud activity around Gale Crater is the Aphelion Cloud Belt season, which tends to peak between solar longitudes (Ls) 60-100° and is characterised by an increase in equatorial cloud formation[3].

MSL has been in Gale Crater for nearly four Martian Years, and as a result has been able to observe the time-varying nature of the Martian climate on daily, seasonal, and annual scales. The presence of a global dust storm in 2018 (Mars Year 34) gave further opportunity to study not only the event itself, but its lasting effect on the Martian atmosphere.

2. BACKGROUND

2.1 The Mars Year 34 Global Dust Storm

The global dust storm of Mars Year (MY) 34 was a planet encircling dust storm which lasted from about Ls~188° to Ls~250°[4]. Global dust storms typically occur every 3-4 years[5] and significantly impact the atmosphere, causing temperature and pressure fluctuations[4] and an increase in water vapour in the middle atmosphere[6]. While the decrease in visibility made it difficult to observe clouds during the global dust storm, a before-and-after comparison of cloud opacity and scattering phase function provide understanding about longstanding atmospheric effects of global dust storms.

2.2 MSL Atmospheric Movies

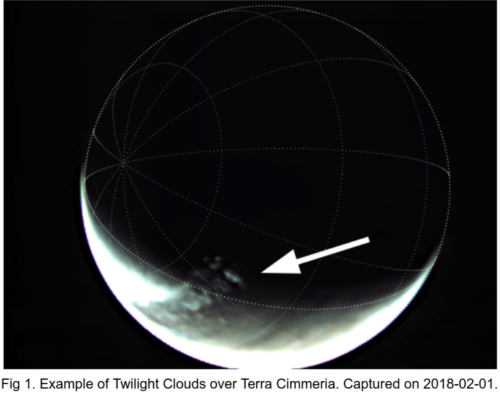
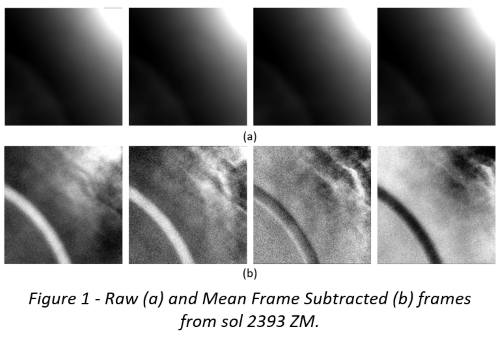
The navigation cameras onboard MSL take two types of movies year-round, Zenith Movies (ZM) and Suprahorizon Movies (SHM), and a third observation during the ACB season, the Phase Function Sky Survey (PFSS). ZM and SHM are both 8 frame movies taken over 6 minutes, with ZMs pointing to the Zenith and SHMs pointing just above the crater rim. The PFSS is a mosaic of 9 3-frame movies at a variety of pointings making a dome surrounding the rover. In order to better identify clouds, all three types of movies undergo mean frame subtraction, a process by which an average frame is subtracted from each frame of the movie, leaving only the time variable component. This can be seen in Figure 1.

Figure 1 - Raw (a) and Mean Frame Subtracted (b) frames from sol 2393 ZM.

3. METHODS

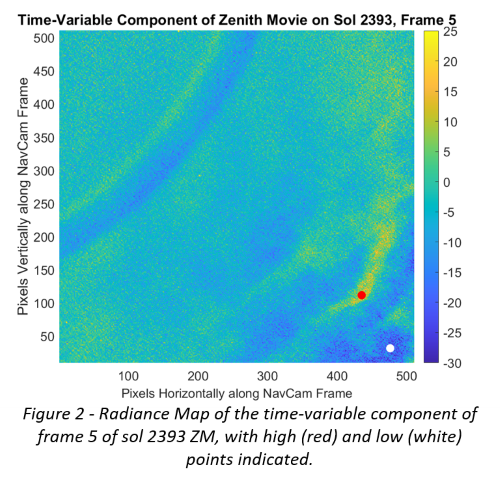
ZM and SHM can be analysed to determine cloud optical thickness, which has been computed for the first two Martian Years of MSL’s mission (Ls=160° of MY 31 to Ls=160° of MY 33)[7]. After mean frame subtraction, a radiance map (Figure 2) is made of a single frame of the movie, which is examined manually for a region containing cloud and empty sky, giving a variation in spectral radiance (Iλ,VAR) which is then used to compute the optical thickness. During the ACB season, the high-cloud formula, derived by Kloos et al, is used to estimate opacity, which assumes clouds are high, optically thin, and composed of water-ice crystals[1].

The PFSS was first instituted in MY 34, and an average scattering phase function determined for that year[2]. As with optical thickness, Iλ,VAR is determined from a radiance map for each movie and used to compute the phase function, using the formula derived by Cooper et al[2]. With the MY 35 ACB season ending in February of 2020, there is now another complete set of 26 PFSS observations, giving 234 total movies.

Figure 2 - Radiance Map of the time-variable component of frame 5 of sol 2393 ZM, with high (red) and low (white) points indicated.

4. RESULTS AND DISCUSSION

Currently ZM and SHM have been processed and have radiance maps from sol 1706 to sol 2748, a total of 466 movies. All of these must be checked manually for quality, and to identify high and low radiance points. This process is ongoing. Following the calculation of optical thickness for all cloud movies, the catalogue of MSL cloud opacities will be extended from two Martian years to four.

In addition, the 234 PFSS movies must likewise be checked, a process that is nearing completion at time of writing. By the time of the conference, it is anticipated that an average phase function for MY 35 will be calculated, allowing comparison with that of MY 34. Due to the larger size of the opacity dataset, opacity calculations are anticipated to take more time.

These observations will allow us to better understand not only the lasting atmospheric effects of global dust storms, but also will extend our understanding of variability in water-ice cloud optical properties over larger timescales.

REFERENCES

[1] Kloos, J.L, et al, Adv. Space Res., 2016.

[2] Cooper, B.A., et al, P&SS, 2019.

[3] Wolff, M.J., et al, JGR, 1999.

[4] Guzewich, S.D. et al, Geophys. Res. Lett., 2019.

[5] Zurek, R.W., and Martin, L.J., JGR, 1993.

[6] Aoki, S.A., et al, JGR-Planets, 2019.

[7] Kloos, J.L. et al, JGR-Planets, 2018.

How to cite: Innanen, A., Cooper, B., Kloos, J., Campbell, C., and Moores, J.: Martian Water-Ice Cloud Optical Properties Following the Mars Year 34 Global Dust Storm, Europlanet Science Congress 2020, online, 21 Sep–9 Oct 2020, EPSC2020-911, https://doi.org/10.5194/epsc2020-911, 2020.

EPSC2020-889
Benjamin Charnay, Doriann Blain, Bruno Bézard, Jérémy Leconte, and Martin Turbet

K2-18 b is a temperate sub-Neptune orbiting in the habitable zone of a nearby M star. Recent analysis of HST transit observations revealed the presence of water vapour and potentially water clouds. K2-18b is a unique opportunity to characterize the physics, chemistry and dynamics of temperate low-mass exoplanets.

We present here the results of 3D atmospheric modelling of K2-18b including water clouds with radiative effects. We investigate the effects of atmospheric metallicity (from 1xsolar to 1000xsolar), the concentration of cloud condensation nuclei, microphysics and rotation rate on the distribution of water clouds. We also analyze the impact of clouds and their spatial/time variability on transmission and emission spectra. Finally, we show how future observations with JWST, ELTs and ARIEL would constrain the atmospheric composition and clouds of this planet.

How to cite: Charnay, B., Blain, D., Bézard, B., Leconte, J., and Turbet, M.: Formation and dynamics of water clouds on K2-18 b, Europlanet Science Congress 2020, online, 21 Sep–9 Oct 2020, EPSC2020-889, https://doi.org/10.5194/epsc2020-889, 2020.