Oral presentations and abstracts
Martian research in Europe has grown exceptionally over the past decades, first thanks to the longstanding achievements of the Mars Express community and more recently thanks to the great contributions of the ExoMars 2016 Trace Gas Orbiter mission, leading Europe to a prime role within the international martian community. This valuable experience has paved the way for the new exciting discoveries expected in the next years from the ExoMars Rover and Surface Platform and in the future by the Mars Sample Return programme.
The aim of this session is to recognize the experience gained with European Mars missions and promote new synergies to enhance the collaboration within the European science community, in close coordination with other international agencies (NASA, Roscomos, JAXA, CSA, etc.)
This session welcomes contributions from any field of Martian scientific research, including also operational, technical and interdisciplinary aspects involving the different Mars missions, especially those covering multi-mission and international collaborations over a wide range of topics: Mars subsurface, surface geology and mineralogy, atmosphere, magnetosphere, martian moons and any potential exo-biological implication in the context of the new exploration missions.
Public information:
Session summary is now available online with the showcase presentation given by the Project Scientists of all ESA's Mars missions. This includes the latest science highlights from Mars Express and Trace Gas Orbiter, the status of the ExoMars 2022 Rover and Surface Platform and the preparations for the Mars Sample Return programme. Please visit the presentations and do not hesitate to comment and discuss with all authors, especially Early Career Researchers.
Session assets
After 16 years in orbit Mars Express remains one of ESA’s most scientifically productive Solar System missions which publication record now approaches 1300 papers. Characterization of the geological processes on a local-to-regional scale by HRSC, OMEGA and partner experiments on NASA spacecraft has allowed constraining land-forming processes in space and time. Recent studies suggest geological evidence of a planet-wide groundwater system on Mars and surface clay formation during short-term warmer and wetter conditions on a largely cold ancient Mars. HRSC team released the Digital Elevation Model (DEM) of the MC-11 quadrangle and the Southern polar cap at 50 m/px resolution. Mars Express provided essential contribution to the selection of the Mars-2020 landing sites and supporting characterization of potential landing sites for Chinese Tianwen-1 mission.
One-and-one-half decade of monitoring of atmospheric parameters such as temperature, dust loading, water vapor and ozone abundance, water ice and CO2 clouds distribution, collected by SPICAM, PFS, OMEGA, HRSC and VMC together with subsequent modeling have provided key contributions to our understanding of the Martian climate. In 2019 PFS confirmed observations of a methane abundance “spike” in the Gale crater observed in situ by the Curiosity Rover. Recent similar quasi-simultaneous observations were in disagreement, thus indicating that the methane “enigma” continues. This poses a significant challenge to both observers and modelers. The radio-science experiment MaRS revealed fine structure of the boundary layer which depth varies from 2 km in topographic lows to ~10 km over highlands.
Observations of the ion escape during a complete solar cycle revealed that ion escape can be responsible for removal of about 10 mbar of the atmosphere over Mars’ history. This implies existence of other, more effective, escape channels. The structure of the ionosphere derived from MARSIS and MaRS sounding was found to be significantly affected by the solar activity, dust loading in the lower atmosphere, and crustal magnetic field. The observations suggest that the sunlit ionosphere over the regions with strong crustal fields is denser and extends to higher altitudes as compared to the regions with no crustal anomalies. Ionospheric models aim at creating user-friendly data base of plasma parameters that would be of great service to the planetary community. Focused exploration of the Martian moons continues.
The mission is notionally extended till the end of 2022. A science case for the mission extension till the end of 2025 has been submitted. The talk will give the Mars Express status, review the recent science highlights, and outline future plans including synergistic science with TGO.
How to cite: Titov, D., Bibring, J.-P., Cardesin, A., Duxbury, T., Forget, F., Giuranna, M., González-Galindo, F., Holmström, M., Jaumann, R., Määttänen, A., Martin, P., Montmessin, F., Orosei, R., Pätzold, M., and Plaut, J. and the Mex Sgs Team: Mars Express science highlights and future plans, Europlanet Science Congress 2020, online, 21 Sep–9 Oct 2020, EPSC2020-720, https://doi.org/10.5194/epsc2020-720, 2020.
INTRODUCTION
MEX remains one of ESA’s most scientifically productive missions and has fully accomplished its initial mission objectives. It was the first European mission to Mars and the first ESA mission to orbit another planet. Its global surveys of the surface, the atmosphere and the plasma environment of the Red Planet were possible to achieve thanks to the elliptical orbit of MEX. The mission provides a unique platform for Mars climate evolution research to help understand the complex atmospheric processes present on Mars. This scenario is ideal for fulfilling diverse science goals from the instruments on board with new scientific and operational challenges in the coming years.
NEW CHALLENGES FOR MISSION EXTENSIONS 2021-2022 and 2023-2025
In addition to the regular global surface, climate and plasma monitoring, the future mission extensions will have various new challenging science campaigns. The scientific goals for the extensions 2021-2022 and 2023-2025 are described in detail by (Titov et al EPSC2020).

Figure 1. Main scientific and operational seasons for Mars Express between 2021 and 2025
These are some of the new challenging objectives that are planned for the mission extensions :
-
Hi-resolution observations of atmosphere & ionosphere
-
First active plasma sounding at another planet (MARSIS/ASPERA)
-
MEX/TGO inter-spacecraft occultation radio science
-
Ionosphere and plasma at Solar Maximum
-
Global topography (completion of colour & stereo imagery)
-
Active & transient surface effects
-
Phobos observatios with full instrument suite
-
Joint observations with TGO and Rosalind Franklin (RSP)
With the successive confirmations of the Mars Express (MEX) mission extension, doors are opened to gather new science. New technological challenges appear in the Science Ground Segment (SGS) of the European Space Agency, which is characterized by its variability, flexibility and diversity.
IMPLEMENTATION OF NEW SCIENCE OBSERVATIONS
In this manuscript we present here various new observation campaigns that are defined to fulfil the scientific objectives of the new mission extensions and summarize the inventive modifications our team has made in order to continue with the flexibility in terms of planning the mission extensions.
Mars Express has a highly elliptical polar orbit that crosses the equatorial orbit of Phobos every 5~7 months (Figure 2 and Witasse et al.2014). During these seasons, several flyby campaigns are organized and all instruments are pointed to the moon with different observation requirements (illumination, distance, rotation rates, etc).
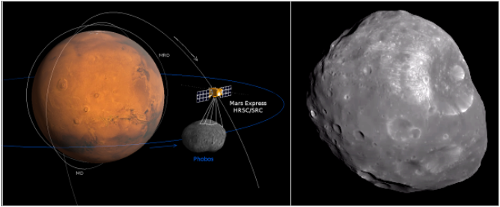
Figure 2. Illustration of Mars Express crossing Phobos orbit. Image taken by HRSC in November
2019, orbit 20076, at a distance of ~2400 km (ESA/DLR/FU Berlin).
A good example of new science campaigns are the new Local Time Scans, where the spacecraft is rotated (Figure 3) to cover a wide range of local times and longitudes in the same latitude region.
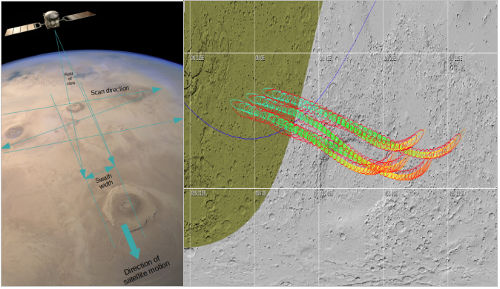
Figure 3. Mars Express Local Time Scans. Left: spacecraft is rotated along the scan direction,
perpendicular to the satellite motion. Right: three local time scans over Hellas planitia; red circles
show PFS field of view; colours represent illumination angle (cyan is dark around local morning,
yellow is brighter close to local noon). (Credit ESA/DLR/FU Berlin/MAPPS/J.Marín-Yaseli)
This Local Time Scanning campaign was created in 2019 based on a new request by the Planetary Fourier Spectrometer (PFS) to increase the local time coverage of the measurements to improve the climatic record, which was limited by the spacecraft trajectory. Based on this requirement, a new pointing type was defined to improve the local time coverage over certain regions of the planet. This new observation type is now used by all spectrometers (PFS, SPICAM, OMEGA) allowing for the identification of inter-diurnal variations in certain regions of interest, as shown for Hellas Planitia above.
New tests will be executed throughout summer 2020 to assess the performance of radio measurements at the exit of the earth occultations (Figure4). Although the operational concepts of ingress+egress occultations were formulated at the beginning of the mission, it was not until mid-2020 that the first campaigns were revised for execution. The egress occultations will bring the opportunity to observe wider latitude/longitude areas still uncovered by previous campaigns.
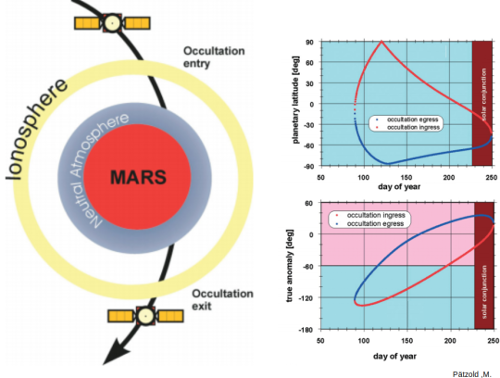
Figure 4. Radio Science ingress+egress occultations as seen from the Earth (left) and plotted against
latitude and true anomaly (right).
The first tests to carry out radio science communications between the two spacecraft are expected to start by the end of 2020 (Figure 5 and Cardesín-Moinelo, et al. Icarus 2020). The technical and scientific requirements for these new observations impose new challenges in the operations of the two missions. In particular, the preparation of the observations requires a long-term geometrical analysis of the pointing requirements and visibility opportunities between the two spacecraft, as well as detailed coordination between the scientific and technical teams for the configuration and execution of the measurements to ensure the correct data interpretation.
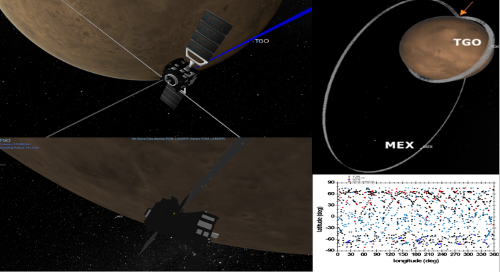
Figure 5. Illustrations of radio occultation between Mars Express and Trace Gas Orbiter. Bottom-right
shows the good latitude/longitude coverage for the occultations. (ESA/SPICE/Cosmographia)
CONCLUSIONS
Planning the science operations for MEX continues to be a challenge. Coordination and fast changes among the different teams at ESA enables Mars Express to continue doing science for many more years. It requires a qualified science operations team with both engineering and scientific experience to achieve the goals of the mission. It is vital to take advantage of long term missions such as MEX in order to transfer the planning knowledge and experience to complex planetary missions of the future.
How to cite: Marín-Yaseli de la Parra, J., Cardesín-Moinelo, A., Merritt, D., Breitfellner, M., Castillo Fraile, M., Grotheer, E., Costa í Sitjà, M., Muñiz Solaz, C., Ravanis, E., Martin, P., and Titov, D.: Challenges for the New Science Campaigns in Mars Express future Mission Extensions, Europlanet Science Congress 2020, online, 21 Sep–9 Oct 2020, EPSC2020-632, https://doi.org/10.5194/epsc2020-632, 2020.
Introduction:
Current efforts for image mosaics from the High Resolution Stereo Camera (HRSC, Jaumann, 2007) on board Mars Express are ongoing (Michael et al. 2016, Michael et al., 2019). Usually, illumination effects between adjacent single images related to the planetary curvature are reduced by using a Lambert correction and subsequent normalization to a common brightness reference. Here we present an extended correction of topography-induced shading effects by using the illumination angles with reference to the local topography represented by the digital terrain model (DTM) associated to every single HRSC scene, resulting in top-of-the-atmosphere albedo images of the surface.
Scattering models:
When used for illumination corrections taking the local topography into account, the Lambertian model and its associated cosine correction tends to over-correct on large incidence angles (under-illuminated pixels), as observed on crater slopes at low Sun angles. Therefore we do not consider it for our work but use it as a reference for comparison reasons (see Fig. 1 top -- the saturation level of one is reached at around 70° effective incidence angle).
The one-parameter model by Minnaert (Minnaert, 1941) is known for its good reproduction of the Martian surface. Depending on its power-law parameter k, the saturation effect of the correction appears at very high incidence angles only and is therefore better suited for topographic corrections. Still, in the case of HRSC, the Sun incidence angle on the ellipsoid is often higher than 60° and adding the slope angles results in incidence angles higher than 80°. This leads to very bright over-corrected pixels in highly inclined areas facing away from the Sun (see Fig. 1 middle -- depending on the k parameter, the saturation level is reached at around 80° incidence).
The correction used by Teillet et al. (1982) is well suited for topographic corrections due to its minimal amount of overcorrection (cf. Fig. 1 bottom for plots of varying parameter settings and Fig. 2 for the result). The single parameter is derived by a relation of the incidence on the ellipsoid to the mean incidince with regards to the topography.


Figure 1: Correction curves using different photometric functions; top: Lambert model; middle: Minnaert model, emission angle=0°; bottom: Teillet model, incidence on ellipsoid=60°. A reflectance of 0.3 is assumed for all plots.
Results:
We corrected a common set of HRSC images using the three mentioned scattering models and assembled a respective mosaic for each by correcting the single images for the illumination effects and then normalizing the images to TES albedo data (see Fig. 2). The parameters for the models are estimated using non-linear least square minimization for every single HRSC scene assuming constant parameters over the full image. The results for the Minnaert and the Teillet model appear very consistent by visual inspection. Due to the very high slope angles often appearing in HRSC scenes, the Minnaert model sometimes results in saturated pixels, while the Teillet model achieves the most modest levels of correction. We have not observed any advantage of the Minnaert model over the Teillet model, although it additionally includes emission angle values in the model. This lets us assume that the emission angles have a minor effect on the topography-induced illumination effects.
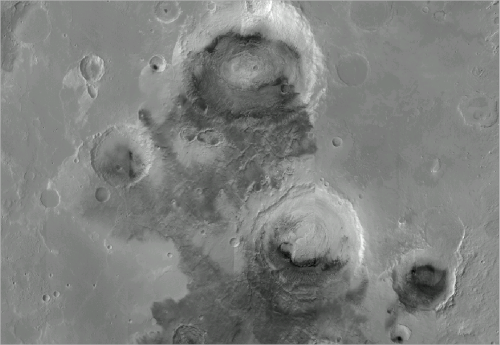
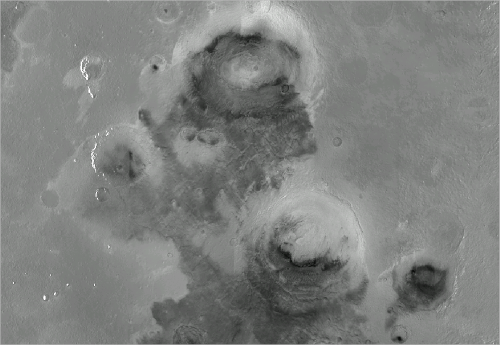
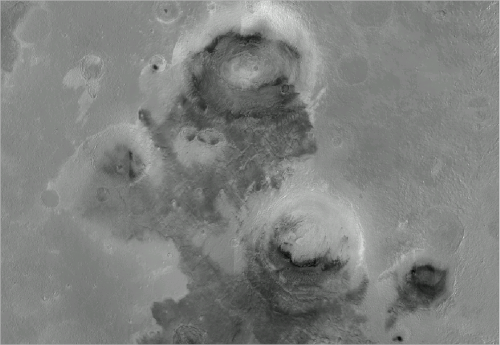
Figure 2: Subsets of the image mosaics; top: uncorrected image mosaic as shown in Michael et al., 2016; middle: Image mosaic with removed shading using the Minnaert scattering model, bottom: Image mosaic with removed shading using the Teillet scattering model.
Outlook:
The albedo mosaics here serve for a broad range of applications: Image classification using computer vision algorithms, geologic interpretation without influences of the topography and therefore better differentiation between albedo and shading, data fusion with uniform illumination characteristics, as well as the ability to add homogeneous shading from a uniform illumination direction for the application in Virtual Reality scenarios.
How to cite: Walter, S. H. G., Michael, G. G., Gwinner, K., and Jaumann, R.: Seamless albedo mosaic maps from Mars Express High Resolution Stereo Camera (HRSC) imagery , Europlanet Science Congress 2020, online, 21 Sep–9 Oct 2020, EPSC2020-18, https://doi.org/10.5194/epsc2020-18, 2020.
1. Introduction
The European Space Agency (ESA) mission ‘Mars Express’ (MEX) launched in 2003 equipped with seven instruments. The Visual Monitoring Camera (VMC) on board MEX was designed to monitor the release of the Beagle 2 lander, but was switched back on again in 2007. In the following years, in addition to helping engage the general public with the MEX mission [1] VMC images were used for atmospheric studies [2,3] and subsequently the camera was ‘upgraded’ to a scientific instrument in 2016. Hence, the mission ‘gained’ a scientific instrument in the form of the VMC. The scientific success [4] of this small camera is a part of the larger success story of Europe’s first Mars mission, serving as an example of how planetary missions can exceed and build upon their original expectations. This work details the journey of VMC from an engineering to a scientific instrument, including how VMC is operated, how the data is calibrated, and examples of the scientific work that has been undertaken with VMC data, images of which are exemplified in Figure 1.

2. Instrument Operations
The VMC is a 640x480 pixel camera with a large field of view (FOV) of ~40 x 31°. The wide FOV allows the camera to capture both the entire disk of Mars within the image and to perform observations over a wide portion of the limb. When taken in combination with the elliptical orbit of MEX, this enables observations at different local times and distances. VMC has a different data protocol and is offset from other instruments by 19°, and for these reasons cannot observe at the same time as other instruments on MEX. Since 2018, planning for the VMC has been integrated with planning for the other payload instruments, which takes place at the European Space Astronomy Centre (ESAC). This integration has increased both the quantity and the types of observations performed by VMC (Figures 2 and 3).


3. Data Calibration
The VMC team has performed in situ calibration for VMC since no on-ground calibration exists for the instrument (discussed in [5]). Observations of dark sky were taken to create a master dark-current file for dark-current correction. Dark-corrected images of flat portions of Mars taken at pericentre that were well and uniformly illuminated, as free as possible from large structures and as flat as possible were used to create a file for flat-field correction. The boresight offset of VMC has also been calculated by comparing the location of stars in VMC images with the stars’ known positions given by the SPICE geometry information system.
4. Data Processing and Archiving
Since [5], the VMC pipeline has been updated in collaboration with the science team at UPV-EHU Bilbao. VMC data are dark-corrected, flat-fielded, and are now provided in raw, FITS and PNG formats. The VMC pipeline runs at ESAC and is utilised by the VMC science team, and the current dataset from 2007 to the present totals ~50,000 images distributed across ~3000 observations. VMC data for scientific usage have been prepared for ingestion into the Planetary Science Archives (PSA) over the summer of 2020. This will be the first science data release from the instrument, thereby augmenting the already extensive wealth of data obtained from Mars Express over the last 17 years. Data from the VMC instrument continue to be available for outreach purposes through Twitter and Flickr (@esamarswebcam, Flickr: https://www.flickr.com/photos/esa_marswebcam/).
5. Scientific Success
The regional and global scale atmospheric dynamics of Mars are fast-paced and so a high temporal resolution of observations at various local times is required to help us understand and constrain how such dynamics develop. As previously mentioned, the wide FOV of VMC coupled with the highly elliptical orbit of MEX allows VMC to take observations at diverse local times and therefore to capture these large-scale atmospheric phenomena (Figure 4). VMC images are taken approximately every ~48 seconds depending on exposure time, and so the science team has been able to stack images from the same observation and also produce mosaics and videos showing the movements of aerosols. VMC data has been used for the analysis of the Arsia Mons cloud [6]; a recurrent double cyclone in the north polar region [7]; the 2018 global dust storm [8] and local dust storms in 2019 [9]; and ‘twilight clouds’ in the Martian night [10].

References:
[1] Ormston, T., et al. (2011). An ordinary camera in an extraordinary location: Outreach with the Mars Webcam. Acta Astronautica, 69, 703-713.
[2] Sánchez-Lavega, A., et al. (2016). Limb clouds and dust on Mars from VMC-Mars Express images. DPS 48, 16-21 October 2016, 409-01.
[3] Sánchez-Lavega, A., et al. (2018). Limb clouds and dust on Mars from images obtained by the Visual Monitoring Camera (VMC) onboard Mars Express. Icarus 299: 194-205.
[4] Cardesín-Moinelo, A., et al. (2017). A “NEW” SCIENTIFIC CAMERA AROUND MARS, GETTING SCIENCE WITH VISUAL MONITORING CAMERA ONBOARD MARS EXPRESS. Sixth International Workshop on the Mars Atmosphere: Modelling and Observations, 17-20th January 2017, Granada, Spain.
[5] Ravanis, E.M., et al. (2019). Mars Express Visual Monitoring Camera: New Operations and Data Processing for more Science. EPSC2019, 15-20 September, Geneva, Switzerland.
[6] Hernández-Bernal et al. (2020) An Extremely Elongated Cloud over Arsia Mons Volcano on Mars: Life Cycle. Submitted to Journal of Geophysical Research.
[7] Sánchez-Lavega, A., et al. (2018) A seasonally recurrent annular cyclone in Mars northern latitudes and observations of a companion vortex. Journal of Geophysical Research: Planets 123.11: 3020-3034
[8] Hernández‐Bernal, J., et al. (2019). The 2018 Martian Global Dust Storm over the South Polar Region studied with MEx/VMC. Geophysical Research Letters 46.17-18: 10330-10337.
[9] Sánchez-Lavega, A., et al. (2020). Patterns in textured dust storms in Mars North Pole. EPSC2020, 21 September – 9th October 2020, Virtual.
[10] Hernández-Bernal, J. et al. (2020). A long term study of twilight clouds on Mars based on Mars Express VMC images. EPSC2020, 21 September – 9th October 2020, Virtual.
How to cite: Ravanis, E., Hernández-Bernal, J., Cardesín-Moinelo, A., Sánchez-Lavega, A., del Río-Gaztelurrutia, T., Hueso, R., Wood, S., Grotheer, E., Titov, D., Marín-Yaseli de la Parra, J., Merritt, D., Breitfellner, M., Castillo, M., and Martin, P.: From engineering to science: Mars Express Visual Monitoring Camera's first science data release, Europlanet Science Congress 2020, online, 21 Sep–9 Oct 2020, EPSC2020-437, https://doi.org/10.5194/epsc2020-437, 2020.
Mars has lost and is losing its atmosphere into space. Strong evidences of this come from the observation of planetary singly charged heavy ions (atomic oxygen, molecular oxygen, carbon dioxide ions) by Mars Express and MAVEN. Phobos, the closest moon of Mars, orbits only 6,000 kilometers above the red planet’s surface and is therefore a unique vantage point of the planetary atmospheric escape, with the escaping ions being implanted within the regolith of Phobos and altering the properties of the moon’s surface.
In this presentation, we aggregate all ion observations gathered in-situ close to the orbit of Phobos by three ion instruments onboard MAVEN, from 2015 to 2019, to constrain the long-term averaged ion environment seen by the Martian moon at all longitudes along its orbit. In particular, the SupraThermal and Thermal Ion Composition (STATIC) instrument onboard MAVEN distinguishes between solar wind and planetary ions. The newly constrained long-term ion environment seen by Phobos is combined with numerical simulations of ion transport and effects in matter.
This way, we find that planetary ions are implanted on the near side of Phobos (pointing towards Mars) inside the uppermost tens of nanometers of regolith grains. The composition of near-side grains that may be sampled by future Phobos sample return missions is therefore not only contaminated by planetary ions, as seen in lunar samples with the terrestrial atmosphere, but may show a unique record of the past atmosphere of Mars.
The long-term fluxes of planetary ions precipitating onto Phobos are so intense that these ions weather the moon’s surface as much as or more than solar wind ions. In particular, Martian ions accelerate the long-term sputtering and amorphization of the near side regolith by a factor of 2. Another implication is that ion weathering is highly asymmetric between the near side and far side of Phobos.
How to cite: Nénon, Q., Poppe, A. R., Rahmati, A., and McFadden, J. P.: Implantation of ions escaping the atmosphere of Mars within the regolith of Phobos, and Phobos’ surface ion weathering, Europlanet Science Congress 2020, online, 21 Sep–9 Oct 2020, EPSC2020-458, https://doi.org/10.5194/epsc2020-458, 2020.
Even if water vapor is a minor species in the Martian atmosphere it plays an important role in the planet’s climate. Major efforts were made to understand water vapor distribution during the last decades. Its seasonal cycle was studied in detail using nadir measurements by TES/Mars Global Surveyor, three experiments onboard Mars-Express, SPICAM, OMEGA and PFS, and by CRISM/Mars Reconnaissance Orbiter. In contrast to column abundance, the climatology of water vapor vertical distribution was scarcely documented until recently. The vertical distribution gauges multiple processes controlling the Martian water cycle, including the cloud formation with condensation, evaporation and sedimentation, sublimation and condensation on polar caps, the photodissociation and escape processes, and surface-atmosphere exchange [1]. A few spectrometers, SPICAM on MEX and ACS and NOMAD on TGO, carry out now the measurements of water vertical distribution from Mars’ orbit. They have got already prominent results as a supersatutation of water during the aphelion and perihelion season [2,3], high altitude water during global dust storms of MY28 [4] and MY34 [3,5] and high perihelion water in MY34 [3,6].
Observations
In this work, we present the first multi-annual survey of water vapor in the middle atmosphere of Mars based on SPICAM/MEx occultation measurements. SPICAM IR is an infrared spectrometer employing an Acousto-Optic Tunable Filter (AOTF) working in the spectral range of 1-1.7 μm with a spectral resolution of 3.5-4 cm-1, nearly constant in wavenumbers [7]. SPICAM can observe the H2O vertical distribution using the 1.38 µm band, the CO2 density in the 1.43 µm band, and the aerosol density and size distribution using several continuum portions of the spectrum. We analyzed Eight Martian years of H2O vertical distribution from MY27 to MY34.
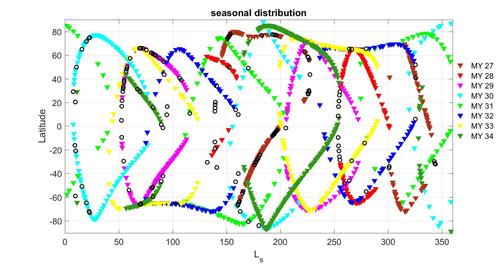
Figure 1. Seasonal-latitudinal coverage of SPICAM observations in solar occultations for eight Martian years. The open circles mark faulty observations inapplicable for retrieval.
Results
The upper limit of water density detected by SPICAM varies from 50-60 km in aphelion to 70-90 km in perihelion. In aphelion (Ls=0-120°), the H2O mixing ratio <30 ppm at levels above hygropause. At Ls=60-120° the hygropause height varies from 15 to 25 km in middle northern latitudes. The perihelion season through regular years has not shown a prominent increase of the water content in high altitudes in the Northern hemisphere. In the Southern hemisphere the increase of density and mixing ratio was observed for all Martian years at an altitude of 50-80 km. The largest mixing ratio >100 ppm at 40-90 km was observed at Ls=240-290° in high and middle southern latitudes. We also present a comparison of two global dust storms of MY28 and 34 and we concluded that the GDS of MY28, coincident with southern summer solstice, shows a noticeably higher water increase.
References
[1] Montmessin, F., Smith, M., Langevin, Y., Mellon, M., & Fedorova, A. (2017). The Water Cycle. In R. Haberle, R. Clancy, F. Forget, M. Smith, & R. Zurek (Eds.), The Atmosphere and Climate of Mars (Cambridge Planetary Science, pp. 338-373). Cambridge: Cambridge University Press.
[2] Maltagliati, L., Montmessin, F., Fedorova, A., Korablev, O., Forget, F., Bertaux, J.-L., 2011a. Evidence of Water Vapor in Excess of Saturation in the Atmosphere of Mars. Science 333, 1868-.
[3] Fedorova, A. A., et al. (2020). "Stormy water on Mars: The distribution and saturation of atmospheric water during the dusty season." Science 367(6475): 297-300.
[4] Fedorova A., Jean-Loup Bertaux, Daria Betsis, Franck Montmessin, Oleg Korablev, Luca Maltagliati, John Clarke, Water vapor in the middle atmosphere of Mars during the 2007 global dust storm, Icarus 300, 15 January 2018, Pages 440-457.
[5] Aoki, S., et al. (2019). "Water Vapor Vertical Profiles on Mars in Dust Storms Observed by TGO/NOMAD." Journal of Geophysical Research: Planets 124(12): 3482-3497.
[6] Maltagliati, L., Montmessin, F., Korablev, O., et al. 2013. Annual survey of water vapor vertical distribution and water–aerosol coupling in the martian atmosphere observed by SPICAM/MEx solar occultations. Icarus 223, 942-962.
[7] Korablev, O. et al., 2006a. “SPICAM IR acousto-optic spectrometer experiment on Mars Express.” Journal of Geophysical Research: Planets 111(E9): E09S03.
How to cite: Fedorova, A., Montmessin, F., Korablev, O., Lefevre, F., Lacombe, G., and Bertaux, J.-L.: Multi-annual monitoring of the water vapor vertical distribution on Mars by SPICAM on Mars Express, Europlanet Science Congress 2020, online, 21 Sep–9 Oct 2020, EPSC2020-742, https://doi.org/10.5194/epsc2020-742, 2020.
The Trace Gas Orbiter, TGO, concluded its first Martian year in orbit in March 2020. It has been a highly successful Martian year, starting with the rise, plateau and decay of the major Global Dust Storm in the summer of 2018. This has enabled interesting results to be derived on the dynamic behaviour as a consequence of the dust storm. One of the significant observations is a strong upward transport of water vapour that has been found during this time. Characterisations of the minor species and trace gasses are continuing and large numbers of profiles are being produced on a daily basis. A dedicated search of methane has shown that there is no methane above an altitude of a few km, with an upper limit established at about 20 pptv (2∙10-11).
The solar occultation technique applied by the spectrometers has definitely proven its strength, both for its high sensitivity and for its capability of making high-resolution altitude profiles of several parameters in the atmosphere. Climatological studies, benefitting from the 400km, 74 degrees inclination non-solar synchronous orbit, have been initiated and will become more important now that a full year has passed, even if the full potential will be visible only after a few Martian years of operation. The FREND instrument has characterised the hydrogen in the shallow sub-surface on a global scale, at a spatial resolution much better than previous missions have been able to do. It has found areas at surprisingly low latitudes with significant amounts of sub-surface hydrogen, most likely in the form of water ice. The CaSSIS camera has made a high number of images over a large variety of targets, including the landing sites of the 2020 NASA and 2022 ESA rovers, Oxia Planum and the Jezero Crater. Stereo imaging has enabled topographic information and precise 3-D landscape synthesis.
This presentation will summarise the highlights of the first Martian year and discuss planned activities for the near and medium term future.
The ExoMars programme is a joint activity by the European Space Agency (ESA) and ROSCOSMOS, Russia. It consists of the ExoMars 2016 mission, launched 14 March 2016, with the Trace Gas Orbiter, TGO, and the Entry Descent and Landing Demonstrator, EDM, named Schiaparelli, and the ExoMars 2020 mission, to be launched in July/August 2020, carrying a Rover and a surface science platform to the surface of Mars.
How to cite: Svedhem, H., Korablev, O., Mitrofanov, I., Rodionov, D., Thomas, N., Vandaele, A. C., Vago, J. L., Forget, F., and Wilson, C.: The ExoMars Trace Gas Orbiter - First Martian Year in Orbit, Europlanet Science Congress 2020, online, 21 Sep–9 Oct 2020, EPSC2020-802, https://doi.org/10.5194/epsc2020-802, 2020.
Abstract
The Atmospheric Chemistry Suite (ACS) [1], one of the four science experiments on board ESA-Roscosmos ExoMars 2016 Trace Gas Orbiter (TGO) mission has started science operations in March 2018. ACS consists of 3 infrared spectrometers targeting the unambiguous detection of trace gases of potential geophysical or biological interest. The dataset reported here concerns the methane detection attempts conducted during the first complete Martian year (almost two Earth years) of observations using ultra-sensitive occultation observing mode in orbit around Mars.
The Trace Gas Orbiter (TGO) of the ESA-Roscosmos ExoMars mission has ended its trip to Mars, reaching the planet in October 2016. After a year-long aerobraking phase, its scientific mission has begun on April 22nd, 2018 with the execution of the first solar occultation. The primary objective of TGO is to detect, map and locate trace gas sources, possibly revealing a residual geophysical (or even biological) activity on Mars. The instrument of interest here is the infrared spectrometer Atmospheric Chemistry Suite (ACS). ACS covers a wavelength range from 0.7 to 17 μm at very high spectral resolution (λ / Δλ from 5,000 to 50,000). ACS operates in nadir and solar occultation. Its performances complete the TGO trace gas detection arsenal together with NOMAD, the other infrared sounder of TGO.
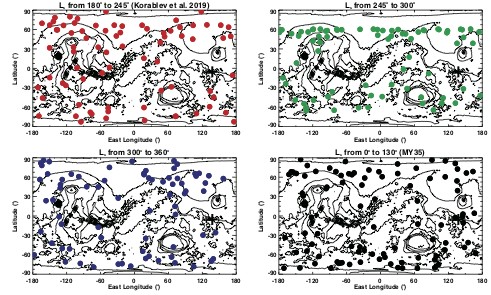
A large part of the first months of the ACS observing mission has enabled the sensitive search of gaseous methane over a substantial fraction of the Martian globe. The results from the first occultation up until early September 2018 will be presented. This period incidentally covered the onset, the full development, and the demise of the Planetary Encircling Dust Event observed by several other instruments orbiting currently around Mars. Observing conditions proved more favourable than anticipated, and it was possible in a few cases to probe the Martian atmosphere close to the surface (<5 km) where the MSL Curiosity rover has established the existence of a seasonally varying background level of CH4 concentrations ranging between 240 and 650 pptv [2].

The first five months of ACS CH4 detection attempts were reported in [3], revealing the absence of methane detection over most of the Martian globe (Figure 1). Part of the attempts at that time was impaired by the presence of abundant amounts of dust particles that prevent observing the lower troposphere of Mars (<30 km) where methane, if detectable, presumably concentrates.
The ACS dataset analyzed here covers a period of more than 25 months, which is five times more data (Figure 2) than previously analyzed. This gives us a chance to perform a deeper exploration into the potential presence of methane and the consequences it may have for our understanding of active geophysical and physicochemical processes prevailing at Mars.
How to cite: Montmessin, F., Korablev, O., Fedorova, A. A., Trokhimovskiy, A. V., Lefevre, F., Baggio, L., Belyaev, D. A., Olsen, K., Alday, J., Irbah, A., Lacombe, G., Patrakeev, A., Teinturier, L., Ignatiev, N., Luginin, M., Shakun, A., Guerlet, S., Forget, F., Millour, E., and Wilson, C. F.: Hunting for Methane on Mars: one Martian year of survey with ACS on TGO, Europlanet Science Congress 2020, online, 21 Sep–9 Oct 2020, EPSC2020-637, https://doi.org/10.5194/epsc2020-637, 2020.
The NOMAD (“Nadir and Occultation for MArs Discovery”) spectrometer suite on board the ExoMars Trace Gas Orbiter has been designed to investigate the composition of Mars' atmosphere, with a particular focus on trace gases, clouds and dust. The instrument probes the ultraviolet and infrared regions covering large parts of the 0.2-4.3 µm spectral range [1,2], with 3 spectral channels: a solar occultation channel (SO – Solar Occultation; 2.3–4.3 μm), a second infrared channel capable of nadir, solar occultation, and limb sounding (LNO – Limb Nadir and solar Occultation; 2.3–3.8 μm), and an ultraviolet/visible channel (UVIS – Ultraviolet and Visible Spectrometer, 200–650 nm).
Since its arrival at Mars in April 2018, NOMAD performed solar occultation, nadir and limb observations dedicated to the determination of the composition and structure of the atmosphere. Here we report on the different discoveries highlighted by the instrument during its first full Martian year of observations: investigation of the 2018 Global dust storm and its impact on the water uplifting and escape, on temperature and pressure increases within the atmosphere; dust and ice clouds distribution; ozone measurements; dayglow observations; detection of HCl vertical profiles and in general advances in the analysis of the spectra recorded by the three channels of NOMAD.
References
[1] Vandaele, A.C., et al., 2015. Planet. Space Sci. 119, 233-249.
[2] Vandaele et al., 2018. Space Sci. Rev., 214:80, doi.org/10.1007/s11214-11018-10517-11212.
How to cite: Vandaele, A. C., Daerden, F., Thomas, I. R., Aoki, S., Depiesse, C., Erwin, J., Neary, L., Piccialli, A., Ristic, B., Robert, S., Trompet, L., Viscardy, S., Willame, Y., Mason, J., Patel, M., Bellucci, G., and Lopez-Moreno, J.-J.: NOMAD on ExoMars Trace Gas Orbiter: One Martian year of observations, Europlanet Science Congress 2020, online, 21 Sep–9 Oct 2020, EPSC2020-56, https://doi.org/10.5194/epsc2020-56, 2020.
Fine Resolution Epithermal Neutron Detector (FREND) is an instrument onboard ExoMars' Trace Gas Orbiter. Its measurements of epithermal neutron flux on orbit provide data on hydrogen (and thus, water) content in the 1-m thick near-surface regolith layer. Similar experiments have been performed before, neutron sounding is a well-established technique for estimating water content in the celesital body's soil. FREND's chatacteristic feature is its collimator - a massive body surrounding detectors and narrowing their field of view substantially, thus providing for very high spatial resolution, around 60 to 200 km, depending on measurement conditions. Such spatial resolution allows identifying local water-rich features with relief and other geomorphological features, assess water content in small ellipses of future landing sites.
In this study we present latest findings based on FREND data, containing a number of surprisingly "wet" local features in the equatorial band. Water or water ice is not stable at the surface of Mars, in the equatorial regions especially, that is why locating areas with enhanced subsurface hydrogen or water is of much interest both to scientists and for the purpose of planning future exploration missions.
How to cite: Malakhov, A., Mitrofanov, I., Litvak, M., Sanin, A., Golovin, D., Anikin, A., Djachkova, M., Lisov, D., Lukyanov, N., and Nikiforov, S.: Local water-rich areas on Mars found by the FREND neutron telescope onboard ExoMars TGO, Europlanet Science Congress 2020, online, 21 Sep–9 Oct 2020, EPSC2020-961, https://doi.org/10.5194/epsc2020-961, 2020.
Introduction: The Martian surface hosts a variety of active surface processes [1-3] whose regular monitoring is key to providing us insights into past and present-day surface, geologic and climatic conditions [4]. Most change detection studies on Mars utilize time-series image acquisitions from the Mars Reconnaissance Orbiter (MRO) High Resolution Imaging Science Experiment (HiRISE; 25-50 cm/px) [5] and the Context Camera (CTX; 5-6 m/px) [6]. However, the relatively narrow HiRISE colour swath (~20% of the image swath) results in a lower probability of observing surface changes with multiple wavelengths.
The Colour and Stereo Surface Imaging System (CaSSIS) onboard the ExoMars Trace Gas Orbiter (TGO) [7] permits 4-band VNIR colour coverage at 4.6 m/px and an image swath >6 km. Furthermore, TGO/CaSSIS is able to observe Mars at multiple times of day, permitting detection/monitoring of diurnal processes.
While TGO has only been in operation for a short period of time (MY34-35), the development of simulated CaSSIS images from MRO datasets [8] permits the monitoring of long-term surface changes with CaSSIS from as early as MY28 to present. This work assesses the change detection capabilities of CaSSIS by using a combination of simulated and actual CaSSIS images of one of the most active Martian gully sites to date – Gasa Crater [9-12] .
Methods: We initially restricted the simulated CaSSIS images for this study to pre-2012 acquisitions, as our ability to fully photometrically correct CRISM targeted observations for along-track variations in emission/phase is confounded due to the loss of the full gimbal range of CRISM in late 2012 [8]. Three coordinated CRISM/CTX pairs were selected for production into simulated CaSSIS cubes based on a combination of favourable geometries, coverage, estimated atmospheric dust opacities and notable changes. Simulated CaSSIS images were generated using the procedures in [8] where spectrally and spatially resampled CaSSIS-compatible CRISM and CTX products are combined into a rigorous fully-simulated CaSSIS image using a Gram-Schmidt spectral pan-sharpening algorithm, which retains I/F information and minimises colour/spectral distortions [13]. To reduce atmospheric contributions, a dark-object-subtraction technique [14] was applied to both simulated and actual images. All images, including the first actual CaSSIS image acquired on Ls 350, MY34 were overlain and compared to one another to identify visible colour and/or morphologic changes. Notable changes were then compared with previously documented activity.
Results and Discussion: We observe 28 possible changes between the simulated and actual CaSSIS image cubes spanning MY28 to MY34 (Fig. 1). Of these, 20 are previously undocumented changes, including 8 putative new changes and 12 fading flows (black-arrows in Fig. 1). All new/previously unrecognized changes are currently under active investigation with associated HiRISE coverage to verify if observed physical changes are not a manifestation of variable illumination conditions. Prominent changes previously observed between MY28 to 30 by [9,10] are all on the northern and north-eastern crater walls (red-arrows in Figs. 1a-c). While one prominent physical change (orange-arrow in Fig. 1c) was previously identified with a simulated CaSSIS image by [8], we note that 5 meter-scale physical changes noted by [9,10] are unresolved by CaSSIS products.
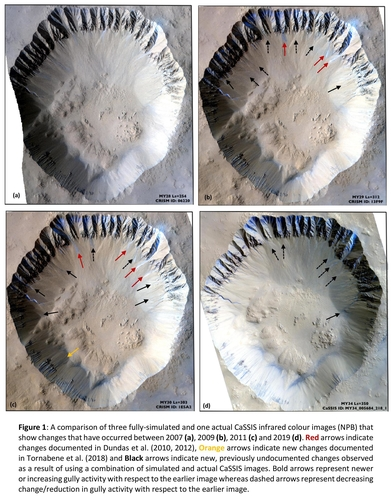
Putative new colour changes are observed between MY29 and MY34 (Figs. 1, 2). Six of these were not readily visible with HiRISE due to lack of colour coverage. One prominent example includes a bright-bluish deposit in the eastern part of the crater (Figs. 1b-c). These deposits have an NIR-signature that suggests they are possible ferrous-bearing materials sourced from the gully alcoves [8,12,15].
The most-notable recent putative change based on our first CaSSIS acquisition of Gasa (Ls 350, MY34) shows a bright-bluish deposit on the eastern crater wall that spills partially onto the crater floor (Figs. 1d, 2). Although previous HiRISE acquisitions between MY31 and MY34 seem to show possible morphological changes, lack of HiRISE colour coverage over this deposit makes it difficult to verify the activity. A new optimally-positioned HiRISE acquisition later this year will enable us to verify this surface change (if it has not since faded).
Conclusions: This study demonstrates how both simulated and actual CaSSIS cubes are useful for detecting both previously documented and potentially new gully activity at Gasa Crater. While CaSSIS may not capture all small meter-scale physical changes that HiRISE does, it allows for a much-improved colour-change capability over HiRISE. However, continuing to monitor with both instruments is pivotal, as CaSSIS detections of prominent colour changes can be used to reposition HiRISE to better target colour-coverage to validate and characterise meter-scale surface changes. Despite anticipated photometric complications that post-2012 CRISM targeted observations offer, future work will also include an assessment of simulated CaSSIS products generated with post-2012 CRISM and CTX coordinated data to assess identification of both new and previously documented HiRISE changes [16] after MY30.
References: [1] McEwen et al. (2010), Icarus 205(1) [2] Bridges et al. (2013), Aeol. Res. 9 [3] Munaretto et al. (2020), PSS 187 [4] Greeley and Iversen (1985), Cambridge Univ. Press [5] McEwen et al. (2007), JGR 112 [6] Malin et al. (2007), JGR 112 [7] Thomas et al. (2017), SSR 212 [8] Tornabene et al. (2018), SSR 214(18) [9] Dundas et al. (2010), GRL 37 [10] Dundas et al. (2012), Icarus 220 [11] Dundas et al. (2015), Icarus 251 [12] Harrison et al. (2019), Geol. Soc. 467(1) [13] Laben et al. (2000), US Patent No: 6011875 [14] Chavez (1988), RSE 24(3) [15] Okubo et al. (2011), Icarus 211(1) [16] Dundas et al. (2019), Geol. Soc. 467(1).
Acknowledgements: We thank the spacecraft and instrument engineering teams for the successful completion of the instrument. CaSSIS is a project of the University of Bern and funded through the Swiss Space Office via ESA's PRODEX programme. The instrument hardware development was also supported by the Italian Space Agency (ASI), INAF/Astronomical Observatory of Padova, and the Space Research Center (CBK) in Warsaw. Support from SGF (Budapest), the University of Arizona (Lunar and Planetary Lab.) and NASA are also gratefully acknowledged. The lead author acknowledges support from Tornabene’s funding from the CSA’s Planetary and Astronomy Missions Co-Investigator programme (19PACOI07) and the Canadian NSERC Discovery Grant programme (06418-2020 RGPIN).
How to cite: Rangarajan, V. G., Tornabene, L. L., Osinski, G. R., Seelos, F. P., Conway, S. J., Patel, M. R., Thomas, N., Cremonese, G., Pajola, M., Munaretto, G., Lucchetti, A., and CaSSIS Team, T.: Change detection analyses using simulated and actual ExoMars TGO-CaSSIS images: A case study based on past and present Gasa Crater gully activity, Europlanet Science Congress 2020, online, 21 Sep–9 Oct 2020, EPSC2020-475, https://doi.org/10.5194/epsc2020-475, 2020.
Nadir and Occultation for Mars Discovery (NOMAD) onboard ExoMars Trace Gas Orbiter (TGO) started the science measurements on 21 April, 2018. We present results on the retrievals of water vapor vertical profiles in the Martian atmosphere from the first Mars year measurements of the TGO/NOMAD.
NOMAD is a spectrometer operating in the spectral ranges between 0.2 and 4.3 μm onboard ExoMars TGO. NOMAD has 3 spectral channels: a solar occultation channel (SO – Solar Occultation; 2.3–4.3 μm), a second infrared channel capable of nadir, solar occultation, and limb sounding (LNO – Limb Nadir and solar Occultation; 2.3–3.8 μm), and an ultraviolet/visible channel (UVIS – Ultraviolet and Visible Spectrometer, 200–650 nm). The infrared channels (SO and LNO) have high spectral resolution (λ/dλ~10,000–20,000) provided by an echelle grating used in combination with an Acousto Optic Tunable Filter (AOTF) which selects diffraction orders. The concept of the infrared channels are derived from the Solar Occultation in the IR (SOIR) instrument onboard Venus Express (VEx). The sampling rate for the solar occultation measurement is 1 second, which provides better vertical sampling step (~1 km) with higher resolution (~2 km) from the surface to 200 km. Thanks to the instantaneous change of the observing diffraction orders achieved by the AOTF, the SO channel is able to measure five or six different diffraction orders per second in solar occultation mode. In this study, we analyze the solar occultation measurements at diffraction order 134 (3011-3035 cm-1), order 136 (3056-3080 cm-1) and 168 (3775-3805 cm-1) acquired by the SO channel in order to investigate H2O vertical profiles.
Knowledge of the water vapor vertical distribution is important to understand the water cycle and escape processes. Solar occultation measurements by the two spectrometers onboard TGO - NOMAD and Atmospheric Chemistry Suite (ACS) - allow us to monitor daily the water vapor vertical profiles through one whole Martian Year and obtain a latitudinal map for every ~20° of Ls. In 2018, for the first time after 2007, a global dust storm occurred on Mars. It lasted for more than two months (from June to August). Moreover, following the global dust storm, a regional dust storm occurred in January 2019. TGO began its science operations on 21 April 2018. NOMAD observations therefore fully cover the period before/during/after the global and regional dust storms and offer a unique opportunity to study the trace gases distributions during such events. We have analyzed those datasets and found a significant increase of water vapor abundance in the middle atmosphere (40-100 km) during the global dust storm from June to mid-September 2018 and the regional dust storm in January 2019. In particular, water vapor reaches very high altitudes, at least 100 km, during the global dust storm (Aoki et al., 2019, Journal of Geophysical Research, Volume124, Issue12, Pages 3482-3497, doi:10.1029/2019JE006109). A GCM simulation explained that dust storm related increases of atmospheric temperatures suppress the hygropause, hence reducing ice cloud formation and so allowing water vapor to extend into the middle atmosphere (Neary et al., 2020, Geophysical Research Letters, 47, e2019GL084354., doi: 10.1029/2019GL084354). The current study presents the results obtained when considering the extended dataset, which covers a full Martian year. The extended dataset includes the recent aphelion season that involves interesting phenomena such as sublimation of water vapor from the northern polar cap and formation of the equatorial cloud belt, and is known as a key period to understand the large north-south hemispheric asymmetries of Mars water vapor. Yet, until now, only few papers reported the water vapor vertical distribution during the aphelion season. The extended dataset also includes the period when the global dust storm occurred the year before; this will allow us to compare the water vapor distributions under global dust storm conditions with those found during non-global dust storm years. In the presentation, we will discuss the H2O vertical profiles as well as the aerosols vertical distribution retrieved from the first full Martian year measurements of the TGO/NOMAD.
How to cite: Aoki, S., Vandaele, A., Daerden, F., Villanueva, G., Thomas, I., Erwin, J., Trompet, L., Robert, S., Neary, L., Viscardy, S., Piccialli, A., Liuzzi, G., Crismani, M., Clancy, T., Smith, M., Ristic, B., Lopez-Valverde, M.-A., Patel, M., Bellucci, G., and Lopez-Moreno, J.-J.: Water vapor vertical profiles on Mars: Results from the first full Mars Year of TGO/NOMAD science operations, Europlanet Science Congress 2020, online, 21 Sep–9 Oct 2020, EPSC2020-392, https://doi.org/10.5194/epsc2020-392, 2020.
Abstract
We report retrievals in the 2.53 – 2.79 μm spectral range using the Atmopheric Chemistry Suite onboard of ExoMars Trace Gas Orbiter, which allow the simultaneous measurement of vertical profiles of H and O isotope ratios in water vapour in the Martian atmosphere. The large coverage of ACS MIR solar occultations provides the possibility to analyse the spatial, seasonal and diurnal variations of these ratios.
1. Introduction
Isotopic ratios in C, O and H provide important clues to understand the history and evolution of volatiles on Mars. Enrichment of the D/H ratio by a factor of approximately 5.5 in atmospheric water vapour with respect to the Vienna Standard Mean Ocean Water [1] has often been understood as evidence of the substantial atmospheric escape into space.
On the other hand, oxygen isotope ratios in both water vapour and carbon dioxide do not show substantial enrichment of the heavier isotopes (e.g. [2],[3]). The lack of substantial fractionation therefore indicates the presence of a large reservoir of oxygen to exchange with the atmosphere [4].
In this work, we use solar occultation measurements made with the mid-infrared (MIR) channel of the Atmospheric Chemistry Suite (ACS), onboard ExoMars Trace Gas Orbiter (TGO) to measure the evolution of the vertical structure of the isotopic composition of water vapour (D/H, 18O/16O and 17O/16O) at the terminator for a full Martian year.
2. Measurements
ACS consists of a set of three infrared spectrometers covering a total wavelength range from 0.7 to 17 μm. The MIR channel, used in this study, is a cross-dispersion echelle spectrometer dedicated to solar occultation measurements in the 2.3-4.2 μm (2300-4400 cm-1) range, with the main objective of measuring high resolution spectra (λ/Δλ∼30000-50000) in a wide instantaneous spectral range (width 0.15-0.3 μm). In order to cover the full spectral range, MIR is equipped with a steerable secondary grating that allows the selection of different diffraction orders [5].
In this work, we analyse MIR spectra in secondary grating positions 4 and 5, which allow the simultaneous measurement of several diffraction orders covering a spectral range from 2.67 to 2.79 μm (3584-3745 cm-1) and 2.53 to 2.67 μm (3745-3952 cm-1), respectively. We select spectral windows in several diffraction orders, which show absorption lines of the four main oxygen isotopologues of water vapour (H216O, H218O, H217O, HD16O) and CO2 (see Figure 1).

Figure 1: Example of one ACS MIR spectral window in diffraction order 224, measured at tangent heights of 19, 35 and 50 km. The black dots represent the measured spectra, and the green line shows the best fit to the data. The contribution from each species to the spectra is also shown, following the colours in the legend.
3. Radiative Transfer Analysis
The analysis of the spectra is performed using the NEMESIS code [6], which works under the optimal estimation framework. In particular, for each solar occultation, we retrieve simultaneous vertical profiles of pressure, temperature and volume mixing ratio of the four main water isotopologues.
The pressure and temperature profiles can be constrained from the CO2 absorption lines under the assumption of hydrostatic equilibrium and a given CO2 volume mixing ratio profile, which we obtain from the Mars Climate Database [7]. In the case of the water vapour isotopologues, the volume mixing ratios can be constrained from the depth of the corresponding absorption lines, which are observed up to 60 km approximately.
The retrieval scheme is applied to all ACS MIR observations made with secondary grating positions 4 and 5 for a full Martian year, covering a wide range of latitudes, seasons, and local time, and enabling, for the first time, the study of the climatology of both the O and H isotopic ratios in Martian water vapour.
4. Summary and Conclusions
Vertical profiles of the isotope ratios in the four main water vapour isotopologues (D/H, 18O/16O and 17O/16O) at the terminator are obtained using solar occultation measurements by the Atmospheric Chemistry Suite onboard ExoMars Trace Gas Orbiter.
The large coverage of ACS solar occultation measurements allows, for the first time, the analysis of the variations of the O and H isotopic composition of water vapour for a full Martian year.
References
[1] Owen, T., Maillard, J. P., de Bergh, C., and Lutz, B. L..: Deuterium on Mars: The abundance of HDO and the values of D/H, Science, 240, 1767 LP - 1767, 1988.
[2] Webster, C. R., Mahaffy, P. R., Flesch, G. J., Niles, P. B., Jones, J. H., Leshin, L. A., Atreya, S. K., Stern, J. C., Chrsitensen, L. E., Owen, T., Franz, H., Pepin, R. O., and Steele, A.: Isotope Ratios of H, C and O in CO2 and H2O of the Martian Atmosphere, Science, 341, 260 LP – 263, 2013.
[3] Krasnopolsky, V.A., Maillard, J. P., Owen, T., Toth, R. A., Smith, M. D.: Oxygen and carbon isotope ratios in the martian atmosphere, Icarus, Vol. 192, Issue 2, 2007.
[4] Jakosky, B. M.: Mars Volatile Evolution: Evidence from Stable Isotopes, Icarus, 94, 14-31, 1991.
[5] Korablev et al.: The Atmospheric Chemistry Suite (ACS) of Three Spectrometers for the ExoMars 2016 Trace Gas Orbiter, Space Science Reviews, vol. 214, pag. 7, 2017.
[6] Irwin, P., Teanby, N., de Kok, R., Fletcher, L., Howett, C., Tsang, C., Wilson, C., Calcutt, S., Nixon, C., Parrish, P.: The NEMESIS planetary atmosphere radiative transfer and retrieval tool, Journal of Quantitative Spectroscopy and Radiative Transfer,109, 1136-1150.
[7] Forget, F., Hourdin, F., Fournier, R., Hourdin, C., Talagrand, O., Collins, M., Lewis, S. R., Read, P. L., and Huot, J-P: Improved general circulation models of the Martian atmosphere from the surface to above 80 km, Journal of Geophysical Research: Planets, 104, 24155-24175, 1999.
How to cite: Alday, J., Irwin, P. G. J., Wilson, C. F., Olsen, K. S., Baggio, L., Montmessin, F., Korablev, O., Trokhimovskiy, A., Fedorova, A. A., Belyaev, D. A., Shakun, A., Patrakeev, A., and Grigoriev, A.: Isotopic composition of water vapour in the Martian atmosphere: vertical profiles from ACS MIR on ExoMars TGO, Europlanet Science Congress 2020, online, 21 Sep–9 Oct 2020, EPSC2020-590, https://doi.org/10.5194/epsc2020-590, 2020.

How to cite: Rossi, L., Vals, M., Montmessin, F., Forget, F., Millour, E., Olsen, K., Fedorova, A., Trokhimovskiy, A., and Korablev, O.: Modeling of the effect of the MY34 Global Dust Storm on the martian HDO cycle., Europlanet Science Congress 2020, online, 21 Sep–9 Oct 2020, EPSC2020-626, https://doi.org/10.5194/epsc2020-626, 2020.
Nadir and Occultation for Mars Discovery (NOMAD) onboard ExoMars Trace Gas Orbiter (TGO) started the science measurements on 21 April 2018. We present results on the retrievals vertical profiles for several species in the Martian atmosphere from the first year measurements of the TGO/NOMAD. In particular, we present our progress on retrieving CO vertical profiles.
NOMAD Instrument
NOMAD, the “Nadir and Occultation for Mars Discovery” spectrometer suite [1], is part of the payload of the ExoMars Trace Gas Orbiter mission 2016. The instrument will conduct a spectroscopic survey of Mars’ atmosphere in the UV, visible and IR wavelengths covering the 0.2-0.65 and 2.3-4.3µm spectral ranges. NOMAD is composed of three channels: a solar occulation channel (SO) operating in the IR, a limb and nadir channel (LNO) also operating in the IR, and an ultraviolet/visible channel (UVIS) that can perform all observation modes. The spectral resolutions of SO and LNO is a significant improvement on previous infrared surveys of Mars (λ/dλ~15000). Both SO and LNO consist of an acousto-optic tunable filter (AOTF) in combination with an echelle grating. Several spectral ranges are measured simultaneously at a high spectral resolution, allowing for the study of different molecular species. The design of the three channels is fully described in [2] and [3].
Vertical Profile Retrievals
The vertical sampling rate of the SO channel is typically ~1km, which provided an unprecedented vertical resolution from the surface up to ~200km. ExoMars TGO has a ~2 hour orbital period, and the SO channel operates on ~50% of the potential occultations, which leads to great monitoring of the climatology. The calibration of SO is a collaborative exercise with retrievals, but inherits many of the techniques used for the SOIR/VEX instrument described in [4]. The retrievals are performed using the software ASIMUT developed at BIRA-IASB [5], which can use Optimal Estimation Method [6] among other algorithms to retrieved atmospheric profiles.
Discussion and Results
Carbon Monoxide is a non-condensable species playing a major role in the photochemical cycle of CO2. Local and seasonal variations are expected and will give valuable constraints for the dynamical processes in the Martian atmosphere. The 2-0 band of CO centered at 2.4µm is positioned in the SO orders 186-192 (4200-4350cm-1). It is easily measurable in transmittances up to ~110km. In the figure above, we show that we have good observational coverage. In this presentation, we will talk about how we retrieve abundances from spectral absorption features, and try to isolate climatological effects from observational geometry.
References
[1] E. Neefs et al. (2015) Applied Optics, Vol. 54.
[2] I. R. Thomas et al. (2016) Optics Express, Vol. 24.
[3] A. C. Vandaele et al. (2015) Optics Express, Vol. 23.
[4] L. Trompet (2016) Applied Optics, Vol. 55.
[5] A. C. Vandaele (2006) Conf. Proc. of the first ‘Atmosphere Science Conference’.
[6] C. D. Rodgers (2000) World Scientific.
[7] A. C. Vandaele (2019) Nature 568.
Acknowledgements:
The NOMAD experiment is led by the Royal Belgian Institute for Space Aeronomy (IASB-BIRA), assisted by Co-PI teams from Spain (IAA-CSIC), Italy (INAF-IAPS), and the United Kingdom (Open University). This project acknowledges funding by the Belgian Science Policy Office (BELSPO), with the financial and contractual coordination by the ESA Prodex Office (PEA 4000103401, 4000121493), by Spanish Ministry of Science and Innovation (MCIU) and by European funds under grants PGC2018-101836-B-I00 and ESP2017-87143-R (MINECO/FEDER), as well as by UK Space Agency through grants ST/R005761/1, ST/P001262/1, ST/R001405/1 and ST/R001405/1 and Italian Space Agency through grant 2018-2-HH.0. This work was supported by the Belgian Fonds de la Recherche Scientifique – FNRS under grant number 30442502 (ET_HOME). The IAA/CSIC team acknowledges financial support from the State Agency for Research of the Spanish MCIU through the ‘Center of Excellence Severo Ochoa’ award for the Instituto de Astrofísica de Andalucía (SEV-2017-0709). US investigators were supported by the National Aeronautics and Space Administration. Canadian investigators were supported by the Canadian Space Agency.
How to cite: Erwin, J., Aoki, S., Thomas, I., Trompet, L., Vandaele, A. C., Robert, S., Daerden, F., Ristic, B., Lopez-Moreno, J. J., Bellucci, G., and Patel, M.: Martian Atmosphere CO Vertical Profiles: Results from the First Year of TGO/NOMAD Science Operations, Europlanet Science Congress 2020, online, 21 Sep–9 Oct 2020, EPSC2020-668, https://doi.org/10.5194/epsc2020-668, 2020.
1. Introduction
Rapid variations in species concentration at the terminator have the potential to cause asymmetries in the species distributions along the line of sight (LOS) of a solar occultation experiment. Ozone, in particular, displays steep gradients across the terminator of Mars due to photolysis [1]. Nowadays, most of the retrieval algorithms for solar and stellar occultations rely on the assumption of a spherically symmetrical atmosphere. However, photochemically induced variations near sunrise/sunset conditions need to be taken into account in the retrieval process in order to prevent inaccuracies.
Here, we investigated the impact of gradients along the LOS of the solar occultation experiment TGO/NOMAD-UVIS for the retrieval of ozone under sunrise/sunset conditions. We used the diurnal variations in the ozone concentration obtained from photochemical model calculations together with an adapted radiative transfer code.
2. The NOMAD UVIS channel
NOMAD is a spectrometer composed of 3 channels: 1) a solar occultation channel (SO) operating in the infrared (2.3-4.3 μm); 2) a second infrared channel LNO (2.3-3.8 μm) capable of doing nadir, as well as solar occultation and limb; and 3) an ultraviolet/visible channel UVIS (200-650 nm) that can work in the three observation modes [2,3].
The UVIS channel has a spectral resolution <1.5 nm. In the solar occultation mode it is mainly devoted to study the climatology of ozone and aerosols content [4].
Since the beginning of operations, on 21 April 2018, NOMAD UVIS acquired more than 3000 solar occultations with an almost complete coverage of the planet.
3. Retrieval technique
NOMAD-UVIS spectra are simulated using the line-by-line radiative transfer code ASIMUT-ALVL developed at IASB-BIRA [5]. In a preliminary study based on SPICAM-UV solar occultations (see [6]), ASIMUT was modified to take into account the atmospheric composition and structure at the day-night terminator. As input for ASIMUT, we used gradients predicted by the 3D GEM-Mars v4 Global Circulation Model (GCM) [7,8]. UVIS ozone profiles will also be compared to SPICAM-UV retrievals.
4. Summary and future work
We will present ozone vertical profiles retrieved from the first Martian year of observations from TGO/NOMAD-UVIS. In addition, we plan to compare our retrievals to SPICAM-UV observations. As first step, we will retrieve O3 profiles without taking in account gradients. Then, we will investigate the effects of ozone density gradients on the retrieval of ozone.
References
[1] Lefèvre, F., Bertaux, J.L., Clancy, R. T., Encrenaz, T., Fast, K., Forget, F., Lebonnois, S., Montmessin, F., Perrier, S., Aug. 2008. Heterogeneous chemistry in the atmosphere of Mars. Nature 454, 971–975.
[2] Vandaele, A.C., et al., Planetary and Space Science, Vol. 119, pp. 233–249, 2015.
[3] Neefs, E., et al., Applied Optics, Vol. 54 (28), pp. 8494-8520, 2015.
[4] M.R. Patel et al., In: Appl. Opt. 56.10 (2017), pp. 2771–2782. DOI: 10.1364/AO.56.002771.
[5] Vandaele, A.C., et al., JGR, 2008. 113 doi:10.1029/2008JE003140.
[6] Piccialli, A., Icarus, 2019,
[7] Neary, L., and F. Daerden (2018), Icarus, 300, 458–476, doi:10.1016/j.icarus.2017.09.028.
[8] Daerden et al., 2019, Icarus 326, https://doi.org/10.1016/j.icarus.2019.02.030
How to cite: Piccialli, A., Vandaele, A. C., Willame, Y., Aoki, S., Depiesse, C., Trompet, L., Neary, L., Viscardy, S., Daerden, F., Erwin, J., Thomas, I. R., Ristic, B., Mason, J. P., Patel, M., Bellucci, G., and Lopez-Moreno, J.-J.: Impact of gradients at the Martian terminator on the retrieval of ozone from TGO/NOMAD-UVIS, Europlanet Science Congress 2020, online, 21 Sep–9 Oct 2020, EPSC2020-670, https://doi.org/10.5194/epsc2020-670, 2020.
The ExoMars Trace Gas Orbiter (TGO) mission had started regular measurements in 2018. Primary goal of the mission is to quantify trace gases that could indicate geologic or biogenic activity on Mars (Vago et al., 2015). Atmospheric Chemistry Suite mid-infrared channel (ACS MIR) is a high resolution cross-dispersion spectrometer operating in solar occultation mode (Korablev et al., 2018). It was designed to make the most sensitive measurements of the atmosphere to date. During each occultation up to 20 diffraction orders are simultaneously recorded at different tangent altitudes. In 2020 ACS MIR reports the discovery of the gaseous hydrogen chloride (HCl). Absorption features are present in several consecutive diffraction orders, withal both isotopes H37Cl and H35Cl are clearly observed. HCl was observed by ACS simultaneously in both hemispheres after the main phase of the global dust storm. Though the formation mechanism is not fully clear, we believe that the presence of HCl is associated with the lifted dust and chlorine component in it.
On Earth, in general, the chlorine isotope variations in nature are relatively small, ranging from ~-2 to +2 ‰. However, large variations are observed, e.g. in extraterrestrial materials and volcanic gases, due to kinetic fractionation. On Mars Farley et al. (2016) reported a range from -1 ‰ to −51 ‰ (5% reduction) for the δ37Cl in the samples drilled in the Gale Crater. ACS observations demonstrate enrichment of the 37Cl up to +250 ‰ on average in the atmospheric gaseous. In principle, most atmospheric elements on Mars have heavy isotope enrichments due to preferential loss of the light isotope to space (e.g. Vandaele et al., 2019). Early hydrodynamic escape during intense extreme ultraviolet radiation followed by prolonged atmospheric ‘erosion’ explains the heavy isotope enrichment. Chlorine loss, as HCl, would raise the δ37Cl value of the residual materials, involved in the dust-atmospheric exchange cycle.
References
Farleya K.A., Martina P., Archer P.D. , et al.: Light and variable 37Cl/35Cl ratios in rocks from Gale Crater, Mars: Possible signature of perchlorate, Earth and Planetary Science Letters 438:14-24, DOI: 10.1016/j.epsl.2015.12.013, 2016.
Korablev, O., Montmessin, F., Trokhimovskiy, et al..: The Atmospheric Chemistry Suite (ACS) of Three Spectrometers for the ExoMars 2016 Trace Gas Orbiter, Space. Sci. Rev., 214(1), 7, doi:10.1007/s11214-017-0437-6, 2018.
Vago, J., Witasse, O., Svedhem, et al.: ESA ExoMars program: The next step in exploring Mars, Sol. Syst. Res., 49(7), 518–528, doi:10.1134/S0038094615070199, 2015.
Vandaele, A. C., Korablev, O., Daerden, F. et al.: Martian dust storm impact on atmospheric H2O and D/H observed by ExoMars Trace Gas Orbiter, Nature, 568, 521–525, doi:10.1038/s41586-019-1097-3, 2019.
How to cite: Trokhimovskiy, A., Olsen, K., Korablev, O., Montmessin, F., Lefevre, F., Fedorova, A., Alday Parejo, J., Beliaev, D., Patrakeev, A., and Shakun, A.: HCl in the atmosphere of Mars: chlorine isotopic ratio, Europlanet Science Congress 2020, online, 21 Sep–9 Oct 2020, EPSC2020-673, https://doi.org/10.5194/epsc2020-673, 2020.
The ExoMars Trace Gas Orbiter (TGO) mission was sent to Mars in 2016 to make the most sensitive measurements of the atmosphere to date and to hunt for any trace gases diagnostic of active geologic or biogenic processes (Vago et al., 2015). After the first full Mars year of observations, we are able to report the first such discovery: gaseous hydrogen chloride (HCl) has been detected by the Atmospheric Chemistry Suite mid-infrared channel (ACS MIR).
ACS science operations commenced at a crucial time for Mars observations. The first solar occultation spectra were recorded on solar longitude (Ls) 163 (late April 2018) at a time of changing seasons on Mars. The northern hemisphere was entering winter, while the southern hemisphere was beginning to warm towards summer season. Around Ls 190, we witnessed a global dust storm of unprecedented severity, with dust remaining in the atmosphere through Ls 250 (Montabone et al., 2020).
HCl was observed by ACS simultaneously in both hemispheres after the main phase of the global dust storm. It remained detectable to ACS MIR for several months, while the impact of the dust was still being felt in the atmosphere, before vanishing. The dust lofted and mixed into the atmosphere caused the atmosphere to warm resulting in an expansion of the lowest layers, increasing the water vapour content, elevating the hygropause to 50-60 km, and enhancing meridional Hadley cell circulation (Fedorova et al., 2020).
Fig. 1 shows a model of the absorption spectrum contributions of the Martian atmosphere as seen by ACS MIR. The HCl branches, shown in the lower panel, partially overlap with the region of interest used to investigate methane (CH4). So far, TGO instruments have found no evidence of the absorption signature of methane, but in its place ACS MIR has made two surprising discoveries: we have identified a previously unknown CO2 absorption-rotation band (Trokhimovskiy et al., 2020); and we were able to resolve the spectral signature of ozone at low altitudes in the north polar region at the start of norther winter (Olsen et al., 2020a).
Methods
ACS MIR is a cross-dispersion spectrometer operating in solar occultation mode (Korablev et al., 2018). This geometry provides high signal-to-noise ratios, excellent sensitivity to the vertical structure of the atmosphere, and a very long optical path, amplifying trace gas absorption. The instrument consists of a primary echelle diffraction grating to disperse infrared radiation, followed by a secondary, steerable diffraction grating to separate diffraction orders. The secondary grating position changes the instantaneous spectral range. The full coverage is 2300-4500 cm-1, and the spectral resolution achieved is 0.040-0.045 cm-1 in the region of interest for HCl. The spectral range shown in Fig. 1 covers two secondary grating positions, labelled 11 and 12.

Fig. 1. Modelled gas absorption contributions as seen in the lower atmsophere by ACS MIR during solar occultation. The top panel shows contributions from major species: CO2, H2O, and HDO. The bottom panel shows contributions from HCl at 1.5 ppbv, ozone at 140 ppbv, and methane at 1 ppbv. HCl and O3 signatures at these mixing ratios have been observed, while CH4 has not.
Spectral fitting was done using the JPL Gas Fitting Software Suite (GFIT) (Irion et al., 2002; e.g., Sen et al., 1996). GFIT computes volume mixing ratio scaling factors for each spectral window and at each altitude. A retrieved profile of gas abundance is derived by inverting the matrices of optical paths and the estimated column abundances. Temperature and pressure profiles are retrieved from coincident observations made with the ACS near infrared channel (ACS NIR) (Fedorova et al., 2020; Vandaele et al., 2019). A full description of the retrieval method can be found in (Olsen et al., 2020b).
References
Fedorova, A. A., et al.: Stormy water on Mars: The distribution and saturation of atmospheric water during the dusty season, Science, 367(6475), 297–300, doi:10.1126/science.aay9522, 2020.
Irion, F. W., et al.: Atmospheric Trace Molecule Spectroscopy (ATMOS) Experiment Version 3 data retrievals, Appl. Opt., 41, 6968–6979, doi:10.1364/AO.41.006968, 2002.
Korablev, O., et al.: The Atmospheric Chemistry Suite (ACS) of Three Spectrometers for the ExoMars 2016 Trace Gas Orbiter, Space. Sci. Rev., 214(1), 7, doi:10.1007/s11214-017-0437-6, 2018.
Montabone, L., Spiga, A., Kass, D. M., Kleinböhl, A., Forget, F. and Millour, E.: Martian Year 34 Column Dust Climatology from Mars Climate Sounder Observations: Reconstructed Maps and Model Simulations, J. Geophys. Res., 2020.
Olsen, K. S., et al.: First detection of ozone in the mid-infrared at Mars: implications for methane detection, Astron. Astrophys. in press, doi:10.1051/0004-6361/202038125, 2020a.
Olsen, K. S., et al.: The vertical structure of CO in the Martian atmosphere as observed by ACS on ExoMars TGO, Nat. Geosci. submitted, 2020b.
Sen, B., Toon, G. C., Blavier, J.-F., Fleming, E. L. and Jackman, C. H.: Balloon-borne observations of midlatitude fluorine abundance, J. Geophys. Res., 101, 9045–9054, doi:10.1029/96JD00227, 1996.
Trokhimovskiy, A., Perevalov, V., Korablev, O., Fedorova, A. F., Olsen, K. . S., Bertaux, J.-L., Patrakeev, A., Shakun, A. and Montmessin, F.: First observation of the magnetic dipole CO₂ main isotopologue absorption band at 3.3 μm in the atmosphere of Mars by ACS, Astron. Astrophys. in press, doi:10.1051/0004-6361/202038134, 2020.
Vago, J., Witasse, O., Svedhem, H., Baglioni, P., Haldemann, A., Gianfiglio, G., Blancquaert, T., McCoy, D. and de Groot, R.: ESA ExoMars program: The next step in exploring Mars, Sol. Syst. Res., 49(7), 518–528, doi:10.1134/S0038094615070199, 2015.
Vandaele, A. C., et al., the NOMAD Science Team and ACS Science Team: Martian dust storm impact on atmospheric H2O and D/H observed by ExoMars Trace Gas Orbiter, Nature, 568, 521–525, doi:10.1038/s41586-019-1097-3, 2019.
How to cite: Olsen, K. S., Trokhimovskiy, A., Korablev, O., Lefèvre, F., Montmessin, F., Fedorova, A. A., Alday, J., Belyaev, D. A., Lucio, B., Patrakeev, A., Grigoriev, A., and Shakun, A.: HCl in the atmosphere of Mars: first detection of a halide gas, Europlanet Science Congress 2020, online, 21 Sep–9 Oct 2020, EPSC2020-711, https://doi.org/10.5194/epsc2020-711, 2020.
Abstract
We present simultaneous retrievals of vertical profiles of CO2 and temperature obtained from a small sample of solar occultation scans by the NOMAD-SO [1] and ACS-MIR [2] instruments on board the ExoMars Trace Gas Orbiter (TGO). The orbits or scans selected from each instrument's observations are sufficiently close in time and space so that the atmospheric variability plays a minor role and a meaningful comparison of the performance of both instrument channels is possible. This is an on-going work devoted to a proper validation of both instruments. We will present a small selection of retrievals than can be used for a critical analysis of the results obtained and as a first step into the mutual validation of NOMAD-SO and ACS-MIR.
1. Instruments and observations
Our work is focussed in the NOMAD-SO and the ACS-MIR channels, those specifically devoted to operational observations in solar occultation. Several groups in the NOMAD and ACS teams are performing retrievals of species abundances from these signals and some are reported in this conference [3,4]. We focus on the retrieval of CO2 and temperature in the 2.7 µm range, the strongest IR bands by this gas in the spectra region coverd by SO and ACS [5]. The spectra correspond to calibrated transmittances derived from SO difraction orders 164 and 165 and from MIR position 4 spectra. About a dozen strong CO2 lines are observed in these spectra up to very high tangent altitudes, around 170-180 km. The present study targets at both solar occultation signals, NOMAD-SO and ACS-MIR, but unfortunately, due to some unexpected miss-alignments among the different channels in each instrument and between NOMAD and ACS, an entirely simultaneous observation of the solar disc as it emerges or hides behind the atmosphere is not possible with both SO and MIR channels. Instead this work study the inversions from the two channels in nearly coincident solar occultations, with small changes in latitude, longitude, solar longitude and time.
2. Retrieval Scheme
We have performed the present retrievals using an inversion code previously used in the Earth upper atmosphere for routine operations of the MIPAS instrument on board the Envisat mission [6]. The inversion scheme, which has been recently adapted to Mars for limb sounding in emission from the OMEGA spectrometer on board the Mars Express spacecraft [7], is adapted here for occultation observations. At the core of the inversion scheme is the forward model KOPRA (Karlsruhe Optimized and Precise Radiative transfer Algorithm [8] ) and the inversion processor (RCP), jointly developed by the Institute for Meteorology and Climate Research (IMK) and the IAA [9].
As mentioned above we used here CO2 calibrated transmittances obtained from routine processing by the PI teams. But before injection into the inversion algorithm, a pre-processing of every orbit or scan is performed in order to correct every spectrum of spurious effects. These are essentially two: residual spectral shifts and artificial bending in single spectra. The magnitude of these two effects changes from order to order and between SO and ACS. In spite of these differences, the pre-processing is conceptually similar to both signals, and is actually performed with the same Python code. Further, the ILS associated to each of the signals is best reproduced by a double gaussian, whose detailed description (parameters describing their FWHM and peak ratios, for example) requires also a precise determination by the user, as apparently it slightly varies with time and observing conditions.
It is specially useful to obtain both density and temperature information from a single scan, and this is the purpose of the present study. The simultaneous retrieval from a given scan actually derives a CO2 density profile, and after an iterative process, a temperature profile assuming hydrostatic equilibrium. An adjustment for the pointing is also intruduced, and the aerosol extinction and possible interference from species like H2O are also considered during the inversion to obtain the best fits.
3. Results
We will discuss the fist comparisons of CO2 and temperatures from NOMAD-SO and ACS-MIR, using a common pre-processing and inversion code. The retrievals perform in a similar manner, as in both cases the number of lines, the ro-vibrational bands and the spectral region are similar. Small differences in noise and spectral resolution have some impact but overall both channels permit sounding the Mars atmosphere up to the upper thermosphere with just one single scan. Averaging kernels indicate effective vertical resolutions around 4-6 km in the middle atmosphere (50-100 km), both in CO2 and temperature. The inversion is affected by heavy dust loading and in general degrades below about 30 km and above 150 km due to saturation and noise, respectively.
Acknowledgements
The IAA/CSIC team acknowledges financial support from the State Agency for Research of the Spanish MCIU through the ‘Center of Excellence Severo Ochoa’ award for the Instituto de Astrofísica de Andalucía (SEV-2017-0709). MALV was funded by grant PGC2018-101836-B-100 (MCIU/AEI/FEDER, EU). ExoMars is a space mission of the European Space Agency (ESA) and Roscosmos. The NOMAD experiment is led by the Royal Belgian Institute for Space Aeronomy (IASB-BIRA), assisted by Co-PI teams from Spain (IAA-CSIC), Italy (INAF-IAPS), and the United Kingdom (Open University). US investigators were supported by the National Aeronautics and Space Administration.
References
[1] Vandaele et al., Space Science Reviews 214 (5), 2018 [2] Korablev et al., Space. Sci. Rev. 214, 7 (2018). [3] Loic et al., Update on CO2 and temperature profiles retrievals from NOMAD-SO on board ExoMars TGO, contribution to this conference, 2020. [4] Shohei et al., Water vapor vertical profiles on Mars: Results from the first full Mars Year of TGO/NOMAD science operations, contribution to this conference, 2020. [5] Lopez-Valverde et al., Space Sci Rev (2018) 214:29 [6] Funke, B., et al. , Atmos. Chem. Phys., 9(7), 2387–2411, 2009.Funke et al., ACP, 9, 2387–2411, 2009. [7] Jimenez-Monferrer, Icarus in press, 2020 [8] Stiller et al., JQSRT, 72, 249–280, 2002 [9] von Clarmann et al., J. Geophys. Res. 108, 4746, 2003
How to cite: Lopez-Valverde, M. A., Funke, B., Hill, B., Gonzalez-Galindo, F., Aoki, S., Trompet, L., Thomas, I., Villanueva, G., Erwin, J., Olsen, K., Belyaev, D., Trokhimovskiy, A., Alday Parejo, J., Lopez-Puertas, M., Lopez-Moreno, J. J., Montmessin, F., Patel, M., Bellucci, G., Vandele, A. C., and Korablev, O.: CO2 and temperature retrievals in the Mars atmosphere from solar occultation by NOMAD-SO and ACS-MIR: performance and cross validation., Europlanet Science Congress 2020, online, 21 Sep–9 Oct 2020, EPSC2020-924, https://doi.org/10.5194/epsc2020-924, 2020.
Introduction
The southern spring and summer on Mars in the 34th Martian Year (MY34, Ls 180o-360o) was decorated by two dust storms: the global one (GDS) at Ls 190o-240o, and the regional one at Ls 320o-330o. Just before the onset of the GDS, the nominal ExoMars Trace Gas Orbiter mission began (April 2018) with an onboard solar occultation experiment by the spectrometric Atmospheric Chemistry Suite (ACS) [1]. The first ACS-NIR retrievals of the temperature and water mixing ratio revealed an increase the H2O abundance up to altitudes of 80-100 km not only in the stormy events but also at the perihelion in the southern hemisphere (around Ls~270o) [2]. Moreover, as it was shown, the water supersaturation occurs even in presence of the ice clouds, while the stormy warm atmosphere rises the hygropause level [2, 3]. This phenomenon increases a capability of water escape from Mars. Simultaneous investigation from the NOMAD/TGO solar occultations demonstrated analogue results for the H2O enhancement up to 80 km in the stormy seasons, but without the saturation estimations [4].
In this paper, we present results from more sensitive solar occultation measurements in the 2.65-2.7 μm spectral range by the middle infrared channel of ACS (ACS-MIR). The channel allows mesospheric and thermospheric retrievals of temperature and CO2 density in parallel with the mesospheric water abundance. Our results confirm the ACS-NIR and NOMAD conclusions concerning the H2O vapour behaviour in the second half of the MY34. We report the most humid mesosphere occurred in the perihelion season where the water enrichment was established about 5-10 ppbv at altitudes of 110-120 km. We also present the temperature and CO2 density seasonal distribution covering the troposphere, the mesosphere and the thermosphere of Mars.
Measurements
The ACS-MIR channel is a cross-dispersion echelle spectrometer dedicated to solar occultation measurements in the 2.3–4.3 μm wavelength range [1]. The instrumental resolving power λ/Δλ reaches ~30 000, while the altitude resolution is 1-2 km and the signal/noise ratio is about ~1000. Each occultation session covers a spectral interval with one or a few CO2 absorption bands appropriate for the atmospheric density and temperature retrievals. In this work, we perform data analysis in the 2.65-2.7 μm spectral range, which occupies echelle diffraction orders from 221 to 224, observed simultaneously. This spectral region hosts strong CO2 and H2O absorption bands that are sensitive to detections of CO2 density up to 180-190 km and H2O density up to 120-130 km. For the MY34 the MIR dataset in the considered spectral range is made of ~100 occultation profiles in the Northern hemisphere and of ~90 in the Southern one encompassing seasonal period from Ls 165o to 355o.
Retrieval concept
The temperature and densities retrieval scheme consists of several iterations with a fitting of a forwardly modelled transmission spectrum to a measured one at each observed altitude. The model includes line-by-line calculations CO2 and H2O absorption cross sections depending on specified temperature and pressure. The fitting procedure is based on Jacobian matrix containing transmission derivatives on free parameters: temperature, CO2 density and H2O density. The clue contribution to an optimal estimation comes from the molecular cross sections derivatives on temperature; they differ significantly from line to line in the considered spectral range. Thanks to that, an independent and simultaneous retrieval of temperature and density is possible. Once the altitude profiles of these parameters are estimated at the first iteration, we calculate the atmospheric pressure profile assuming the hydrostatic equilibrium. This assumption was successfully tested by other vertical profile retrievals from the ACS data [1, 5].
The uncertainty of the retrievals is determined by the transmission errors and the Jacobian matrix for each of free parameters. This estimation allows establishing maximal altitudes with a positive detection of CO2 and H2O densities.
Results
ACS-MIR solar occultations in the 2.65-2.7 μm spectral range provide us with unprecedented capability to profile CO2 density and temperature from 20 to 180 km, covering the troposphere, the mesosphere and the thermosphere of Mars. The homopause varies around ~130 km and CO2 mixing ratio decreases from 96% to 20-40% at 180 km due to photolysis and molecular diffusion. In parallel with the same dataset, we report very high altitude water abundance, at 110-120 km, that occurred in the southern spring and summer including the GDS and the perihelion in the 34th Martian Year. However, our measurements in the northern hemisphere revealed such a high H2O enrichment only at the stormy events. Comparison of our climatology with some improvements in the Global Circulation Model for the MY34 is in progress.
Acknowledgements
The retrievals of density/temperature profiles in IKI are funded by the RSF grant #20-42-09035.
References
[1] Korablev O. et al., 2018. The Atmospheric Chemistry Suite (ACS) of three spectrometers for the ExoMars 2016 Trace Gas Orbiter. Space Sci. Rev., 214:7. DOI 10.1007/s11214-017-0437-6.
[2] Fedorova A. et al., 2020. Stormy water on Mars: The distribution and saturation of atmospheric water during the dusty season. Science, eaay9522. DOI: 10.1126/science.aay9522.
[3] Fedorova A. et al., 2018. Water vapor in the middle atmosphere of Mars during the 2007 global dust storm. Icarus 300: 440-457.
[4] Aoki S. et al., 2019. Water vapor vertical profiles on Mars in dust storms observed by TGO/NOMAD. JGR Planets, 124, 3482-3497. https://doi.org/10.1029/2019JE006109.
[5] Alday J. et al., 2019. Oxygen isotopic ratios in Martian water vapour observed by ACS MIR on board the ExoMars Trace Gas Orbiter. A&A, 630, A91. DOI: 10.1051/0004-6361/201936234.
How to cite: Belyaev, D., Fedorova, A., Alday, J., Lefevre, F., Korablev, O., Montmessin, F., Trokhimovskiy, A., Patrakeev, A., and Lopez-Valverde, M.: Mesospheric/Thermospheric temperatures and high altitude water on Mars in the MY34, Europlanet Science Congress 2020, online, 21 Sep–9 Oct 2020, EPSC2020-980, https://doi.org/10.5194/epsc2020-980, 2020.
Abstract
Ares is a novel retrieval framework system, designed for the European Space Agency's (ESA) Trace Gas Orbiter (TGO) Nadir and Occultation for MArs Discovery (NOMAD) instrument, Solar Occultation (SO) channel. Ares provides unique insights into the chemical composition of the Martian atmosphere by applying methods utilised in exoplanetary atmospheric retrievals[1][2]. This insight may help unravel the nature of CH4 on Mars. The Ares model is here described including; the NOMAD SO channel instrument function model, Martian atmospheric molecular absorption cross-sections, geometry models and a NOMAD noise model. Ares atmospheric priors and forward models are presented, (i.e. simulated NOMAD observations), and are analysed, compared and validated against NASA’s Planetary Spectrum Generator (PSG)[3].
Introduction
In 2003, methane, CH4, was tentatively detected in the Martian atmosphere, at 10±5ppbv, varying by 0-30ppbv globally[4], and 10±3ppbv[5]. CH4 has, at most, a predicted photochemical lifetime of 300 years[6][7], the short lifetime of CH4 in the Martian atmosphere implies that CH4 should be uniformly distributed over Mars. However, non-uniform distributions have been observed[8]. This raises questions with regard to the source(s) and/or sink(s) of CH4. Abiotic and biotic sources have been suggested to explain the detection, ranging from Fischer-Tropsch-type (FTT) reactions[9] to methanogenesis by methanogenic archaea[10].
The NOMAD instrument[11][12], on-board the ESA’s Exomars TGO was designed to investigate the nature of methane, on Mars[13][8]. However, the arrival of the TGO and subsequent science mission has detected no CH4, with an upper limit of 0.05ppbv above 5km[14]. In contrast, NASA’s Curiosity Sample Analysis at Mars Tunable Laser Spectrometer instrument (SAM-TLS)[15] has made multiple measurements of CH4, including measuring an elevated CH4 background of 7.2±2.1ppbv CH4 over a 60-sol period in 2013[16]. Subsequently, using SAM-TLS, a mean CH4 abundance of 0.41±0.16ppbv was determined, as well as a repeatable seasonal variation from 0.24-0.65ppbv[17]. Moreover, on the 20th June 2019 a 19.5±0.18ppbv CH4 emission in Gale Crater was reported by SAM-TLS [18]. Furthermore, the Planetary Fourier Spectrometer (PFS)[19] on-board Mars Express detected 15.5±2.5ppbv of CH4, above Gale Crater on 16th June 2013, one day after SAM-TLS independently detected a CH4 spike of 5.78±2.27ppbv[20]. Since then PFS has detected no CH4[21].
The discrepancy between surface measurements by SAM-TLS and orbital measurements from NOMAD and PFS, combined with the independent confirmation of detection of CH4 by PFS, significantly constrains the mechanisms to corroborate the measurements. Here we present a novel retrieval framework model, Ares, designed for TGO NOMAD SO channel solar occultation measurements. Ares provides a unique insight into the Martian atmosphere by applying methods utilised in exoplanetary atmospheric retrievals. This insight could help unravel the nature of CH4 on Mars.
Methods
Ares is the Mars version of TauREx3[2], the 3rd generation of TauREx[1] (Tau Retrieval for Exoplanets). TauREx3 is a fully Bayesian atmospheric retrieval framework that uses Nested Sampling[22][23], and Markov chain Monte Carlo methods to sample the full likelihood space of possible solutions. This allows TauREx3 to produce marginalised and conditional posterior distributions of forward model parameters, which can be used to map correlations between these parameters. This is advantageous over other planetary atmospheric retrieval frameworks that only find the maximum-a-posteriori (MAP) solution through Optimal Estimation[24].
A NOMAD SO channel blaze function, acousto-optic tunable filter (AOTF) module has been incorporated into the Ares forward model. Furthermore, Martian ellipsoidal and spherical geometry modules have been included in order to calculate the atmospheric layer line-of-sight (LOS) intersection points and corresponding path lengths[25]. A Mars Climate Database (MCD) Python library, pymcd, has been written and linked to Ares, providing access to Martian vertical temperature, pressure and volume-mixing-ratio (VMR) profiles[26][27]. Moreover, Martian absorption cross-sections have been generated using HITRAN2016[28], accounting for expected Martian pressures, temperatures and CO2 broadening, due to the CO2-rich Martian atmosphere. Overall this enables Ares to produce simulated NOMAD SO channel transmission spectra.
Results
In order to validate Ares, the Ares forward model has been compared against output from NASA’s PSG[3]. The PSG is an online radiative transfer suite capable of synthesising Martian NOMAD SO channel spectra. Like Ares, the PSG extracts atmospheric priors from the MCD[26][27]. Ares Martian transmittance spectra, simulated using NOMAD observation metadata, compared against the PSG are shown to be in strong agreement, through running Ares and PSG forward models with mutual input variables, for wavenumber range 3011-3035cm-1, i.e. NOMAD SO channel diffraction order 134.
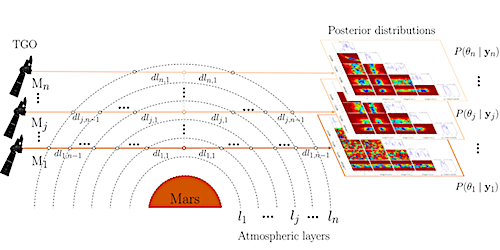
Figure 1: A schematic diagram of the TGO, Martian atmospheric layers and corresponding Ares posterior distributions, mapping correlations between atmospheric parameters, for diffraction order 134, at three tangent heights, in the lower, middle and upper atmosphere.
Conclusions
This research has described a novel retrieval framework, Ares, the Mars version of TauREx3[2], designed for TGO NOMAD SO channel solar occultation measurements. The Ares forward model can simulate NOMAD spectra, including instrumental effects due to the blaze function, AOTF, as well as AOTF temperature dependence. In this research Ares has been applied to simulate and perform self-retrieval of typical Martian mixing ratio concentration vertical profiles of CH4, H2O, and CO2. Simulated Ares and PSG NOMAD SO channel solar occultation observations have been compared and are in strong agreement, with marginalised and conditional posterior distributions subsequently generated. Showing that Ares offers a new method of research in Martian and solar system atmospheric science.
Acknowledgements
We would like to thank the UK Space Agency for their support of this Aurora Science studentship STFC:535385. We would also like to thank BIRA-IASB for providing test NOMAD spectra, in particular Ian Thomas for help in understanding the intricacies of NOMAD. Finally, we would like to thank the LMD and Ehouarn Millour for help in providing the MCDv5.3.
References
1.Waldmann et al.(2015),ApJ.[https://doi.org/10.1088/0004-637X/802/2/107].
2.Al-Refaie et al.(2019),Submitted to ApJ.[https://arxiv.org/pdf/1912.07759.pdf].
3.Villanueva et al.(2018),JQSRT.[https://doi.org/10.1016/j.jqsrt.2018.05.023].
4.Formisano et al.(2004),Science.[https://doi.org/10.1126/science.1101732].
5.Krasnopolsky et al.(2004),Icarus.[https://doi.org/10.1016/j.icarus.2004.07.004].
6.Summers et al.(2002),GRL.[https://doi.org/10.1029/2002GL015377].
7.Lefèvre and Forget(2009),Nature.[https://doi.org/10.1038/nature08228].
8.Mumma et al.(2009),Science.[https://doi.org/10.1126/science.1165243].
9.Morozova et al.(2007),Orig.Life.Evol.Biosph.[https://doi.org/10.1007/s11084-006-9024-7].
10.Allen et al.(2006),Eos.[https://doi.org/10.1029/2006EO410001].
11.Vandaele et al.(2015),Planet.SpaceSci.[https://doi.org/10.1016/j.pss.2015.10.003].
12.Robert et al.(2016),Planet.SpaceSci.[https://doi.org/10.1016/j.pss.2016.03.003].
13.Liuzzi et al.(2019),Icarus.[https://10.1016/j.icarus.2018.09.021].
14.Korablev et al.(2019),Nature.[https://doi.org/10.1038/s41586-019-1096-4].
15.Mahaffy et al.(2012),SpaceSci.Rev.[https://doi.org/10.1007/s11214-012-9879-z].
16.Webster et al.(2015),Science.[https://doi.org/10.1126/science.1261713].
17.Webster et al.(2018),Science.[https://doi.org/10.1126/science.aaq0131].
18.Moores et al.(2019),GRL.[https://doi.org/10.1029/2019GL083800].
19.Formisano et al.(1997),Adv.SpaceRes.[https://doi.org/10.1016/S0273-1177(97)00282-2].
20.Giuranna et al.(2019),Nature-Geoscience.[https://doi.org/10.1038/s41561-019-0331-9].
21.ESA(2019),[http://www.esa.int/Science_Exploration/Human_and_Robotic_Exploration/Exploration/ExoMars/ESA_s_Mars_orbiters_did_not_see_latest_Curiosity_methane_burst].
22.Skilling(2006),Bayesian-Anal.[https://projecteuclid.org/euclid.ba/1340370944].
23.Feroz et al.(2009),MNRAS,[http://dx.doi.org/10.1111/j.1365-2966.2009.14548.x].
24.Rodgers(2000),IMFAS,World-Scientific.
25.Thomas et al.(2018),[http://mars.aeronomie.be/en/exomars/observations/pages/EXM-NO-ICD-AER-00001-iss1rev11-EAICD_NOMAD_181026.pdf].
26.Forget et al.(1999),JGR.[https://doi.org/10.1029/1999JE001025].
27.Millour et al. (2018),[https://www.cosmos.esa.int/documents/1499429/1583871/Millour_E.pdf].
28.Gordon et al.(2016),JQSRT.[https://doi.org/10.1016/j.jqsrt.2017.06.038].
How to cite: Cann, G., Al-Rafaie, A., Waldmann, I., Walton, D., and Muller, J.-P.: Ares: A retrieval framework Mars model for ExoMars Trace Gas Orbiter NOMAD solar occultation measurements, Europlanet Science Congress 2020, online, 21 Sep–9 Oct 2020, EPSC2020-433, https://doi.org/10.5194/epsc2020-433, 2020.
Introduction
The Raman Laser Spectrometer (RLS) [1] is part of the analytical instrumental suite (Pasteur Payload) located inside the Analytical Laboratory Drawer (ALD) of the Rosalind Franklin rover for the ExoMars 2022 mission to Mars. RLS is based on the inelastic scattering of the matter when illuminated by a monochromatic light. This emitting radiation contains physicochemical information of the observed material through the vibrations of its atomic components. It this way RLS will contribute to the ExoMars scientific mission objectives identifying minerals and organic compounds at the mineral grain scale. And with this information supporting the key astrobiological questions the mission will address analyzing samples on the Martian surface and subsurface.
The instrument consists in four main units which are depicted in Figure 1 and its development and delivered models are described in references [1–5].
In this work interest is mainly devoted to the analysis of the scientific performances of the flight model (FM) currently integrated in the Rosalind Franklin rover, comparing it with the performances of the flight spare (FS) located at INTA in Madrid. This comparison is part of the general plan to characterize both instruments to better understand the FM behavior in support to the future operation in Mars. This plan also includes the correlation of the FS scientific outcome and the RLS ExoMars Simulator, a laboratory setup located in Valladolid University [6] emulating the RLS acquisition algorithms [7], as well as the sample preparation and distribution system (SPDS) positioning of the samples.
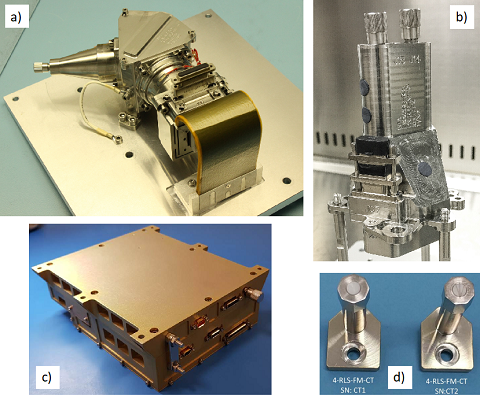
Figure 1. RLS instrument units. a) The SPU is the Spectrometer Unit, with a theoretical spectral resolution of 6-8 cm-1 [5]. b) The internal Optical Head (iOH) features an autofocus system, with 50 microns collection and excitation fibers [2,8]. c) The ICEU is the control electronics unit, also integrating the redundant 532 nm excitation laser [9]. d) The Calibration Targets will allow the calibration of the instrument, as well as the spatial correlation of the field-of-views of the different instruments of the Rosalind Franklin Analytical Laboratory Drawer [3].
Experimental
The instrument performances were evaluated after an appropriate calibration procedure that included observation of Ne and Ar-Hg emission lines to obtain the correlation function between pixels and correct wavelengths and the Raman observation of standard samples and the PET calibration target to obtain the right wavenumber positions.
After that a campaign with selected samples of very different Raman molar efficiency was undertaken. In the FM case this campaign comprised the pre-delivery experiments with a limited set of samples, given the extremely tight delivery schedule for the flight instrument to ESA. Once after integration, only the Calibration Target material (PET) can be used for health or any other checks, as no samples will be introduced into the sealed ultra-clean zone of the analytical laboratory drawer (ALD) of the rover until arrival to Mars.
However, the development of the RLS FS (identical in every sense to the FM), has provided a unique opportunity to perform thorough scientific analysis that will be used to properly characterize and parameterize the flight instrument. These experiments will be correlated with heavy duty analysis performed by the RLS ExoMars Simulator, which is designed to work in a laboratory environment, thus allowing the analysis of samples without the operational constraints of the RLS FS.
Several samples relevant to Mars have been analyzed at the present. These samples are collected from the ADAMM database, a collection of materials representative of different Martian locations and specifically the landing sites of ExoMars 2022 (Oxia Planum) and Mars 2020 (Jezero Crater) missions, which is presented in this conference. In addition, synthetic mixtures of materials used to perform calibration curves for the quantification of mineral abundances from RLS data (publication in press), or other representative materials to optimize the acquisition parameters of the instrument are analyzed (a dedicated presentation is presented in this conference).
Results and discussion
In this conference we will present and discuss the evolution of Raman spectra of the CT acquired with the RLS FM instrument, to verify the evolution of the instrument throughout all the steps from the pre-delivery stage, including the spectra obtained in relevant environments during the Assembly, Integration and Test (AIT) phases of the ALD and rover integration process. And also, the results regarding the correlation of the FS instrument and the RLS ExoMars Simulator data to the RLS FM instrument. These results will be key for defining the instrument capabilities and expected scientific performance of the instrument once on Mars.
Acknowledgements
MINECO grants ESP2014-56138-C3-1-R, ESP2014-56138-C3-2-R, ESP2107-87690-C3-1-R, ESP2107-87690-C3-3-R.
References
[1] F. Rull et al., et al. Astrobiology. 17 (2017) 627–654. https://doi.org/10.1089/ast.2016.1567.
[2] A. Santiago et al. Proc. SPIE - Int. Soc. Opt. Eng., 2018. https://doi.org/10.1117/12.2313462.
[3] G. Lopez‐Reyes et al. J. Raman Spectrosc. (2020) jrs.5832. https://doi.org/10.1002/jrs.5832.
[4] A.G. Moral et al. J. Raman Spectrosc. (2019) jrs.5711. https://doi.org/10.1002/jrs.5711.
[5] J.F. Cabrero et al. In: Proc. SPIE 11180 (2019) 115. https://doi.org/10.1117/12.2536035.
[6] G. Lopez-Reyes et al. Eur. J. Mineral. 25 (2013) 721–733. https://doi.org/10.1127/0935-1221/2013/0025-2317.
[7] G. Lopez-Reyes, F. Rull Pérez, J. Raman Spectrosc. 48 (2017) 1654–1664. https://doi.org/10.1002/jrs.5185.
[8] G. Ramos et al. In: Proc. SPIE - Int. Soc. Opt. Eng., (2017). https://doi.org/10.1117/12.2277003.
[9] P. Ribes-Pleguezuelo et al. Proc SPIE - Opt. Eng. 55(11), 116107 (2016), https://doi: 10.1117/1.OE.55.11.116107
How to cite: Rull, F., Moral, A., Lopez-Reyes, G., Perez, C., Rodriguez, J. A., Rodriguez, P., Veneranda, M., Manrique, J. A., saiz, J., Sanz, A., and Medina, J.: The Raman Spectrometer for the ExoMars-ESA 2022 Mission to Mars, Europlanet Science Congress 2020, online, 21 Sep–9 Oct 2020, EPSC2020-1037, https://doi.org/10.5194/epsc2020-1037, 2020.
Introduction
The flight Raman instrument for the ExoMars 2022 mission, the Raman Laser Spectrometer (RLS) [1], was delivered and integrated in the Rosalind Franklin rover. In parallel, the RLS flight spare (FS) model is being used at INTA facilities to thoroughly characterize and understand the instrument performance, as well as to optimize the scientific return of the flight instrument through a proper parameterization. In addition, the RLS ExoMars simulator developed by the University of Valladolid (UVA), is used for thorough analysis of samples, emulating the operation mode of the RLS instrument (including the automated adaptation to the sample spot), as well as the sample preparation and distribution system (SPDS) of the rover, in those aspects related to sample management.
In this work we present experiments and analysis performed with the different ground models, aimed at the optimization and characterization of the RLS performance, by addressing the following three issues: 1- optimizing the acquisition by studying the SNR of spectra with different configurations of the spectra acquisition algorithms implemented onboard the RLS instrument [2] (especially the number of accumulations), while also considering the influence of the instrument stability (laser power, CCD temperature, etc.). 2- optimizing the spectral quality of the acquired data by evaluating several on-ground spectral data-processing strategies. 3- evaluate and analyze the performance of the different models (FM, FS and Simulator) to understand the expected inter-correlation of the results obtained with them.
Experiments and previous work
Several samples with different emission efficiencies (diamond, calcite, serpentine, hematite and vermiculite), have been analyzed with the RLS FS and the RLS ExoMars Simulator, acquiring a relatively high number of acquisitions. The data has been processed to establish the spectral quality (measured as the SNR) as a function of the number of accumulations.
The RLS ExoMars simulator, on the other hand, has also been reworked to integrate the RAD1 spectrometer (RAman Demonstrator 1, a laboratory model with characteristics and design similar to RLS). This will bring the RLS ExoMars Simulator closer to the expected performance of the instrument that will fly to Mars.
Optimal na
The RLS instrument features an automated integration time (ti) calculation algorithm, which allows optimizing this time for every spot in the sample. However, due to several reasons, the number of accumulations (na) has to be established from ground as a system parameter, so it will be the same for all the samples and spots obtained during one operational cycle (sol). It has been reported [2] that, for constant total acquisition times (ti*na) in instruments such as RLS, the signal to noise ratio (SNR) of a spectrum increases more by maximizing ti, than by maximizing na. This is in agreement with the implementation performed on the onboard software of RLS. Thus, the present study is centered in the characterization of the optimal number of accumulations (which is configurable from ground) for the RLS operation.
The results in this work have been used to infer the SNR evolution of the spectra as a function of the number of accumulations, which is critical to establish the on-ground parameter for na for an optimal acquisition. The results are obtained by comparing several SNR calculation methods, and have helped determining a good compromise in the selection of the na at a value of 30.
This analysis has shown noise levels behaving very close to the theoretical behavior, with the noise intensity following the expected inverse exponential decay with na. However, it has also provided insight as to how the spectra peak intensity is highly affected by the laser power or CCD temperature stability. In this sense it has been concluded that it will be necessary to perform some tests at arrival on Mars, in temperature conditions representative of the environment during Martian operations.
Data processing for optimal spectral quality
The analysis of the acquired data has also shown how the spectral quality of the spectra can be influenced by the data processing: CCD binning method, dark subtraction, baseline correction approach… but also how different intensity correction methods can help improve the quality of the spectra. For example, the correction with BZn [3] has been used to perform correction of the spectra (using different correction methods), showing how the data analysis strategy incorporated into the science processing pipelines of RLS during operation will need to include this correction. Other data processing strategies to be considered are the use of optimized binning methods (adjusted for each spectrum), or the dark correction of spectra, which also improves the spectral quality.
Correlation between instrument models
To have ground models which can be correlated with the instrument on Mars is critical for analysis during operations, but also to prepare and validate the science that will be obtained from the instrument once on Mars. The RLS FS instrument is identical to the flight instrument in every sense, which makes it very representative of the RLS FM, except in the operational conditions, as it is not possible to simulate the Martian conditions in a daily operational basis (and, for example, the CCD working temperature is kept at values higher than what will be expected on Mars).
On the other hand, the correlation of ground emulators such as the RLS ExoMars Simulator is of paramount importance to obtain results that are realistically correlated with the actual RLS instrument. The integration of the RAD1 spectrometer in the RLS ExoMars Simulator is a great step forward to achieve representative results that can ultimately be used to take decisions as to how to parameterize the flight instrument for Martian operation.
Acknowledgements
MINECO grants ESP2014-56138-C3-1-R, ESP2014-56138-C3-2-R, ESP2107-87690-C3-1-R, ESP2107-87690-C3-3-R.
References
[1] Rull, F. et al. Astrobiology 17, 627–654 (2017).
[2] Lopez-Reyes, G. et al. J. Raman Spectrosc. 48, (2017).
[3] A. Sanz-Arranz et al. J. Raman Spectrosc. 48, (2017).
How to cite: Lopez-Reyes, G., Moral, A., Perez, C., Rodriguez, J. A., González Martín, A., Veneranda, M., Manrique-Martinez, J. A., Seoane, L., Ibarmia, S., Peña-Nogales, O., Rodriguez, P., Saiz, J., Zafra, J., Sanz-Arranz, A., Medina, J., and Rull, F.: RLS spectra acquisition optimization with the RLS FS and RLS ExoMars Simulator, Europlanet Science Congress 2020, online, 21 Sep–9 Oct 2020, EPSC2020-1043, https://doi.org/10.5194/epsc2020-1043, 2020.
The ExoMars Rover and Surface Platform planned for launch in 2022 is a large international cooperation between the European Space Agency and Roscosmos with a scientific contribution from NASA. Thales Alenia Space is the ExoMars mission industrial prime contractor.
Besides sensors and instruments characterizing the surface at large scale, the ExoMars’ rover Rosalind Franklin payload features some experiments devoted specifically to the characterization of the first few meters of the Martian subsurface. These experiments are particularly critical for the main ExoMars objective of detecting traces of present or past life forms on Mars, which may have been preserved within the shallow Martian underground [1].
Rosalind Franklin will be able to perform both non-invasive geophysical imaging of the underground [2] and subsurface in situ measurements thanks to the Drill unit installed on the rover. The Drill has been developed by Leonardo and its purposes are 1) to collect core samples to be analyzed in the Analytical Laboratory Drawer (ALD) onboard the Rover and 2) to drive the miniaturized spectrometer Ma_MISS within the borehole.
Ma_MISS (Mars Multispectral Imager for Subsurface Studies, [3]) will collect mineralogic measurements from the rocks exposed into the borehole created by the Drill with a spatial resolution of 120 μm down to 2 meters into the Martian subsurface.
Rocks are composed of grains of minerals, and their reaction to an applied stress is related to the mechanical behavior of the minerals that compose the rock itself. The mechanical properties of a mineral depend mainly on the strength of the chemical bonds, the orientation of crystals, and the number of impurities in the crystal lattice.
In this context, the integration of Ma_MISS measurements and drill telemetry are of great importance. The mechanical properties of rocks coupled with their mineralogic composition provide a rich source of information to characterize the nature of rocks being explored by ExoMars rover’s drilling activity.
Within our study, we are starting to collect telemetry recorded during the Drill unit tests on several samples ranging from sedimentary to volcanic rocks with varying degrees of weathering and water content. In this first phase of the study, we focused our attention on the variation of torque and penetration speed between different samples, which have been found to be indicative of a particular type of rock or group of rocks and their water content.
We are planning to analyze the same rocks with the Ma_MISS breadboard creating the link between the mineralogy and the mechanical response of the Drill.
This will put the base for a more comprehensive and rich characterization of the in situ subsurface observation by Rosalind Franklin planned at Oxia Planum, Mars in 2023.
Acknowledgments: We thank the European Space Agency (ESA) for developing the ExoMars Project, ROSCOSMOS and Thales Alenia Space for rover development, and Italian Space Agency (ASI) for funding the Ma_MISS experiment (ASI-INAF contract n.2017-48-H.0 for ExoMars MA_MISS phase E/science).
References
[1] Vago et al., 2017. Astrobiology, 17 6-7. [2] Ciarletti et al., 2017. Astrobiology, 17 6-7. [3] De Sanctis et al., 2017. Astrobiology, 17 6-7.
How to cite: Frigeri, A., De Sanctis, M. C., Altieri, F., De Angelis, S., Ferrari, M., Fonte, S., Formisano, M., Ammannito, E., Mugnuolo, R., Durrant, S., Haessig, F., Gily, A., Antonacci, F., Fumagalli, A., Novi, S., Pilati, A., Rusconi, A., Sangiovanni, G., Villa, F., and Vago, J. L.: Combining ExoMars’ Ma_MISS and Drill data, Europlanet Science Congress 2020, online, 21 Sep–9 Oct 2020, EPSC2020-882, https://doi.org/10.5194/epsc2020-882, 2020.
On Mars, dust and clouds are primary elements for studying the interactions of solar radiation with the atmosphere and surface and their influence on the radiation balance. Depending on the dust opacity and other properties such as the particle size distribution, airborne dust can provide positive or negative radiative feedbacks into dynamical processes. This role played by dust in the circulation of the atmosphere points out the need of retrieving the dust optical properties at different time periods and locations. In order to perform these observations a number of ground-based radiance dust sensors were selected for Exomars and Mars 2020 missions (e.g. Arruego et al., Advances in Space Research, 60, 2016; Apéstigue et al., EPSC 2015). These instruments measure the solar flux at different wavelengths and sky locations along the day. From radiative transfer simulations of these observations, dust properties such as the number density or particles radius can be inferred. In this work, we will present and discuss different retrieval procedures developed for the characterization of dust and clouds on Mars.
How to cite: Toledo, D., Apéstigue, V., Gómez, L., Martinez-Oter, J., Jiménez, J. J., Yela, M., and Arruego, I.: Retrieval of martian dust and cloud properties from ground-based radiance dust sensors , Europlanet Science Congress 2020, online, 21 Sep–9 Oct 2020, EPSC2020-713, https://doi.org/10.5194/epsc2020-713, 2020.
The ExoMars 2022 Rosalind Franklin Rover will search for signs of past and present life on Mars, and study the water/geochemical environment in the shallow subsurface. The mission will launch in autumn 2022, together with the Kazachok surface platform, and includes an analytical and imaging comprehensive instrument suite and a sampling drill that can penetrate to ~ 2 m beneath the surface.1 The mission will land in Oxia Planum, an area of Mars containing sedimentary rocks with high clay-mineral content2.
To prepare for ExoMars surface operations, an ExoMars-Like Field Trial (ExoFiT) using an instrumented ExoMars-like Rover has been performed, building on past field trial experience3,4. The aim of the trial was to understand how the ExoMars Rover and its instrument payload would be used to meet the ExoMars Rover science goals, when operated by a realistic science team. Also, to provide ‘lessons-learned’ to improve and inform operations planning for the real mission.
The first part of the trial occurred in the Tabernas desert, Spain, in 2018. The Tabernas site contains a sequence of sedimentary rocks and hosts a variety of geomorphological and mineralogical features typical of clay-rich desert surfaces. The second part of the trial was performed in the Atacama desert, Chile, in 2019. The Atacama site has a very Mars-like environment, consisting of a dry desert pavement made of gravel and boulders, interspersed with finer-grained, coarse sand patches.
The ExoFiT Rover and lander platform were supplied and operated by AIRBUS and have similar capabilities and dimensions to the ExoMars Rover hardware. The ExoFiT Rover included emulators for the ExoMars’ PanCam5 (colour stereo panoramic camera), CLUPI6 (close-up camera), WISDOM7 (ground-penetrating RADAR), ISEM8 (infrared reflectance spectrometer), RLS9 (Raman spectrometer), and de-mounted emulator of the ExoMars Rover drill instrument.
In both trials, the rover was controlled from a Remote Control Centre (RCC) in the UK. The RCC team included members of several ExoMars instrument teams, planetary scientists, engineers, and ESA observers. In all cases, the RCC was kept “blind” and controlled the Rover as if it were on Mars, using only Mars-like orbital remote sensing assets, and data returned to the RCC from the Rover itself. Realistic rover operations constraints (e.g., daily operating time and data budget) and tactical planning uplink/downlink time constraints were used. The astrobiological “mission success” science goal for ExoFiT was to return a drill core sample from a fine-grained sedimentary material laid down in water, or that had undergone deposition of minerals from groundwater, and so had once been both a habitable environment and one in which biosignatures could have been preserved.
Here, we present a description of the ExoFiT trials including tactical and strategic planning, pre-mission orbital mapping, and analysis of science return. We assess whether we were able to meet the ExoFit astrobiological science goal, and summarise key lessons learned for the real ExoMars Rover mission.
References cited
1. Vago, J. L. et al. Habitability on Early Mars and the Search for Biosignatures with the ExoMars Rover. Astrobiology 17, 471–510 (2017).
2. Quantin-Nataf, C. et al. ExoMars at Oxia Planum, Probing the Aqueous-Related Noachian Environments. LPI Contributions 2089, 6317 (2019).
3. Balme, M. R. et al. The 2016 UK Space Agency Mars Utah Rover Field Investigation (MURFI). Planetary and Space Science (2018) doi:10.1016/j.pss.2018.12.003.
4. Woods, M. et al. Autonomous science for an ExoMars Rover–like mission. Journal of Field Robotics 26, 358–390.
5. Coates, A. J. et al. The PanCam Instrument for the ExoMars Rover. Astrobiology 17, 511–541 (2017).
6. Josset, J.-L. et al. CLUPI, a high-performance imaging system on the ESA-NASA rover of the 2018 ExoMars mission to discover biofabrics on Mars. in vol. 14 13616 (2012).
7. Ciarletti, V. et al. The WISDOM Radar: Unveiling the Subsurface Beneath the ExoMars Rover and Identifying the Best Locations for Drilling. Astrobiology 17, 565–584 (2017).
8. Korablev, O. I. et al. Infrared Spectrometer for ExoMars: A Mast-Mounted Instrument for the Rover. Astrobiology 17, 542–564 (2017).
9. Rull, F. et al. The Raman Laser Spectrometer for the ExoMars Rover Mission to Mars. Astrobiology 17, 627–654 (2017).
How to cite: Balme, M., Schwenzer, S., Dobke, B., Azkarate, M., Juan, D., and Ludovic, D. and the ExoFit team: The ExoFit Rover field trial - simulating ExoMars Rosalind Franklin Rover operations, Europlanet Science Congress 2020, online, 21 Sep–9 Oct 2020, EPSC2020-1073, https://doi.org/10.5194/epsc2020-1073, 2020.
The ExoMars landing mission, which is currently scheduled to launch in 2022, will carry the active gamma ray and neutron spectrometer ADRON-EM and compact passive neutron spectrometer ADRON-RM to the equatorial region of Mars as part of the mission's science payload. The main science objective of the ExoMars mission is dedicated to understanding the evolution and habitability of Mars.
ADRON-EM instrument is developed in Space Research Institute (IKI) for active neutron sensing of the soil from the stationary landing platform. The main goal of this experiment is study of elemental composition of the martian subsurface down to 1 m. The instrument consists of two units, the block of detectors and electronics (DE) and the pulse neutron generator (PNG). Measuring post-pulse neutron and gamma ray emission from the soil, one can detect layering stratification of hydrogen and other major elements of the soil.
The second complementary instrument ADRON-RM (IKI) is installed on the Rover. It will measure the spatial variability of neutron flux emitted from the martian surface along the traverse. The data processing will convert the raw data into an estimation of bulk water distribution and abundance of neutron absorbing elements, mainly chlorine and iron. The instrument will also provide continuous monitoring of the neutron component of the radiation background on the surface which is necessary to know for planning future human missions to the planet.
In the beginning of the surface mission after landing, there is the unique possibility to perform the measurement of subsurface density by both instruments operating together. The data for this analysis will be obtained from different distances between rover and landing platform.
Description of ADRON-EM and RM instruments and expected results will be presented.
How to cite: Golovin, D., Nikiforov, S., Mitrofanov, I., Kozyrev, A., Litvak, M., Mokrousov, M., and Sanin, A.: Investigation of martian soil properties by complementary instruments ADRON-EM and RM instruments of ExoMars 2022 mission, Europlanet Science Congress 2020, online, 21 Sep–9 Oct 2020, EPSC2020-1032, https://doi.org/10.5194/epsc2020-1032, 2020.
Remote neutron sensing onboard martian rovers is an advanced technique in planetary science. Such measurements provide investigations on hydrogen abundances and elements with high thermal neutron absorption cross sections down to ~60 cm of subsurface [1]. The presence of hydrogen (mostly water/ice) in subsurface significantly influences the neutron leakage spectrum due moderation and thermalization through collisions with hydrogen nuclei. As a result, the variations of neutron flux detected onboard in different energy bands correlate with subsurface hydrogen/water abundance.
Dynamic Albedo of Neutrons (DAN) is the first neutron spectrometer installed on the NASA’s rover [2]. More than 7 years, NASA rover is successfully traversing across Mars surface exploring Gale crater. Adron-RM is the next generation neutron spectrometer, which is a part of the ExoMars 2022 rover payload [3].
This work will present scientific potential of remote neutron technique to distinguish local features in martian subsurface, based on DAN findings. In addition, we will provide Adron-RM measurement schematic and scientific potential on investigations in the area of the ExoMars 2022 landing site.
References
[1] Nikiforov, S. Y., et al., (2020). Assessment of water content in martian subsurface along the traverse of the Curiosity rover based on passive measurements of the DAN instrument. Icarus, 346, 113818. https://doi.org/10.1016/j.icarus.2020.113818
[2] Mitrofanov, I. G., et al., (2012). Dynamic Albedo of Neutrons (DAN) experiment onboard NASA’s Mars Science Laboratory. Space Science Reviews, 170(1–4), 559–582. https://doi.org/10.1007/s11214-012-9924-y
[3] Mitrofanov, I. G., et al., (2017). The ADRON-RM Instrument Onboard the ExoMars Rover. Astrobiology, 17(6–7), 585–594. https://doi.org/10.1089/ast.2016.1566
How to cite: Nikiforov, S., Mitrofanov, I., Litvak, M., Djachkova, M., Golovin, D., Lisov, D., Malakhov, A., Mokrousov, M., Sanin, A., and Tretyakov, V.: Experience of DAN investigation of subsurface water on Mars onboard the rover Curiosity for the future ADRON-RM experiment on the ExoMars rover, Europlanet Science Congress 2020, online, 21 Sep–9 Oct 2020, EPSC2020-1053, https://doi.org/10.5194/epsc2020-1053, 2020.
ESA’s current Mars exploration programme consists of the flying orbiters Mars Express and the Exomars TGO, while the Exomars rover is planned for launch in 2022. The Nov 2019 ESA Council of Ministers meeting, Space19+, has approved ESA contributions to a Mars Sample Return Campaign, led by NASA, with a launch of the sample retrieval missions planned to occur as early as 2026.
While the vast majority of ESA’s funding for Mars exploration in 2020’s is planned to be invested in Mars Sample Return, there is interest to assess, at Phase 0-level, the possibility of implementing a small mission to Mars in parallel with or soon after the completion of the MSR programme, in order to further the exploration of Mars in areas not directly addressed by MSR.
A study was undertaken in the Concurrent Design Facility at ESA, ESTEC in order to assess low cost mission architectures for small satellite missions to Mars. Given strict programmatic constraints, the focus of the study was on a low cost, short mission development schedule with a cost-driven spacecraft design and mission architecture.
Three mission cases were studied:
The study assessed a wide range of mission architectures and focused on commercial rideshare options to GTO from which the satellite(s) would transfer to Mars utilising either chemical or electric propulsion. The study results showing the feasibility of such missions meeting the programmatic constraints and options for future work will be presented.
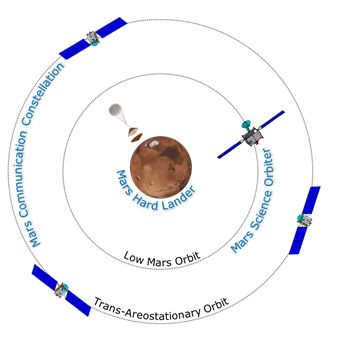
How to cite: Parfitt, C., McSweeney, A., Ball, A., De Backer, L., Orgel, C., and Vijendran, S.: Small Mars Mission Architectural Study, Europlanet Science Congress 2020, online, 21 Sep–9 Oct 2020, EPSC2020-732, https://doi.org/10.5194/epsc2020-732, 2020.
Abstract
Areostationary Relay Satellites are the most robust candidates to meet the coming set of Mars science missions. Areostationary satellites combine both the continuous coverage over the same Mars localization and the return of engineering and scientific instrument data in almost real time needed for the tele-robotic exploration. We present a procedure to minimize the total required impulses magnitudes in the major mission phases for an areostationary satellite. This mission design optimization problem involves two main problems. First, the determination of the launch and arrival dates for an optimal minimum energy Earth-Mars transfer trajectory. Second, the optimal minimum thrust manoeuvres to capture the spacecraft from the hyperbolic arrival trajectory to Mars and place it in the areostationary orbit.
1. Introduction
An areostationary satellite would orbit Mars in an areoequatorial circular orbit with a semi-major axis of as = 20428 km to remain over a fixed point on the Martian surface with respect to the rotating Mars with a period of P=88775.244 s (Montabone, 2020). The purpose of this work is to analyse the elliptic heliocentric transfer and the hyperbolic areocentric orbits to achieve the final areostationary position with the minimal impulses cost. To this end, first the elliptic trajectory optimization using genetic metaheuristic algorithms is performed. Then, an analysis of accuracy of the matched solutions for the elliptic and the hyperbolic orbits using an iterative procedure at the Mars influence sphere is accomplished. Finally, the Mars arrival manoeuvres needed to capture the probe and to place it in an areostationary orbit are optimized.
2. Earth to Mars elliptic transfer optimization
In this minimum-energy problem, we search a solution minimizing the equation:
where the characteristic energy at the boundary of the sphere of influence of the Earth, C3= V2∞E, and the Mars arrival velocity V∞M are weighted according to WC3 and W∞M, respectively. The minimum C in equation (1) tends to give lower values of the total impulsive manoeuvres required, first to give to the space vehicle an orbital velocity greater than the parabolic Earth escape velocity, and after, at the Mars arriving hyperbolic orbit, to reduce the hyperbolic excess velocity to capture the probe.
Determining the optimal elliptic orbital transfer parameters by minimizing C by exhaustive search or analytical methods is infeasible as for each Earth departure date and Mars arrival date combination the Lambert's problem needs to be solved:
being  and
and  the heliocentric Earth and Mars position vectors and
  the areocentric vector position of the spacecraft in an ecliptic reference system.
Genetic algorithms are metaheuristic algorithms that explore different solutions amongst a defined population, finding a possible minimum solution. Lambert's problem shall be solved for each member of the population following the procedure in Gooding (1988), having the orbital elements of the spacecraft's orbit once the solution is achieved. Table 1 shows different simulation scenarios to compare genetic algorithms performance minimizing the cost function C. Figure 1 shows an optimal transfer for launch on 20th July 2020 and arrival on 1st February 2021.


3. Accuracy analysis for the conic matching procedure
To match the heliocentric and the areocentric orbits, the following model is used:
The function f corresponds to the Lambert's problem (2), g and h are given in Battin (1999). Then, the following iterative method is implemented:
that converges when the following condition is met:
which is equivalent to:
Simulations are performed introducing different initial inclination conditions. The method converges, after 3 iterations, to the objective values of the periapsis radius and the inclination of the hyperbolic orbit.
4. Mars arrival optimization
Finally, we present the procedure for minimizing the total impulse needed to capture the probe and to place it in an areostationary orbit:
where  is the capture manoeuvre to avoid the probe leaving its sphere of influence on a flyby trajectory;
  and
and  are the Hoffman transfer maneuvers from the capture orbit to target the areostationary orbit; and
  is the inclination correction manoeuvre to reach the final zero desired inclination.
5. Summary and Conclusions
Optimal dates which provide minimum hyperbolic excess velocity at Earth and the Mars arrival velocity are determined to obtain the optimal transfer orbit from Earth to Mars. Then, an iterative procedure is proposed to match the heliocentric and areocentric orbits at Mars sphere of influence which converges to the objective values to position the spacecraft in the areostationary orbit. Optimal Mars arrival manoeuvres are obtained when hyperbolic periapsis is fixed to be the semi-major axis of the areostationary orbit with the minimum inclination constrained by the areocentric declination of the arrival velocity direction V∞M.
Acknowledgements
Part of this research has been funded by the Government of Spain (Project ESP2016-79135-R).
References
Montabone, L. et al, Observing Mars from Areostationary Orbit: Benefits and Applications, 2020, MEPAG
Gooding, R.H., On the solution of Lambert's orbital boundary-value problem, 1988, Royal Aerospace Establishment
Battin, R.H., An Introduction to the Mathematics and Methods of Astrodynamics, 1999, AAIA Educational Series
How to cite: Sanchez-Garcia, M. M., Barderas, G., and Romero, P.: Analysis of the optimization for an Earth to Mars areostationary mission, Europlanet Science Congress 2020, online, 21 Sep–9 Oct 2020, EPSC2020-134, https://doi.org/10.5194/epsc2020-134, 2020.
Please decide on your access
Please use the buttons below to download the presentation materials or to visit the external website where the presentation is linked. Regarding the external link, please note that Copernicus Meetings cannot accept any liability for the content and the website you will visit.
Forward to presentation link
You are going to open an external link to the presentation as indicated by the authors. Copernicus Meetings cannot accept any liability for the content and the website you will visit.
We are sorry, but presentations are only available for users who registered for the conference. Thank you.