Poster presentations and abstracts
Martian research in Europe has grown exceptionally over the past decades, first thanks to the longstanding achievements of the Mars Express community and more recently thanks to the great contributions of the ExoMars 2016 Trace Gas Orbiter mission, leading Europe to a prime role within the international martian community. This valuable experience has paved the way for the new exciting discoveries expected in the next years from the ExoMars Rover and Surface Platform and in the future by the Mars Sample Return programme.
The aim of this session is to recognize the experience gained with European Mars missions and promote new synergies to enhance the collaboration within the European science community, in close coordination with other international agencies (NASA, Roscomos, JAXA, CSA, etc.)
This session welcomes contributions from any field of Martian scientific research, including also operational, technical and interdisciplinary aspects involving the different Mars missions, especially those covering multi-mission and international collaborations over a wide range of topics: Mars subsurface, surface geology and mineralogy, atmosphere, magnetosphere, martian moons and any potential exo-biological implication in the context of the new exploration missions.
Public information:
Session summary is now available online with the showcase presentation given by the Project Scientists of all ESA's Mars missions. This includes the latest science highlights from Mars Express and Trace Gas Orbiter, the status of the ExoMars 2022 Rover and Surface Platform and the preparations for the Mars Sample Return programme. Please visit the presentations and do not hesitate to comment and discuss with all authors, especially Early Career Researchers.
Session assets
Abstract
The dosimetric telescope Liulin-MO [1] for measuring the radiation environment onboard the ExoMars TGO is a module of the Fine Resolution Epithermal Neutron Detector (FREND) [2].
Here we present recent results from measurements of the charged particle fluxes, dose rates and estimation of radiation quality factors and dose equivalent rates at ExoMars TGO science orbit (circular orbit with 400 km altitude, 740 inclination, 2 hours orbit period), provided by Liulin-MO dosimeter from May 01, 2018 to June 10, 2020.
Since now the dosimeter has measured the dosimetric parameters of the galactic cosmic rays (GCR). Solar particle events were not registered. The measurements were taken during the declining and minimum of the Solar activity in 24th Solar cycle.
Compared are the time profiles of particles and neutron detections from Liulin-MO, FREND/TGO and HEND/Odyssey [3] measured for the period May 2018 –December 2019.
Liulin-MO contains two dosimetric telescopes arranged at two perpendicular directions [1]. The parameters, provided by Liulin-MO simultaneously for two perpendicular directions have the following ranges: absorbed dose rate from 10-7 Gy h-1 to 0.1 Gy h-1; particle flux in the range 0 - 104 cm-2 s-1; energy deposition spectrum and coincidence energy deposition spectrum in the range 0.08 - 190 MeV.
Similar to FREND, HEND/Odyssey is a neutron spectrometer based on 3He proportional counters but with smaller sensitivity and without collimation as in FREND [3], [4].
The fluxes and dose rates recorded in the perpendicular detectors B(A) and D(C) of Liulin-MO and count rates of Oulu neutron monitor (http://cosmicrays.oulu.fi/) for the period from 1 May 2018 to 10 June 2020 are shown in Figure 1. An increase of all quantities – flux, dose rate and Oulu count rate due to solar cycle modulation is observed. In this period in two perpendicular directions B(A) and D(C) the average values are: dose rate 14.8±1.5/15.4±1.5 microGy h-1, planar flux 3.11/3.21 cm-2 s-1, quality factor Q 3.5±0.26, dose equivalent rate 1.61±0.33/1.66±0.34 mSv d-1.

In Figure 2 is shown the comparison between the normalised (relatively to the mean daily value for the full period) daily mean Liulin-MO data and HEND data accumulated in energy channels 1 – 8, most sensitive to the charge particles of GCR. These profiles demonstrate good correlation both on a short time scale (days) and long term scale (months). The total amplitude of variations observed during 20 months of TGO mapping is about 8%. Figure 3 presents the comparison between the normalised FREND total counts rate and HEND data accumulated in the energy channels 9 – 16, mostly populated with counts from Martian neutron albedo (which is produced by GCR by interaction with matter in the shallow subsurface). These curves also show high correlation with each other both on short and long term scales.


The obtained data from May 2018 to April 2019 show that 1) An increase of the dose rates and fluxes is observed from May 2018 to March 2020 which corresponds to the increase of GCR intensity during the declining of the solar activity. From March to June 2020 the measured values are practically equal, corresponding to the minimum of the solar activity; 2) The time profiles of GCR daily variations measured by Liulin-MO and HEND demonstrate good correlation. The comparison between the normalised FREND total counts rate and HEND data accumulated in the energy channels mostly populated with counts from Martian neutron albedo also show high correlation with each other. The difference in the long term variations between the profiles of GCR and neutron albedo might be addressed to how the solar modulation changes directly the GCR flux and how it changes emission of neutron albedo by interaction with a matter in the Martian shallow subsurface.
Acknowledgements
The work in Bulgaria is supported by the Contract No. 4000117692/16/NL/NDe funded by the Government of Bulgaria through an ESA Contract under the PECS (Plan for European Cooperating States) and by Project No. 129 for bilateral projects of the National Science Fund of Bulgaria and Russian Foundation for Basic Research. The work in Russia is supported by Grant 19-52-18009 for bilateral projects of the National Science Fund of Bulgaria and Russian Foundation for Basic Research in part of HEND data analysis, and Russian Science Foundation Grant 19-72-10144 in part of FREND data analysis.
References
[1] Semkova, J., et al: Charged particles radiation measurements with Liulin-MO dosimeter of FREND instrument aboard ExoMars Trace Gas Orbiter during the transit and in high elliptic Mars orbit, Icarus 303, 53–66, 2018, https://doi.org/10.1016/j.icarus.2017.12.034
[2] Mitrofanov, I., et al: Fine Resolution Epithermal Neutron Detector (FREND) onboard the Trace Gas Orbiter, Space Sci Rev, August 2018, 214:86, https://doi.org/10.1007/s11214-018-0522-5
[3] Mitrofanov, I., et al: Maps of Subsurface Hydrogen from the High Energy Neutron Detector, Mars Odyssey, Science, 2002, Volume 297, Issue 5578, 78-81
[4] Mitrofanov I.G. et al: Search for water in Martian soil using global neutron mapping by the Russian HEND instrument onboard the US 2001 Mars Odyssey spacecraft, Solar System Research, 2003, Volume 37, Issue 5, 366-377
How to cite: Semkova, J. and the Liulin-MO-FREND: Update of the radiation environment measurement results aboard ExoMars TGO in May 2018-June 2020, Europlanet Science Congress 2020, online, 21 Sep–9 Oct 2020, EPSC2020-50, https://doi.org/10.5194/epsc2020-50, 2020.
NOMAD is a suite of three spectrometers on-board the ExoMars Trace Gas Orbiter. The spectrometers operate in solar occultation, nadir and limb observing modes, measuring in the infrared (2.2-4.3um in occultation; 2.2-3.8um in nadir) and UV-visible (0.2-0.65um) spectral regions. The nominal science phase began on 21st April 2018; since then NOMAD has collected over one Martian year of data.
Due to the very high spectral and spatial resolution of NOMAD, an enormous amount of data has already been generated - including tens of millions of solar occultation and nadir spectra - which currently total around four terabytes and are spread across almost half a million files. To serve the scientific community, all calibrated data will eventually be made publicly available in PDS4 format via the ESA Planetary Science Archive at
At the time of writing, the NOMAD data collection has successfully passed peer review, and data from two of the three channels will be available very shortly. This first release will consist of: 1) infrared solar occultation data; 2) UV-visible solar occultation data; and 3) UV-visible nadir data. The infrared nadir and infrared and UV-visible limb data will be released later, once the calibration is finalised. In this presentation I will update the scientific community on the current status of the NOMAD PSA archive, including a description of the data and how to start using it.
How to cite: Thomas, I., Vandaele, A. C., Daerden, F., Ristic, B., Willame, Y., Depiesse, C., Aoki, S., Trompet, L., Erwin, J., Robert, S., Piccialli, A., Neary, L., Viscardy, S., Mason, J., Patel, M., Bellucci, G., and Lopez-Moreno, J. J.: NOMAD on ExoMars TGO: Data processing and public release via the ESA Planetary Science Archive, Europlanet Science Congress 2020, online, 21 Sep–9 Oct 2020, EPSC2020-521, https://doi.org/10.5194/epsc2020-521, 2020.
This project takes advantage of the NOMAD spectrometer observations, on board the 2016 ExoMars Trace Gas Orbiter. These observations will help to determine the Martian surface properties. This work focuses on surface ice detection.
ExoMars is an ESA-Roscosmos joint mission consisting of an orbiter (Trace Gas Orbiter - TGO). The Nadir and Occultation for Mars Discovery (NOMAD) is one of the four instruments on board TGO. The instrument is a suite of three spectrometers designed to observe the atmosphere and the surface of Mars in the UV, visible and IR. For this study, the Limb, Nadir and Occultation (LNO) channel, operating in the IR, is selected [1,3]. Thanks to the nadir geometry, the NOMAD-LNO spectrometer can provide information on Martian surface, in particular on surface ices. Ice deposits exhibit specific IR signatures in the 2.3-3.8 μm range of NOMAD-LNO, which reveals information on their composition, texture and size of the ice grains [4].
We use the NOMAD nadir data to map the presence of ices for MY 34 (Ls = 150°-360°) and MY 35 (Ls = 0°-210°) with a solar zenith angle below 80 degrees. Raw data have been calibrated by using full solar scans to provide the reflectance factor which is the spectral radiance measured by NOMAD divided by the solar spectral irradiance corrected for the incident angle.
We use spectral indices based on reflectance factor similar to G. Bellucci et al., 2019 [2]. An ice index is defined as a ratio between two orders taking into account the albedo variations. The objective is to remove the atmospheric effects. In this work, we propose different indices to detect the two polar caps and the sublimation process. The orders 194 (2275 - 2293.2 nm), 189 (2335.2 - 2363.9 nm) and 167 (2642.8 - 2663.9 nm) have been selected. We call Index 1, the index defined as 189/167 [5], and Index 2, 194/167. While orders 194 and 189 have wavelengths on the radiance continuum, the order 167 is located on the shoulder of 2.7 µm CO2/H2O ices absorption.
All LNO observations considered in this study with the orders given above are organized as Latitude and Solar longitude maps, called seasonal maps. Figure 1 shows the seasonal map for Index 1 during MY 34. The good coverage allows observing the sublimation process for the southern polar cap between the 150°-250° solar longitude. Due to the lack of observations, the detection of the northern polar cap does not seem very clear. Nevertheless, Index 1 gives high values between Ls = 320°-340° and for latitudes above 60° which should correspond to the polar cap in that region. Figure 2 shows the same index for MY 35. The sublimation process can be observe for the northern polar cap between Ls= 0°-30°. A small detection of the southern polar cap can be see after Ls = 200°.
Figure 3 shows the seasonal map for Index 2. There are observations only for MY35 and many gaps are present due to the lack of observations. Nevertheless, the two polar caps can be observe in the plot. Index 2 gives the two sublimation processes between Ls = 0°-30° for the northern polar cap and around Ls = 200° for the southern polar cap.
Those new results extend the temporal and spatial of the previous work (G. Bellucci et al., 2019 [2] and L. Ruiz Lozano et al., 2019 [5]).

Figure 1: Seasonal map of Index 1 for MY 34 showing the sublimation of the southern polar cap.

Figure 2: Seasonal map of Index 1 for MY 35 showing the sublimation of the northern polar cap.

Figure 3: Seasonal map of Index 2 for MY 35 showing the sublimation of the two polar caps.
Acknowledgements
The NOMAD experiment is led by the Royal Belgian Institute for Space Aeronomy (IASB-BIRA), assisted by Co-PI teams from Spain (IAA-CSIC), Italy (INAF-IAPS), and the United Kingdom (Open University). This project acknowledges funding by the Belgian Science Policy Office (BELSPO), with the financial and contractual coordination by the ESA Prodex Office (PEA 4000103401, 4000121493), by Spanish Ministry of Science and Innovation (MCIU) and by European funds under grants PGC2018-101836-B-I00 and ESP2017-87143-R (MINECO/FEDER), as well as by UK Space Agency through grants ST/R005761/1, ST/P001262/1, ST/R001405/1 and ST/R001405/1 and Italian Space Agency through grant 2018-2-HH.0. This work was supported by the Belgian Fonds de la Recherche Scientifique – FNRS under grant number 30442502 (ET_HOME). The IAA/CSIC team acknowledges financial support from the State Agency for Research of the Spanish MCIU through the ‘Center of Excellence Severo Ochoa’ award for the Instituto de Astrofísica de Andalucía (SEV-2017-0709). US investigators were supported by the National Aeronautics and Space Administration. Canadian investigators were supported by the Canadian Space Agency.
References
[1] A.C. Vandaele et al., Optical and radiometric models of the NOMAD instrument part I: the UVIS channel. Optics Express, 23(23):30028–30042,2015.
[2] G. Bellucci et al., TGO/NOMAD Nadir observations during the 2018 global dust storm event, EPSC-DPS 2019
[3] E. Neefs et al., NOMAD spectrometer on the ExoMars trace gas orbiter mission: part 1—design, manufacturing and testing of the infrared channels. Applied optics, 54(28):8494–8520, 2015.
[4] Y. Langevin et al., Observations of the south seasonal cap of Mars during recession in 2004–2006 by the OMEGA visible/near-infrared imaging spectrometer
[5] L. Ruiz Lozano, Use of NOMAD Observations (Trace Gas Orbiter) for Mars surface depositions, EPSC-DPS 2019
How to cite: Ruiz Lozano, L., Karatekin, Ö., Caldiero, A., Imbreckx, A.-C., Temel, O., Dehant, V., Daerden, F., Thomas, I., Ristic, B., Patel, M., Bellucci, G., López Moreno, J. J., and Vandaele, A. C.: Use of TGO-NOMAD nadir observations for ices detection, Europlanet Science Congress 2020, online, 21 Sep–9 Oct 2020, EPSC2020-748, https://doi.org/10.5194/epsc2020-748, 2020.
The NOMAD-SO channel [1, 2] is an infrared spectrometer working in the 2.2 to 4.3 µm spectral range (2325-4545 cm-1). The instrument is composed of an echelle grating coupled to an Acousto-Optical Tunable Filter for the diffraction order selection [3]. NOMAD started to perform solar occultation measurement on April 21, 2018. As TGO is on a quasi-circular orbit at around 400 km of altitude, it performs one orbit every two hours. During a solar occultation measurement, SO scans six diffraction orders each second. These diffraction orders are recorded on four bins leading to a vertical sampling below 1 km. The calibration of the SO channel is described in [4] and is being refined.
NOMAD-SO regularly scans different diffraction orders containing CO2 lines to allow CO2 retrievals from low to high altitudes. For each solar occultation measurement, we derive a slant column profile of CO2 using ASIMUT-ALVL [4]. ASIMUT is a radiative transfer program developed at BIRA-IASB and based on the Optimal Estimation Method [5]. The GEM-Mars GCM provides the a priori profiles of CO2 local density, pressure and temperature. We then apply Tikhonov linear regularization on the slant column to derive a smoothed local density. We finally apply the hydrostatic equilibrium equation and the ideal gas law to derive the temperature profiles [6-8]. That derived temperature profile serves then in a new loop where we perform again the previous steps until the profiles converge [8]. Several comparisons are ongoing with joint or co-located measurements from MAVEN-EUVM, Maven-NGIMS, and TGO-ACS-NIR as well as with GCM derived profiles from GEM-Mars and LMD-MGCM. We derived the NOMAD-SO CO2 and temperature profiles for MY34 with solar longitudes (Ls) extending from 298° to 326°. That time range contains the regional dust storm of MY34 that started at Ls 317°. We will present the updated CO2 and temperature profiles from NOMAD-SO measurements
Acknowledgements
ExoMars is a space mission of the European Space Agency (ESA) and Roscosmos. The NOMAD experiment is led by the Royal Belgian Institute for Space Aeronomy (IASB-BIRA), assisted by Co-PI teams from Spain (IAA-CSIC), Italy (INAF-IAPS), and the United Kingdom (Open University). This project acknowledges funding by the Belgian Science Policy Office (BELSPO), with the financial and contractual coordination by the ESA Prodex Office (PEA 4000103401, 4000121493), by the Spanish Ministry of Science and Innovation (MCIU) and by European funds under grants PGC2018-101836-B-I00 and ESP2017-87143-R (MINECO/FEDER), as well as by UK Space Agency through grant ST/R005761/1 and Italian Space Agency through grant 2018-2-HH.0. The IAA/CSIC team acknowledges financial support from the State Agency for Research of the Spanish MCIU through the ‘Center of Excellence Severo Ochoa’ award for the Instituto de Astrofísica de Andalucía (SEV-2017-0709). This work was supported by the Belgian Fonds de la Recherche Scientifique – FNRS under grant numbers 30442502 (ET_HOME) and T.0171.16 (CRAMIC) and BELSPO BrainBe SCOOP Project. US investigators were supported by the National Aeronautics and Space Administration.
References
[1] Vandaele, A.C., et al.: Science objectives and performances of NOMAD, a spectrometer suite for the ExoMars TGO mission, Planet. Space Sci., Vol. 119, pp 233-249, 2015.
[2] Neefs, E., et al.: NOMAD spectrometer on the ExoMars trace gas orbiter mission: part1 – design, manufacturing and testing of the infrared channels, Appl. Opt., Vol. 54(28), pp 8494-8520, 2015.
[3] Thomas, I.R., et al.: Optical and radiometric models of the NOMAD instrument part II: the infrared channels – SO and LNO, Opt. Express, Vol. 24(4), pp 3790-3805, 2016.
[4] Liuzzi, G. et al.: Methane on Mars: New insights into the sensitivity of CH4 with the NOMAD/ExoMars spectrometer through its first in-flight calibration. Icarus. 321, 2018.
[4] Vandaele, A.C., Kruglanski, M., De Mazière, M., Modeling and retrieval of atmospheric spectra using ASIMUT. Proceedings of the First Atmospheric Science Conference, ESRIN, Frascati, Italy, 2006.
[5] Rodgers, C.D., Inverse method for atmospheric sounding: theory and practice. Hackensack, N.J. (Ed.), World Scientific University of Oxford, Oxford, 2000.
[6] Gröller, H., et al.: MAVEN/IUVS stellar occultation measurements of Mars atmospheric structure and composition. Journal of Geophysical Research: Planets, 123, 1449–1483, 2018.
[7] Snowden D., et al. :The thermal structure of titan's upper atmosphere, I: temperature profiles from Cassini INMS observations, Icarus, Vol. 226, pp. 552-582, 2013.
[8] Mahieux, A. et al.: Densities and temperatures in the Venus mesosphere and lower thermosphere retrieved from SOIR on board Venus Express: Carbon dioxide measurements at the Venus terminator, J. Geophys. Res., Vol 117, E07001, 2012.
How to cite: Trompet, L., Vandaele, A. C., Aoki, S., Erwin, J., Thomas, I., Villanueva, G., Liuzzi, G., Crismani, M., Lopez-Valverde, M. A., Hill, B., Piccialli, A., Daerden, F., Ristic, B., Lopez-Moreno, J. J., Bellucci, G., and Patel, M.: Update on CO2 and temperature profiles from NOMAD-SO on board ExoMars TGO, Europlanet Science Congress 2020, online, 21 Sep–9 Oct 2020, EPSC2020-641, https://doi.org/10.5194/epsc2020-641, 2020.
Abstract
Here we analyse nadir data from both the UVIS and LNO channels of the NOMAD spectrometer [1], onboard ExoMars/TGO, to obtain information about Martian dust densities and grains sizes. The combined dataset is analyzed with the MITRA radiative transfer tool [2,3,4]. The method is validated on a NOMAD orbit registered during the 2018 global dust storm to assess its most critical issues and is currently being extended to the whole available spatially and temporally coincident UVIS and LNO nadir data.
Introduction
The investigation of the presence and distribution of trace gases on Mars is fundamental to understand the atmosphere past evolution and provides insights on the research of biotic activities. Recent studies focused on the 2018 global-scale dust event as observed from the TGO instruments demonstrate that Martian dust can affect the abundance and distribution of atmospheric trace gases [5,6,15], making it a driver for their evolution. Suspended dust on Mars drives the planet’s thermal structure and climate [7], heating the lower atmosphere through absorption in the VIS-NIR spectral range [8] and efficiently radiating heat to space through IR emission [9,10,8,11]. These heating and cooling mechanisms affect the water-ice clouds formation, strengthen the mean meridional circulation and can drive deep localized convection, leading to variations and redistributions of water vapour abundances [6,15]. For the above reasons, the understanding of dust properties is mandatory in order to correctly investigate the vertical distribution of Martian trace gases.
Observations
The NOMAD spectrometer operates with three channels in the ultraviolet/visible spectral range (UVIS channel) and in the infrared (LNO and SO channels) in nadir, limb and solar occultation geometries. Although the instrument has been mainly conceived to study the trace gases in the atmosphere of the red planet, it can also provide valuable information regarding the properties of Martian dust. In this regard, in this work we use the UVIS and LNO channels nadir data to construct a dataset of spatially and temporally coincident data to study the microphysical properties of Martian dust.
Method
The UVIS spectral range alone (0.20–0.65 μm) does not allow to disentangle with high precision the information related to the dust density from that of dust grains sizes. The use of both the ultraviolet/visible and infrared ranges together is mandatory in order to obtain these properties. Indeed, we show that while the order of magnitude of the dust optical depth can be inferred from the UVIS data alone, dust grains sizes can be retrieved only by studying how the observed spectra bend between visual and near infrared wavelengths. For the purpose of the analysis presented here we use only LNO orders covering the wavelength range 2.20-2.65 μm, which is approximately free from gaseous absorption and, hence, it is suitable to investigate dust properties. We use the MITRA radiative transfer model and inversion algorithm to retrieve dust densities and grain sizes. We take the temperature-pressure profiles from the Mars Climate Database (MCD, [12]) and use the dust optical constants from [13]. The procedure followed to derive the surface albedo spectra, needed in the forward model, is based on the SAS method [14] applied to the OMEGA dataset. For this reason, we use UVIS data only down to 0.4 μm to avoid extrapolating the information of the surface albedo at wavelengths shorter than OMEGA lower spectral limit. This method is tested and validated on a NOMAD observation acquired on the 8th of June 2018 during a global dust storm and is now being extended to all spatially and temporally coincident observations of UVIS and LNO channels. If no coincident LNO observations are available for a certain UVIS orbit, we apply the MITRA tool to the UVIS spectral range alone to obtain the dust integrated optical depth.
Summary
The presented method allows to study the properties of Martian dust obtaining information on grains densities and sizes whenever temporally and spatially coincident UVIS and LNO observations are available. When this is not possible, the analysis is performed on the UVIS data alone to obtain the dust integrated optical depth. Through the application of this method to the whole NOMAD dataset we aim to produce a set of dust properties associated to each observation with a precision that is only achievable by exploiting the combined UVIS and LNO spectral ranges.
Acknowledgements
ExoMars is a space mission of the European Space Agency (ESA) and Roscosmos. The NOMAD experiment is led by the Royal Belgian Institute for Space Aeronomy (IASB-BIRA), assisted by Co-PI teams from Spain (IAA-CSIC), Italy (INAF-IAPS), and the United Kingdom (Open University). This project acknowledges funding by the Belgian Science Policy Office (BELSPO), with the financial and contractual coordination by the ESA Prodex Office (PEA 4000103401, 4000121493), by Spanish Ministry of Science and Innovation (MCIU) and by European funds under grants PGC2018-101836-B-I00 and ESP2017-87143-R (MINECO/FEDER), as well as by UK Space Agency through grants ST/R005761/1, ST/P001262/1, ST/R001405/1 and ST/R001405/1 and Italian Space Agency through grant 2018-2-HH.0. This work was supported by the Belgian Fonds de la Recherche Scientifique – FNRS under grant number 30442502 (ET_HOME). The IAA/CSIC team acknowledges financial support from the State Agency for Research of the Spanish MCIU through the ‘Center of Excellence Severo Ochoa’ award for the Instituto de Astrofísica de Andalucía (SEV-2017-0709). US investigators were supported by the National Aeronautics and Space Administration. Canadian investigators were supported by the Canadian Space Agency.
References:[1]Neefs, E., et al, 2015. Appl. Opt. 54, 28, 8494-8520.[2]Oliva, F., et al, 2016. Icarus 278, 215-237.[3]Sindoni, G., et al, 2013. EPSC2013.[4]Oliva, F., et al, 2018. Icarus 300, 1-11.[5]Daerden, F., et al, 2019. Icarus 326, 197-224.[6]Vandaele, A.C., et al, 2019. Nature 568, 521-525.[7]Kahre, M.A., et al, 2008. Icarus 195, 576-597.[8]Korablev, O. ,et al, 2005. Adv. Space Res. 35, 21–30.[9]Gierasch, P.G., Goody, R.M., 1972. J. Atmos. Sci. 29, 400–402.[10]Pollack, J.,et al, 1979. J. Geophys. Res. 84, 2929–2945.[11]Määttänen, A., et al, 2009. Icarus 201, 504-516.[12]Millour, E., et al, 2015. EPSC2015.[13]Wolff, M.J., et al, 2009. J. Geophys. Res., 114, E9.[14]Geminale, A., et al, 2015. Icarus 253, 51-65.[15]Aoki, S., et al. 2019. J. Geophys. Res.: Planets,124, 3482-3497.
How to cite: Oliva, F., D'Aversa, E., Bellucci, G., Altieri, F., Carrozzo, F. G., Amoroso, M., Daerden, F., Thomas, I. R., Ristic, B., Mason, J., Willame, Y., Depiesse, C., Patel, M. R., Lopez-Moreno, J. J., and Vandaele, A. C. and the NOMAD Team: Mars dust properties by means of TGO/NOMAD UVIS and LNO channels nadir data analysis, Europlanet Science Congress 2020, online, 21 Sep–9 Oct 2020, EPSC2020-649, https://doi.org/10.5194/epsc2020-649, 2020.
We study the evolution of the size of the polar ice caps on Mars using data collected by the CRISM spectrometer onboard MRO. The presence of H2O and CO2 on the surface is determined with the help of spectral indices. This study represents an extension of previous works to the latest data available, and aims at validating methods which have been applied to observations of similar kind by the NOMAD spectrometer onTGO. Moreover, mesoscale simulations using MarsWRF model will be performed to be compared with the observations.
1. Introduction
The Martian polar caps experience seasonal variability related to mass exchanges with the atmosphere. The evolution of the Martian polar caps has been studied using different satellite observations including gravity field [1], Epithermal Neutron [2] and optical in thermal infrared [3], visible [4], and near-infrared [5]. In particular, in this study we use publicly available datafromtheCompactReconnaissanceImagingSpectrometer for Mars (CRISM) which is a visible to nearinfrared spectrometer (operating in the range of wavelengths between 0.4 and 4.0µm) onboard the Mars Reconnaissance Orbiter (MRO) spacecraft.
2. Data and Methods
The principal data considered in this project are the CRISM pushbroom observations, in particular those obtained in the multispectral (MSP) and hyperspectral (HSP) mapping modes. The dataset analyzed by Brown et al. [6, 7] will be expanded to include the latest observations overlapping with the first science measurements from NOMAD. These measurements are available on the Planetary Data System in units of I/F, and are converted to reflectance factors (R) after dividing by the cosine of the incidence angle. The signature of surface ice in these spectra is detected by studying the strength of absorption bands typical of H2O and CO2 ice. The most prominent ones within the set of wavelengths sampled by CRISM are those centered at 1435 nm for CO2 ice and around 1500 nm for H2O ice. In addition, absorption bands in the region between 2.2 and 2.3 µm are considered, both because they fall in the range of wavelengths detectable by NOMAD and because may prove helpful in the determination of the ice grain sizes [6]. The absorption bands are modeled with simple linear models, so that their band depth (BD) is described by algebraic spectral indices, as provided by Viviano-Beck et al. [8]. The depth of the absorption band (and thus the value of the ice index) for each spatial pixel is not directly related to the abundance of the corresponding substance on the surface, for it depends also on factors like the contamination from dust and the size of the ice grains. These factors are accounted for by comparison with synthetic spectra provided by the Planetary Spectrum Generator (PSG). The data are grouped in bins of solar longitude (LS) and (areocentric) longitude, and for each image the pixels in the cross-track direction are averaged together to increase the signal-to-noise ratio (SNR). The ice indices are evaluated for each of the resulting spectra. A threshold is selected for the values of both indices, below which the corresponding species is assumed to be absent from the surface. Thus, for each LS and longitude bin, the latitude of the pixel furthest away from the pole presenting a value of the ice index higher than the threshold is taken as a point of the polar cap edge. The points are linearly interpolated, to obtain the H2O and the CO2 polar cap edges, also referred to as CROHUS and CROCUS lines, respectively. The results are compared with the other observations as well as Global Circulation Models (MarsWRF) [9].
3. Discussion and Outlook
Figure 1: Evolution of the CO2 ice in the South polar cap from MY30 to MY33. The plot in the lower part displays the corresponding areas. Those obtained by Brown et al. (MY 29) [6] are also shown for comparison.
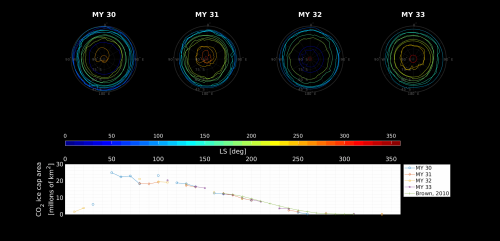
Figure1 shows results describing the variability of the South polar CO2 ice cap during four Mars years(MY), from MY30 to MY33. In this phase, the values of the thresholds for the H2O and CO2 are set to those employed by Brown et al. [7], which limit the contributions from noisy spectra and clouds absorptions. The plot in the lower part displays the corresponding areas. Those obtained by Brown et al. (MY 29) [6] are also shown for comparison, which exhibits a good agreement with ours. Finally, the interannual differences in cap evolution seem to be of the same order or below the uncertainty of the estimates and therefore, could not be separated from uncertainties of the detection method.
References
[1] O.Karatekin,T.V.Hoolst,andV.Dehant. Martian global-scale CO2 exchange from time-variable gravity measurements. Journal of Geophysical Research: Planets, 111(E6), 2006.
[2] D. Golovin, I. Mitrofanov, A. Anikin, et al. Variations of polar CO2 caps during the first Martian year of FREND onboard TGO. EGU General Assembly 2020, Online, 4–8 May 2020, EGU20209303, 2020.
[3] S.Piqueux,A.Kleinböhl,P.O.Hayne,etal. Variability of the martian seasonal CO2 cap extent over eight Mars Years. Icarus,251:164–180,May 2015.
[4] W.M.Calvin,P.B.James,B.A.Cantor,andE.M. Dixon. Interannual and seasonal changes in the north polar ice deposits of Mars: Observations from MY 29–31 using MARCI. Icarus, 251:181– 190, May 2015.
[5] T. Appéré, B. Schmitt, Y. Langevin, et al. Winter and spring evolution of northern seasonal deposits on Mars from OMEGA on Mars Express. Journal of Geophysical Research: Planets, 116(E5), May 2011.
[6] A. J. Brown, W. M. Calvin, P. C. McGuire, and S. L. Murchie. Compact Reconnaissance Imaging Spectrometer for Mars (CRISM) south polar mapping: First Mars year of observations. Journal of Geophysical Research: Planets, 115(E2), 2010.
[7] A. J. Brown, W. M. Calvin, and S. L. Murchie. Compact Reconnaissance Imaging Spectrometer for Mars (CRISM) north polar springtime recession mapping: First 3 Mars years of observations. Journal of Geophysical Research: Planets, 117(E12), December 2012.
[8] C. E. Viviano-Beck, F. P. Seelos, S. L. Murchie, et al. Revised CRISM spectral parameters and summary products based on the currently detected mineral diversity on Mars. Journal of Geophysical Research: Planets, 119(6):1403–1431, 2014.
[9] O. Temel, Ö. Karatekin, E. Gloesener, M. A. Mischna, and J. van Beeck. Atmospheric transport of subsurface, sporadic, time-varying methane releases on mars. Icarus, 325:39–54, 2019.
How to cite: Imbreckx, A.-C., Caldiero, A., Ruiz Lozano, L., Temel, O., and Karatekin, Ö.: Evolution of Mars polar caps extent from CRISM data, Europlanet Science Congress 2020, online, 21 Sep–9 Oct 2020, EPSC2020-747, https://doi.org/10.5194/epsc2020-747, 2020.
Introduction:
In an effort to aid the characterisation of Oxia Planum, selected as the Rosalind Franklin rover’s landing site partly due to its extensive Noachian-era clay deposits [1, 2], a comparison of fractured terrains at Oxia and Gale Crater along with an analysis of Colour and Stereo Surface Imaging System (CaSSIS) [3] imagery are currently underway.
An analysis of fractured terrains is a useful tool for determining the history and material properties of Oxia, as the form a fracture network takes varies depending both on the mechanisms which generated it as well as the materials within which the fracturing occurred [4-6]. Comparisons between fractured terrains across Oxia, as well as with those at Gale crater due to the ground truth provided by the Curiosity rover, are being made. This is done in an effort to predict material properties and the fracture’s formation mechanisms, along with determining how fractures across Oxia relate to one another.
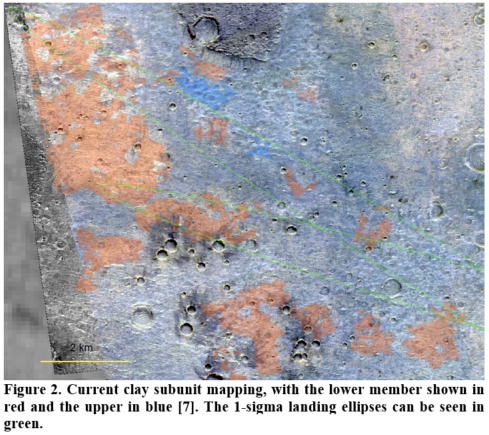
CaSSIS is a high-resolution (4.5 m/pixel) 4-band VNIR imager with the ability to take stereo images in a single pass of a target. From a study carried out using CaSSIS, along with co-analysis from CRISM and HiRISE colour imagery, two spectrally and morphologically distinct subunits of the Oxia clay unit [7] were identified. These were a lower member showing metre-scale fracturing and spectral signatures indicative of Fe/Mg-rich clay minerals, and an upper member showing decametre scale fracturing with Fe/Mg-rich clay mineral/olivine signatures. To expand upon the mapping carried out using HiRISE colour and CRISM data, which was limited by data coverage [7], CaSSIS and HiRISE RED i.e. greyscale imagery, was used to identify these sub-units. This was done to aid future planning of rover traverses to high priority surface targets.
Methods:
Fracture Analysis. Our fracture analysis involves tracing out a given fracture network in HiRISE imagery using ArcGIS, then using a tool developed at the Open University (as seen in [8]) to measure metrics of the fractures or the polygons formed by them, such as the angle between intersecting fractures, polygon area, etc. These were then mapped out for comparison using Kernel Density Estimation (KDE) diagrams, and compared statistically via two-sample Kolmogorov-Smirnov tests.
CaSSIS mapping. Radiometrically and geometrically corrected images are initially band ratioed and combined into an RGB image, allowing CaSSIS images to distinguish between ferrous and ferric minerals [9]. This is important given that the lower clay unit has a ferric component potentially due to the presence of hematite/ferric oxides [2], in contrast to the ferrous component of the upper member due to containing olivine [7], making the two members distinguishable with CaSSIS.
The band ratios (BR’s) used were NIR/PAN, PAN/BLU and PAN/NIR, with CaSSIS’s RED channel replacing its NIR depending on which was available from a given CaSSIS image [10]. These are sensitive to ferric and ferrous minerals for the former two and latter one respectively. Dark Subtraction [11] was then applied to minimize the effects of dust-derived atmospheric scatter. These images were used in conjunction with assessment of fracture length using HiRISE imagery to map out the two members. It has previously been identified [7, 12] that high dust opacity at the time of imaging likely skews the apparent ferric content of the image. This has been noted and is addressed via repeat imaging of such affected areas over Oxia Planum.
Results:
Fracture Analysis. The Gale sites which have comparable metric distributions to those at Oxia are the NE section of Yellowknife Bay’s Sheepbed member [13], which has similarities to several sites seen in the centre of the Oxia landing ellipses, and a site at Vera Rubin ridge similar to an area adjacent to Coogoon Vallis in the SE of Oxia Planum and another abutting the capping unit in the centre of the landing ellipses. Both of these are at the 2-sigma level of certainty for the majority of the metrics. See Figure 1 for examples of the KDE graphs used.
CaSSIS mapping. Figure 2 shows the current extent of the mapping within the 1-sigma landing ellipses at Oxia. There are fewer upper member exposures in the area mapped in fig.2, in line with what has been identified previously [7].


Discussion:
Fracture Analysis. While the results from this study show that there are similarities between some of the fractured terrains examined at Oxia Planum and Gale Crater, what the shared properties of these sites are that leads to these similarities is still being considered. Possibilities include possessing a similar grain size, or sharing the same formation mechanism such as hydraulic fracturing [1].
CaSSIS mapping. Mapping is ongoing for the 1-sigma landing ellipses, with the intention for it to cover the 3-sigma ellipses ultimately. That the map utilises distinctly lower resolution colour imagery of CaSSIS in conjunction with the 0.25 m/pixel HiRISE imagery for observation of fracturing raises the issue of misidentification of the two units where they are in close proximity. Pan-sharpening is being investigated as a solution to this; currently work is ongoing to remove artifacts within the generated products prior to their use in future mapping efforts.
References: [1] Quantin-Nataf C. et al. (submitted in Astrobiology), [2] Carter et al. (in prep), [3] Thomas et al. (2017) SSR 212, [4] Tang C-S. at. al. (2011) Geoderma, 166(1):111-118, [5] Plummer P. S. et. al. (1981) JSP, 51:1147-1156, [6] Goehring L. et. al. (2010) SM, 6:3562-3567, [7] Mandon L. et al. (submitted in Astrobiology), [8], Brooker L. M. et al. (2018) Icarus 302:386-406 [9] Tornabene L. L. et al. (2018) SSR, 214, [10] Tornabene L. L. et al. (2019) LPSC 50, Abstract #2678, [11] Chavez et al., (1988), RSE, 24.3: 459-479, [12] Parkes Bowen A. et al. (2020) BPSC #2, [13] Grotzinger J. P. et al. (2014) Science, 343:6169
How to cite: Parkes Bowen, A., Mandon, L., Bridges, J., Quantin-Nataf, C., Tornabene, L., Page, J., Briggs, J., Thomas, N., and Cremonese, G.: Using band ratioed CaSSIS imagery and analysis of fracture morphology to characterise Oxia Planum’s clay-bearing unit , Europlanet Science Congress 2020, online, 21 Sep–9 Oct 2020, EPSC2020-877, https://doi.org/10.5194/epsc2020-877, 2020.
Introduction: Oxia Planum (OP) is the selected landing site for the ESA-Roscosmos ExoMars Programme’s 2022 mission (Figure 1). The descent module and landing platform, Kazachock, will transport the Rosalind Franklin Rover to OP. With the primary goal of searching for signs of past and present life on Mars, Rosalind Franklin will investigate the geochemical environment in the shallow subsurface [1].
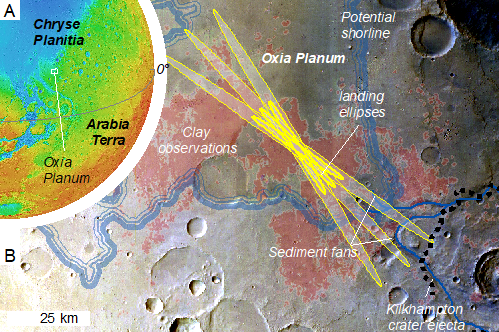
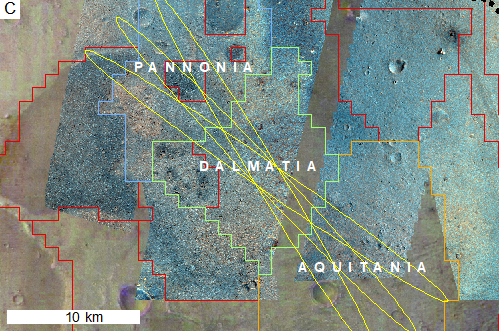
Figure 1: A) Locations of OP on (A) Mars and (B) in Arabia Terra. Phyllosilicate detections are in red [2]. Estimated/study landing ellipses are in yellow. -3000 m contour is shown in blue. Fluvial channels and sediment fan remnants are evident. C) Designation of mapping ‘Areas’.
Oxia Planum: OP lies at the transition between the ancient terrain of Arabia Terra and Chryse Planitia (Figure 1). OP forms a shallow basin, open to the north, characterized by clay-bearing bedrock, and contains units from ~mid-Noachian to ~early-Amazonian in age [3, 4]. There have been at least two distinct phases of aqueous activity within the landing site area. A first phase during the mid-Noachian (estimated age is 4.0 Ga) resulted in ~100 m of layered clay-rich deposits. These comprise Mg/Fe smectites overlain by more Al-rich materials. After a substantial hiatus the second phase of aqueous activity included a fluviodeltaic system. This fluvial activity post-dates the clay-rich layered unit, and is associated with the younger set of channels in Coogoon Vallis, which feeds into the Oxia basin. There is abundant evidence for intense erosion across OP. There are isolated buttes, perhaps remnants of a once-extensive layer that superposed the clay-bearing unit, and a dark, mafic-rich, resistant unit of Amazonian age (<3 Ga) that crops out in association with inverted landforms. Despite this erosion, crater statistics indicate that the clay-bearing rocks are Noachian in age, but have constantly been denuded. This supports the hypothesis that potential shallow subsurface organic biomarkers may have experienced low damage from exposure to cosmic radiation.
High resolution mapping campaign: Gaining a thorough understanding of the OP landing site prior to operations will provide testable hypotheses that facilitate interpretation of results, and hence provide an effective approach to address the mission’s science objectives. In pursuit of this, the ‘Macro’ sub-group, part of the Rover Science Operations Working Group (RSOWG), has been tasked to perform a detailed group mapping exercise of the OP landing site. The work prioritizes the area of highest estimated landing probability, but incorporates interpretations from elsewhere in the wider landing ellipse envelope and beyond. Complementary CTX scale mapping covers the wider area around the landing site and is described elsewhere [5]. The objectives of the campaign include to: (1) Provide a detailed geospatial dataset comprising mapped photo-geologic units, potential science targets, and surface features at OP. Via a follow-on reconciliation phase, and incorporating additional information from orbital or analogue data, a morpho-stratigraphic map of the landing site will be produced. (2) Familiarize scientists from across the different instrument teams and disciplines represented on RF with the geology and geography of the landing site in anticipation of rover operations. (3) Using the detailed scientific understanding enabled by the map, and elaborating on work completed during the landing site selection process, develop testable hypotheses that will (i) link mission-level science objectives to specific activities in the rover mission science operations strategy, and (ii) provide a basis for fine detail ‘rapid reconnaissance’ mapping (e.g. [6]) done after landing, when the precise location of the rover is established.
Schedule and Organisation: The campaign coordination/leadership team begun planning in Q4 2019 and team mapping exercise began in Q3 2020 with reconciliation underway in Q4 2020 (Figure 2). We use a grid of 1×1 km ‘quads’ to cover the estimated 3-sigma landing ellipse envelope (Figure 3). Of these, ~150 quads cover the 1-sigma estimated landing ellipse envelope, which we divide into 3 ‘Areas’ informally referred to as Pannonia, Dalmatia and Aquitania. 88 individuals associated with RSOWG who volunteered to map, are assigned quads amongst these Areas. Mapping is intended to be completed by August 2020.

Figure 2: Mapping campaign timeline and phases.
Data and Tools: The Multi-Mission Geographic Information System (MMGIS) [7] provides capabilities for group mapping and centralised data management for this project. An enhancement to MMGIS with additional functionality for geospatial analysis and mapping was developed for the NASA Mars 2020 Rover mission. We have deployed an instance of this tool at ESA ESTEC to facilitate group mapping. Volunteers map on a HiRISE orthorectified image and DTM mosaic. These data are co-registered with a CTX DTM and orthomosaic, which in turn are georeferenced to the HRSC MC11W mosaic [8]. In the mapping phase, many users concurrently map geologic contacts and surface features in their assigned quads. During the reconciliation phase, a smaller team is responsible for reconciling the maps produced by volunteers over all quads. The map data output are planned to be published and made accessible to the community.
Results: At the time of abstract submission the mapping phase is ongoing. Having successfully completed the initial training mappers are undertaking an ‘exploration phase’ in which they discover the contents of their quads to refine an overall geological unit definition to be used during the mapping phase. We present the preliminary mapping results and a status of the project, and provide an outlook towards publication of the map as a community resource, and for use in continued development of the ExoMars 2022 Mission science operations strategy.
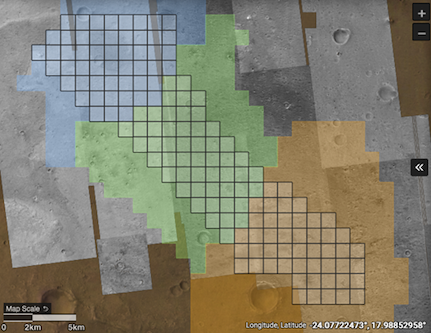
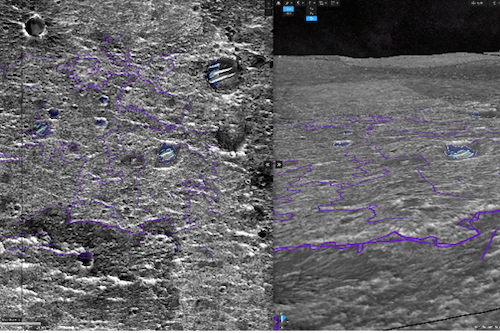
Figure 3: Left – Distribution of quads and areas in MMGIS. Right – example terrain and mapping in MMGIS: HiRISE ESP_039299_1985.
References
How to cite: Sefton-Nash, E., Balme, M., Quantin-Nataf, C., Fawdon, P., Volat, M., Hauber, E., Orgel, C., Frigeri, A., Le Deit, L., Ruesch, O., Adeli, S., Loizeau, D., Davis, J., Grindrod, P., Nass, A., de Witte, S., Calef, F. J., Soliman, T. K., and Vago, J. L. and the ExoMars Rover Science Operations Working Group (RSOWG) Macro Mapping Team: HiRISE-scale characterization of the Oxia Planum landing site for the Exomars 2022 Mission, Europlanet Science Congress 2020, online, 21 Sep–9 Oct 2020, EPSC2020-978, https://doi.org/10.5194/epsc2020-978, 2020.
Introduction: The ExoMars 2022 Rosalind Franklin rover is scheduled to be launched in summer 2022 with a suite of instruments to investigate the Martian surface and near sub-surface [1]. The context instruments: the Panoramic Camera (PanCam), composed of the two Wide Angle Cameras (WACs), and High Resolution Camera (HRC), and the Infrared Spectrometer for ExoMars (ISEM) will be imperative in the selection of drill and analysis sites. The PanCam stereo imaging system will be the primary mode of scientific observation during the mission with two multispectral WACs in the Visible to Near Infrared (VNIR, 440-1000 nm) range mounted at the top of the 2 meter mast [2]. Within the 36° field of view of the PanCam WACs, HRC will provide 5° field of view colour images at up to submillimetre resolutions [2]. Lastly, ISEM can them be utilised within the WAC/HRC field of views to provide 1° spot size, hyper-spectral coverage in the Near to Mid (1150-3300 nm) Infrared range [3]. In preparation for the mission, spectral analysis tools are being developed to automate as much of the analysis process as is feasible to reduce time and effort costs during mission tactical planning and analysis, as well as improving ability to discriminate between different minerals of interest. Here we report on our effort to constrain the spectral and spatial response of the context instruments for ExoMars using Martian meteorite targets
Martian Meteorite Imaging: This study used instruments emulators for PanCam WAC, ISEM (extended to 300-2500 nm range to provide coverage of PanCam filter wavelengths for comparison) and HRC to investigate the spectral response of a variety of SNC meteorites, to determine the instrument spectral and spatial capabilities and build reliable mission analysis tools. Preliminary analysis has been undertaken on the largest of the Martian meteorite samples. Meteorites were imaged at minimum mission configuration, in semi-directional lighting and operated under mission-similar protocols [2]. The Shergottite Tissint, BM2012, M1, was imaged to assess the instrument ability to distinguish visual and spectral features in the fresh face of the specimen. The PanCam emulator data was first flat-fielded, and environmentally colour corrected and radiometrically corrected using the ExoSpec Software developed by the PanCam science team [4].
Preliminary Results. The fresh face of Tissint is comprised of olivine macrocrysts with black glass veins [5]. These features can be distinguished visually in both the WAC and HRC images (Figure 1). These features, however, are too small to target alone with the hyperspectral instrumentation. To probe the spectral response of these regions a 530-570-670 decorrelation stretch was applied to highlight variation associated with a characteristic olivine spectral feature in this region, shown in Figure 2. This decorrelation stretch does show significant spectral variation between the dominant face material and the black glass veins.
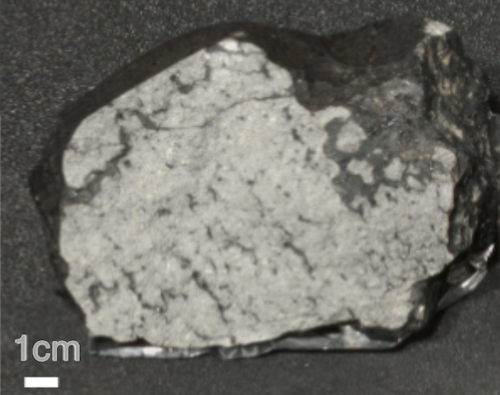
Figure 1. Tissint BM.2012,M1, (Left) RGB imaged with RWAC PanCam emulator at 2m. (Right) Colour imaged with HRC emulator at 2 m.
The spatial resolution difference in the instrument, an order of five times higher for HRC at this distance, is clear. The multispectral data show a similar shape profile to the hyper-spectral data set over approximately the same region of interest (ROI) figure 3 with an offset in reflectance due in part to the instrument’s throughput of the different narrow band filters [6], shown in Figure 3. A contribution could also be present from the viewing angle of the sample versus the target, hence surface corrections will also be investigated in this instance. To further aid in the detection of minerals of interest, the hyperspectral data will be utilised to develop a spectral parameter map to target olivine. This map will then be tested on the Tissint WAC images to evaluate the information yield.
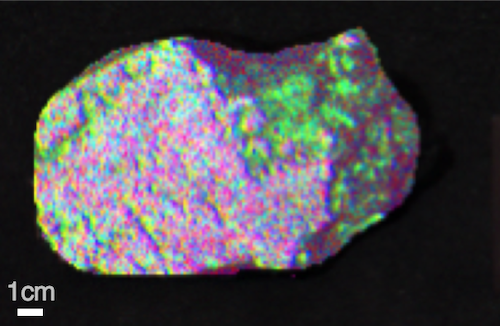
Figure 2. Tissint BM.2012,M1, LWAC with decorrelation stretch applied at 530-570-670 (represented as red, green and blue respectively).
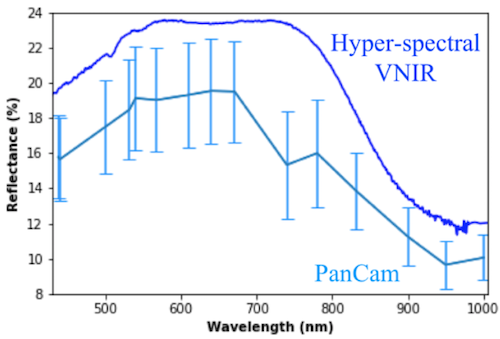
Figure 3. Tissint BM 2012,M1, VNIR reflectance spectra from PanCam and ISEM emulator, reflectance offset cause by the filter throughput and anomaly at 740nm where WAC transition occurs [4], (inset) Tissint BM2012, M1 with PanCam and Hyperspectral ROI.
Following the completion of the Tissint, the type specimens of the SNC group: Nahkla BM1913,26, Shergotty BM 41021 and Chassigny BM 1985M173, (Figure 4) will then be investigated to compare the spectral properties of the samples and the instrument ability to discriminate between them. This will inform mission processing while analysing a target against the Martian surface.
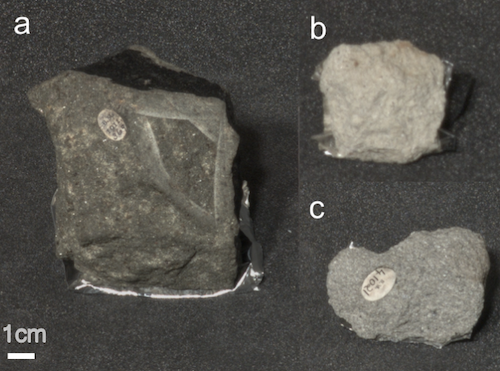
Figure 4. HRC colour images of other target Martian SNC’s (a) Nahkla BM 1913,26, (b) Chassigny BM1985M173 (c) Shergotty BM 41021 at 2m distance.
Further Meteorite Imaging: Iron, pallasite and chondritic meteorites have also been imaged to add variety to the spectral sampling pool. As well as in the interest of the instrument spectral and spatial response, meteorite finds on Mars have been a rising topic of interest [7], they represent an interesting avenue to study questions of habitability beyond earth [8, 9]. We also aim to develop methods of identifying meteorite targets on Mars from spectral and visual feature detection for the ExoMars instrument pipelines.
References: [1] Vago J. L. et al. (2017) Astrobiology, 17, 471-510 [2] Coates A. J. et al. (2017) Astrobiology, 17, 511-541. [3] Korablev O. I. et al. (2017) Astrobiology, 17, 542-564. [4] Allender E. J. et al. (2018) Image and Signal Processing for remote sensing XXIV, 10789, 1078901. [5] Chennaoui Aoudjehane H. et al. (2012) Science, 338, 6108, 785-788. [6] Cosuins. C. R. et al. (2012) Planetary and Space Science, 71, 80-100. [7] Ashley J. W. (2015) CosmoELEMENTS, 10-11 . [8] Schröder C. et al. (2016) Nature communications, 7, 13459. [9] Tait. A. W. (2019) LPSC L, #1387.
How to cite: Motaghian, S., Grindrod, P. M., Stabbins, R. B., Allender, E. J., Cousins, C. R., Gunn, M. D., Ladegaard, A., and Balme, M. R. and the The PanCam Science Team: A First Look at Mars with PanCam: ExoMars 2022 Spectral Instrument Suite Emulator Observations of Martian Meteorites, Europlanet Science Congress 2020, online, 21 Sep–9 Oct 2020, EPSC2020-1122, https://doi.org/10.5194/epsc2020-1122, 2020.
1. Introduction
Mars orbiters have detected different sulfates in the new landing sites of the upcoming Mars missions, Jezero crater (Mars2020) [1] and Oxia Planum region (Exomars2022) [2]. Both missions incorporate the Raman instrument to study the mineral phases in the planet, but the Raman Laser Spectrometer (RLS) has the capability to spot at microscopic scale of 50 microns. Thus, the possibility to detect sulfate minerals with the RLS instrument in the drilled samples, taken at different depths in the Martian sub-surfaces, must be considered. The expected sulfate mineral phases could contain crystallized water, and it is known that hydrated compounds have Raman responses sensitive to the temperature, especially when decreasing [3] but also when increasing due to mineral transformations. For this reason, some Raman essays at different temperatures were made for the sulfates gypsum [CaSO4·2H2O], syngenite [K2Ca(SO4)2·H2O] and görgeyite [K2Ca5(SO4)6·H2O] at high and low temperatures.
2. Sample description
The samples gypsum, syngenite and görgeyite used were previously synthesized by García-Florentino et al. [4]. The gypsum and syngenite samples were obtained at room temperature by mixing the adequate liquids containing the ions at concentrations to attain saturation for each salt. Görgeyite was obtained by using hydrothermal conditions (90 ºC during 8 hours) with the appropriate ion concentrations.
3. Materials and Methods
The sulfate synthesized samples [4] were analyzed at spot sizes of 50 microns using a Renishaw inVia micro-Raman spectrometer, equipped with the 532 nm excitation laser and a highly sensitive CCD detector, with a mean spectral resolution of 1 cm-1. The spectrometer was coupled to a temperature-controlled stage THMS600/HFS600 Linkam Scientific Instrument (UK) for the automatic control of the measurement temperature. The high temperature program used consisted of an increment of 20 ºC.min-1 up to 400 ºC. Whereas the low temperature program consisted of a decrease of 10 ºC.min-1 up to -100 ºC. Each ramp was followed by a one-minute hold to allow the stabilization of the mineral phase under study. And the spectra were collected both at the end of the ramp and at the end of the hold
4. Results and Discussion
As a consequence of the temperature increase, the shift to lower or higher wavenumbers of the main Raman bands were observed in all the spectra. However, the drop in temperature did not cause any shift in the position of the sulfate Raman bands although changes in the form of the Raman bands were observed. Therefore, the following features were noted:
Gypsum. The transition from gypsum to anhydrite III (AIII) at a temperature of 180 ºC was observed. The transformation was detected by the shift of the 1008 cm-1 main Raman band to 1025 cm-1 and together with the disappearance of the hydration bands. The AIII form is metastable, reaching its stable form (Anhydrite II and I) above 800 ºC [5]. Although the AI/II could not be completely isolated because the experiment only reached 400 ºC, the presence of both compounds can be easily observed by a deconvolution of the main Raman band collected at 400 ºC, obtaining the bands at 1017 and 1025 cm-1, the main Raman bands of AI/II and AIII, respectively.
When temperature decreases, the Raman bands due to the sulfate modes do not change. However, the two water bands at 3405 and 3487 cm-1 change in shape (both are more thin when temperature increases) but not in the wavenumber of the maximum.
Syngenite. This compound is stable when temperature increases until 100 ºC where the transformation to soluble anhydrite starts. Anhydrite(III) was not obtained in pure form, suggesting a kinetic control of the dehydration process. Above 360 ºC the main Raman band of anhydrite I/II (1017 cm-1) is observed. In addition, from 380 ºC the 981 cm-1 and all the hydration bands disappeared, because the syngenite suffered the transformation to arcanite [K2SO4] and langbeinite [K2Ca2(SO4)3], which main Raman bands are located at 985 and 978 cm-1, respectively [6].
The temperature decrease do not affect the maximum of any bands of syngenite. However, the broad water band at room temperature is splitted in two bands at 3107 and 3298 cm-1 when temperature decreases below -40 ºC, being both more thinner when temperature continues decreasing.
Görgeyite. Above 160 ºC the görgeyite Raman band at 1012 cm-1 decreased, due to the fact that part of this sulfate was transformed to syngenite (980 cm-1) and gypsum (1007 cm-1). The corresponding bands due to the crystallized water also decreased.
The temperature decrease do not affect Raman bands related to sulfate modes, but the broad water band at room temperature splits at <-10 ºC, appearing two bands at 3527 and 3582 cm-1, being the second one less intense than the first, in the opposite trend to other compounds. Thus, although görgeyite was hydrothermally obtained, it is quite stable when temperature decreases at Martian levels.
5. Conclusions
The increase of temperature causes the shift of the main sulfate Raman bands to other wavenumbers due to the formation of other anhydrous mineral phases. Above 180 ºC the gypsum loses its water molecules, forming the different anhydrite. Whereas, syngenite decomposes to arcanite [K2SO4] and langbeinite [K2Ca2(SO4)3] while görgeyite decomposes first to gypsum plus syngenite and then follows the respective decomposition.
However, the effect of low temperature does not produce any change in that bands position although the water bands are more clearly observed.
6. References
[1] Salvatore, M. R., et al.: Bulk mineralogy of the NE Syrtis and Jezero crater regions of Mars derived through thermal infrared spectra analyses, Icarus, 301, 76-96, 2018.
[2] Dugdale, A., et al.: Development of Oxia Planum simulant relevant to the Exomars mission, 51th LPSC, Abs. 2590, The Woodlands(TX), 2020.
[3] Iriarte, L.M., et al.: Reference Raman spectra of synthetized CaCl2.nH2O solids (n=0, 2, 4, 6), J. Raman Spectrosc., 46, 822-828, 2015
[4] García-Florentino, C., et al.: Transformations in the Gypsum-Syngenite-Görgeyite system to describe their possible formation on Mars, Astrobiology, submitted, 2020.
[5] Prieto-Taboada, N., et al.: Raman Spectra of the Different Phases in the CaSO4-H2O System, Analytical Chemistry, 86, 10131-10137, 2014.
[6] Chung, C-W. and Lee, J-Y.: Premature Stifferning of Cement Paste Caused by Secondary Gypsum and Syngenite Formation (False Set), Architectural Research, 13, 25-32, 2011
How to cite: Madariaga, J. M., Huidobro, J., García-Florentino, C., Aramendia, J., Ruiz-Galende, P., Torre-Fdez, I., Hausrath, E. M., Castro, K., and Arana, G.: Temperature transformation of calcium and potassium Martian sulfates as seen by an Exomars 2022 RLS-like Raman instrument, Europlanet Science Congress 2020, online, 21 Sep–9 Oct 2020, EPSC2020-1063, https://doi.org/10.5194/epsc2020-1063, 2020.
1. Introduction
Martian meteorites are, by the moment, the only Martian samples than can be studied in Earth laboratories. The minerals in Martian meteorites contain information about (a) alteration processes suffered in the Martian surface, (b) due to the shock event that sent Martian materials to the space, (c) originated from pressure and thermal transformation during entry and (d) due to the terrestrial weathering processes after its landing. Thus, any Martian meteorite could have signals of these four alteration processes.
The studies of meteorites make use of microscopic techniques. Among such techniques, Raman micro-spectroscopy is becoming more and more used due to its versatility to detect both crystalline and amorphous minerals at the micrometric level. The RLS (Raman Laser Spectrometer) instrument on board Rosalind Franklin rover of the Exomars 2022 mission has such micrometric capability to study the drilled samples, at 50 microns of spot size.
This work compares the capability of a RLS-like Raman instrument (532 nm continuous excitation laser, focusing at 50 microns), and a High Resolution Raman micro-spectrometer, to detect mineral assemblages in the Dar al Gani 735 Martian meteorite (DaG 735), an olivine-phyric Shergottite with olivine/pyroxene “megacrysts” [1]. The aim is to identify terrestrial and non-terrestrial alterations suffered by the meteorite. Dar al Gani 735 was selected due to the size of individual crystals [1], the presence of large pockets of brownish-colored recrystallized impact glass associated with pyroxene and olivine [3], and the absence of fusion crust but presence of weathering compounds [2].
The Dar al Gani paired Martian Meteorites were ejected from the parent body 1.18 ± 0.17 My ago while the terrestrial age is estimated around 60 ± 20 ky. The isotopic compositions of Sm and Gd suggest a mixing between basaltic lava and regolith to form the bulk of the ejected material [3]. The large amount of literature information about the DaG 735 and paired meteorites [4-10] gave us the basic knowledge to first confirm the positive identification of the referred mineral phases with a HR Raman micro-spectrometer. Then, the RLS-like instrument [11] will tell us which, of the minerals detected with the HR system, could be detected at the 50 microns of spot size
2. Experimental
An InVia micro-Raman instrument, provided with 532 nm excitation lasers and Peltier cooled CCD detector (-70ºC) was used as the HR Raman instrument; details of the working conditions are given elsewhere [12]. The RLS-like instrument used was a BWTek 532 Raman spectrometer, equipped with an objective to focus at 50 microns. Both spectrometers were daily calibrated with the 520.5 cm−1 silicon line. The results were interpreted by comparing the collected Raman spectra with Raman spectra of pure standard compounds.
3. Results and Discussion
The analysis showed the main matrix of pyroxene (clinopyroxenes like diopside-hedenbergite, CaMgSi2O6, or augite, CaMgFe)2Si2O6, and ortopyroxene like enstatite, MgSiO3) with olivine megacrysts (different ratios between forsterite, Mg2SiO4, and fayalite, Fe2SiO4) together with a remarkable presence of chromite (FeCr2O4) were detected as reported in literature [4-6].
The analysis on cracks/veins shown the largest fractures filled with calcite as a terrestrial weathering compound. Others were filled with hematite (Fe2O3) coming from terrestrial weathering of the original Fe-bearing minerals
Apart from the high Ca presence in fractures, the Raman spectrum of the calcite crystals in the bulk shown displaced bands at 1088, 714, 283 and 157 cm-1, belonging to shocked calcite. Suggesting these calcite crystals as original from Mars altered by the shock effect that formed the meteorite.
Relatively high size crystals of β-anhydrite were detected. This β-anhydrite cannot be assigned to terrestrial weathering because high temperature (>300oC) is required for its formation. As gypsum changes to β-anhydrite under high pressure (> 2.56 GPa) and temperatures (> 583 K), the source of this β-anhydrite could be shocked original gypsum.
Ilmenite (Fe2+Ti4+O3) was also detected but at higher wavenumbers, 686, 230 and 375 cm-1, than terrestrial ilmenite, suggesting again the effect of high pressures to which this ilmenite was subjected (estimation of 18 GPa with the 686 cm-1 band or 14 GPa with the 230 cm-1 one) during the shock event.
The identification of anatase is also important to be highlighted. In terrestrial environments, the occurrence of anatase is indicative of low-temperature aqueous alteration, probably from the oxidation of the Fe(II) in ilmenite to form irreversibly hematite and anatase.
All these mineral phases were also detected with the RLS-like Raman spectrometer, suggesting that RLS on board the Rosalind Franklin rover could not only detect mineral but most interestingly all the mineral phases related to aqueous driven alteration processes occurred in Mars.
4. Conclusions
The characterization of the DaG 735 meteorite with a HR Raman micro-spectrometer was successful because not only the expected mineral phases were detected but also new minerals identified. In particular, Raman spectroscopy was able to detect shocked calcite, anhydrite and ilmenite. Also alterations due to weathering were detected in enough amount as to be also identified by the RLS-like Raman instrument. This provides information about the future data that will be sent by the Raman technique implemented on the Rosalind Franklin rover (Exomars2022 mission from ESA), for the new explorations of Mars materials.
5. Acknowledgements:
This work was financed by the Ministry of Economy and Competitiveness (MINECO, grants ESP2014-56138-C3-2-R and ESP2017-87690-C3-1-R). The authors gratefully acknowledge the support of the SIGUE-Mars consortium (MINECO, grant RDE2018-102600-T).
6. References
[1] Grossman J.N. (2000), Meteorit. & Planet. Sci. 35, A199-A225.
[2] Meyer C., The Martian Meteorite Compendium, 2012, NASA Antarctic Meteorite Program (updated and revised by Righter K., 2017)
[3] Hidaka H. et al. (2009), Earth Planet. Sci. Let., 288, 564-571
[4] Zipfel J. et al. (2000), Meteorit. & Planet. Sci. 35, 95-106.
[5] Mikouchi T.et al. (2001), Meteorit. & Planet. Sci. 36, 531-548.
[6] Folco L. and Franchi I.A. (2000), Meteorit. & Planet. Sci. 35, A54-55.
[7] Wadhwa M.et al. (2001), Meteorit. & Planet. Sci. 36, 195-208.
[8] Borg L.E. et al. (2003), Geochim. Cosmochim. Acta 67, 3519-3536.
[9] Miyaharaa M. et al. (2011), Proc. Nat. Acad. Sci., 108, 5999-6003
[10] Schlüter J. et al. (2002), Meteorit. & Planet. Sci. 37, 1079-1093.
[11] Lopez-Reyes G. (2013), Eur J Mineral. 25, 721-733
[12] Aramendia J. et al. (2018), Trends Anal. Chem., 98, 36-46
How to cite: Madariaga, J. M., Garcia-Florentino, C., Torre-Fdez, I., Ruiz-Galende, P., Huidobro, J., Aramendia, J., Castro, K., Arana, G., Fdez-Ortiz de Vallejuelo, S., and Maguregui, M.: Study of Alterations in the Dar al Gani 735 Martian Meteorite studied by Exomars2022 RLS-like Instrument and HR Raman, Europlanet Science Congress 2020, online, 21 Sep–9 Oct 2020, EPSC2020-1090, https://doi.org/10.5194/epsc2020-1090, 2020.
NASA/Mars 2020 [1] and ESA/ExoMars [2] missions are scheduled to be launched in 2020 and 2022 respectively. For the first time in history, the analytical payload of both exploration rovers will be equipped with Raman systems that will work in combination with complementary spectroscopic techniques such as LIBS and NIR. Prior to science operations, detailed laboratory investigations are necessary to constrain the potential scientific outcome of Raman spectrometers, as well as to facilitate the comprehension of the advantages provided by combined Raman/LIBS (e.g. the SuperCam analytical suite [3] onboard the Perseverance rover) and Raman/NIR (as is the case of ExoMars RLS [4] and MicrOmega coordinated studies) analysis.
In this framework, beside coordinating the development of Mars 2020/SuperCam Calibration Target (SCCT) and ExoMars/Raman Laser Spectrometer (RLS), the ERICA research group is developing novel tools that are meant to facilitate both science operation teams in the analysis and interpretation of the spectroscopic data soon gathered from Mars. As such, the three main tools under development are presented below:
- 1) Planetary Terrestrial Analogue Library (PTAL)
Funded by the European Research Council through the H2020-Compet-2015 programme (grant 687302), the Planetary terrestrial analogue library (PTAL) project will provide science operation teams (and, in a broader extent, the whole scientific community) with free access to an extended multi spectral database of terrestrial analogues materials that have been selected basing on their congruence to well-known Martian geological and environmental contexts [5]. Through the collaboration of the Universities of Valladolid (UVa, Spain), Oslo (UiO, Norway) and Paris-Sud (UPSud, France) the PTAL database will offer Raman, LIBS, NIR and XRD data collected from 1) natural geological samples collected from terrestrial analogues sites and 2) artificial samples replicating Martian protoliths composition and altered in the laboratory under controlled physical-chemical conditions. Beside the use of conventional laboratory instruments, the mineralogical and geochemical composition of PTAL samples is characterized by means of spacecraft derived instrumentation, as is the case of the RLS ExoMars Simulator, MicrOmega and ChemCam spare models. Furthermore, the PTAL platform will provide the opportunity to request physical access to Martian analogue materials thus enabling future users to combine PTAL spectroscopic data with further laboratory analysis.
- 2) Analytical DAtabase of Martian Minerals (ADAMM)
Complementary to PTAL, the ADAMM database will include diffractometric (XRD) and spectroscopic (Raman, NIR, LIBS) data from a wide collection of pure mineral phases that have been detected on Mars by orbital and on-ground analytical systems, as well as from the laboratory study of Martian meteorites. Financed by the Ministry of Economy and Competitiveness (MINECO, grant ESP2017-87690-C3-1-R) the ADAMM database also includes additional phases that, according to the modern knowledge about the geological evolution of Mars, are most likely to be present at the (sub)surface of the red planet. As such, over 300 specimens are being analyzed using both commercial and spacecraft derived instrumentations. Besides the previously mentioned RLS ExoMars Simulator, mineral samples will be also analyzed by means of SimulCam, a remote Raman/LIBS system recently developed by the ERICA research group to reliably simulate SuperCam analytical outcomes. After comparing ADAMM database with the mineralogy detected from orbit at Jezero Crater and Oxia Planum (the landing site for Mars 2020 and ExoMars missions, respectively) a more detailed analysis of selected samples will be carried out. Thus, complementary analysis will be performed in the framework of the SIGUE-Mars consortium by using additional instruments (including the RLS spare model), and under Martian conditions (temperature and atmospheric pressure). In this way, a reliable estimation of the potential scientific outcome of the forthcoming rover missions to Mars will be provided.
- 3) IDAT/SpectPro
The Instrument Data Analysis Tool (IDAT)/SpectPro software was developed by the University of Valladolid to receive, decodify, calibrate and verify the telemetries generated by the RLS instrument on Mars [6]. IDAT/SpectPro is able to open and process data in PDS4 format, as required by the ExoMars mission. In this way, as soon as the data from the processors is available, IDAT/SpectPro will automatically process it to obtain science and engineering (housekeeping) calibrated data and even generate autolooks.
IDAT/SpectPro also provides access to an extended set of analytical tools for spectral analysis such as labelling, trimming, shifting, normalization, baseline correction, and features a general-purpose spectrum calculator to perform lineal combinations, product, division and derivative of spectra. An automated identification algorithm to classify Raman spectra is also under development. This algorithm is based on the comparison of peak positions and intensities, which has provided good results, even for the detection of all samples present in simple mixtures.
The mentioned analytical tools will be made available to PTAL and ADAMM users through a dedicated version of IDAT/SPectPro software, which will have a direct interface to access the two databases.
Acknowledgements:
This work is financed through the European Research Council in the H2020- COMPET-2015 programme (grant 687302) and the Ministry of Economy and Competitiveness (MINECO, grant ESP2017-87690-C3-1-R). The authors gratefully acknowledge the support of the SIGUE-Mars consortium (MINECO, grant RDE2018-102600-T).
References:
[1] Williford, K. H. et al. From Habitability to Life on Mars (Elsevier Inc., 2018). [2] Vago, J. L. et al. Astrobiology 17, 471–510 (2017). [3] Wiens, R. C., Maurice, S. & Perez, F. R. Spectrosc. (Santa Monica) 32, 50–55 (2017). [4] Rull, F. et al. Astrobiology 17, 627–654 (2017). [5] Veneranda, M. et al. J. Raman Spectrosc. 50, 1–19 (2019). [6] Lopez-Reyes G. et al. European Planetary Science Congress 2018 12 1–2 (2018).
How to cite: Veneranda, M., Saiz, J., Lopez-Reyes, G., Manrique, J. A., Sanz Arranz, A., Garcia-Prieto, C., Werner, S. C., Moral, A., Madariaga, J. M., Medina, J., and Rull, F.: PTAL, ADAMM and SpectPro: novel tools to support ExoMars and Mars 2020 science operations, Europlanet Science Congress 2020, online, 21 Sep–9 Oct 2020, EPSC2020-1018, https://doi.org/10.5194/epsc2020-1018, 2020.
Please decide on your access
Please use the buttons below to download the presentation materials or to visit the external website where the presentation is linked. Regarding the external link, please note that Copernicus Meetings cannot accept any liability for the content and the website you will visit.
Forward to presentation link
You are going to open an external link to the presentation as indicated by the authors. Copernicus Meetings cannot accept any liability for the content and the website you will visit.
We are sorry, but presentations are only available for users who registered for the conference. Thank you.