Europlanet Science Congress 2021
Virtual meeting
13 – 24 September 2021
Europlanet Science Congress 2021
Virtual meeting
13 September – 24 September 2021
OPS3
Ice Giant System Science and Exploration

OPS3

Ice Giant System Science and Exploration
Co-organized by MITM
Convener: David H. Atkinson | Co-conveners: Sushil K. Atreya, Thibault Cavalié, Leigh Fletcher, Mark Hofstadter, Jean-Pierre Lebreton, Kathleen Mandt, Olivier Mousis, Alena Probst
Thu, 16 Sep, 16:15–17:00 (CEST)

Session assets

Discussion on Slack

Oral and Poster presentations and abstracts

Chairpersons: Leigh Fletcher, Sushil K. Atreya, Thibault Cavalié
EPSC2021-39
Leigh Fletcher, Heidi Hammel, Stefanie Milam, Imke de Pater, Thierry Fouchet, Glenn Orton, Michael Roman, Naomi Rowe-Gurney, Henrik Melin, Michael Wong, Patrick Fry, Arrate Antuñano, Ricardo Hueso, Matthew Tiscareno, Patrick Irwin, Julianne Moses, Bryan Holler, John Stansberry, and Alistair Glasse

1. Overview

The James Webb Space Telescope (JWST) will be the premier observatory for infrared planetary science over the coming decade, revolutionising our views of cold, distant targets that have remained out of reach to ground-based facilities.  For planetary atmospheres, JWST offers an unprecedented opportunity to explore the weather and climate in three dimensions, from the turbulent cloud layers to the chemically-rich stratospheres, via spatially-resolved spectroscopic mapping in the 1-30 µm range.  This presentation will summarise the JWST Giant Planet Atmospheres programme during the first year of science operations (Cycle 1, 2022-23), which is set to observe all four giants.  These observations have been made possible by a combination of Guaranteed-Time Observing (GTO), Early Release Science (ERS), and General Observing (GO), and their combination permits comparative planetology of the Gas and Ice Giants.  This presentation will: (i) summarise the science goals at each planet; (ii) discuss the available toolkits for data reduction, mapping, and spectral interpretation; and (iii) advocate for a ground-based campaign to support the JWST observations.


2. Giant Planet Observations

Ice Giants: Uranus and Neptune

Comparing the atmospheric dynamics and chemistry of Uranus and Neptune will provide new insights into the processes shaping intermediate-sized and chemically-enriched worlds.  Voyager’s infrared observations were largely limited to the far-IR, and despite recent advances in ground-based observations (Fletcher et al., doi:10.1016/j.icarus.2013.11.035, Roman et al., doi:10.3847/1538-3881/ab5dc7) and disc-integrated spectroscopy (Orton et al., doi:10.1016/j.icarus.2014.07.010; Rowe-Gurney et al., doi:10.1016/j.icarus.2021.114506), Ice Giant stratospheres have remained largely inaccessible.  JWST MIRI 5-28 µm spectroscopic maps of Uranus (GTO1248) and Neptune (GTO1249) will reveal spatial gradients of temperature and chemicals, to diagnose the circulation and chemistry of Ice Giant stratospheres for the first time (Moses et al., doi:10.1016/j.icarus.2018.02.004), and link it to meteorological activity in the troposphere.  Simultaneous NIRSPEC 2-5 µm spectroscopy of Uranus (GTO1248) will reveal aerosol structures in the troposphere, and H3+ emission in the ionosphere.  Both Uranus and Neptune will be observed several times over a full rotation to construct global maps.  MIRI observations of Neptune will be repeated when the Ice Giant returns to the Field of Regard (FoR), to search for the sources of temporal variability of mid-IR emission (Roman et al., EPSC2021) over timescales of months (GO1604).

Expected dates: Uranus window 1 (2022-08-05 to 2022-09-26), Uranus window 2 (2022-12-22 to 2023-02-09), Neptune window 1 (2022-06-11 to 2022-08-02), Neptune window 2 (2022-10-31 to 2022-12-19).


Gas Giants:  Jupiter and Saturn

The Gas Giants provide a crucial test of JWST’s capabilities to explore extended, rotating, moving, and bright targets.  Indeed, the angular sizes of Jupiter and Saturn means that mosaics are required to map atmospheric regions of interest, and the high surface brightness means that MIRI observations are expected to saturate beyond 11 µm (Jupiter) or 16 µm (Saturn).  On Jupiter, we have selected two scientific targets:  the Great Red Spot will be targeted via mosaics with MIRI (5-11 µm, GTO1246) and NIRSpec (1-5 µm, ERS1373), to understand how the circulation of this archetypal anticyclone influences its temperatures, composition (e.g., ammonia as a cloud-forming volatile, phosphine as a tracer of vertical mixing), and aerosols.  Secondly, Jupiter’s south pole will be observed with NIRSpec and MIRI (ERS1373) to understand how energy propagates from the aurora (via H3+ emission) to the stratosphere (via methane emission).  ERS1373 will also use NIRCAM imaging (1-5 µm) to measure atmospheric motions at multiple levels in Jupiter’s clouds and tropospheric hazes.  For Saturn’s atmosphere, MIRI 5-16 µm spectroscopy (GTO1247) offers the opportunity to revisit the seasonally-evolving giant five years after the demise of the Cassini mission.  Saturn’s summertime hemisphere will be mapped from the pole to the equator, capturing the demise of the polar stratospheric vortex since summer solstice in 2017 (Fletcher et al., doi:10.1038/s41467-018-06017-3).  The atmospheric observations are part of wider programmes to capture MIRI, NIRSpec, and NIRCAM imaging of Jupiter and Saturn’s satellite and ring systems (GTO1247/ERS1373).  Finally, a target-of-opportunity programme (GO1424) will respond within 2 weeks to unforeseen extreme events on either Jupiter or Saturn, providing NIRSpec and MIRI spectroscopic maps of cometary or asteroid impact sites, or the eruptions of significant new storms.  In the event of a trigger, this would be repeated twice to capture the evolution of the feature.

Expected dates: Jupiter window 1 (2022-06-23 to 2022-08-15), Jupiter window 2 (2022-11-06 to 2022-12-27), Saturn window 1 (2022-05-10 to 2022-07-01), Saturn window 2 (2022-09-27 to 2022-11-16).


3. Data Analysis Toolkit

We will present the current status of data analysis tools:

  • Forward-Modelled MIRI spectra: the suite of radiative transfer and spectral analysis tools (NEMESIS, Irwin et al., doi:10.1016/j.jqsrt.2007.11.006) have been adapted to simulate MIRI 5-28 µm spectra in all 12 sub-bands (disperser, detector, and grating combinations), generating idealised synthetic cubes from temperature, composition, and aerosol maps from existing data and/or photochemical models (e.g., Moses et al., doi:10.1016/j.icarus.2018.02.004).
  • MIRI simulations: Synthetic spectra are passed to the MIRISim package to generate MIRI detector images, testing assumptions about exposure times, dither patterns, and background subtraction.  Detector images are them passed to the MIRI calibration pipeline, reconstructing MIRI cubes as if they were taken by the observatory.
  • Data processing: MIRI and NIRSpec spectral cubes are then passed through an image navigation pipeline to construct maps, so that multiple dithers/exposures can be coadded.
  • Spectral inversion: NEMESIS will then be used to assess retrievability of the original temperature, composition, and aerosol inputs, preparing the techniques required for the real data in 2022.


4. Ground-Based Support

Giant planet atmospheres evolve significantly with time, and spatial, temporal, and spectral context information will be required to fully exploit the JWST observations.  For example:  observations of Jupiter’s Great Red Spot will rely on precise positioning information in early 2022; spatial variations in thermal emission related to storms/vortices on each world will require visible-light context imaging; and candidates for impact events and significant storm eruptions will need to be rapidly assessed to determine the use of triggered observations.  We advocate for a programme of ground-based support, both from professional and amateur observers, in the times preceding the FoR windows specified above.  Amateur observers should continue to make use of the PVOL database (http://pvol2.ehu.eus/pvol2/) - see presentation by Hueso et al. (EPSC2021-80) for further details.

How to cite: Fletcher, L., Hammel, H., Milam, S., de Pater, I., Fouchet, T., Orton, G., Roman, M., Rowe-Gurney, N., Melin, H., Wong, M., Fry, P., Antuñano, A., Hueso, R., Tiscareno, M., Irwin, P., Moses, J., Holler, B., Stansberry, J., and Glasse, A.: The JWST Giant Planet Atmospheres Programme, Europlanet Science Congress 2021, online, 13–24 Sep 2021, EPSC2021-39, https://doi.org/10.5194/epsc2021-39, 2021.

EPSC2021-54
|
ECP
Gwenaël Milcareck, Sandrine Guerlet, Aymeric Spiga, Jérémy Leconte, Déborah Bardet, Franck Montmessin, and Alexandre Boissinot

Located at an average distance of 19 AU and 30 AU respectively from the sun, Uranus and Neptune are mysterious and hard-to-reach worlds. These two planets are characterized by low sunshine and long orbital periods and by very marked seasonal variations (especially for Uranus). Today, Voyager 2 is the only probe to have made a flyby of these two planets and it has revealed that these cold worlds have an intense atmospheric circulation [1,2]. Since then, other zonal wind measurements using cloud tracking have been carried out with the aid of Hubble Space Telescope and terrestrial observatories like the Keck observatory or the Very Large Telescope (see review by [3] and references therein). These measurements confirm and complement previous Voyager 2 observations: zonal flow over these planets is characterized by two prograde jets at mid-latitudes as well as a large retrograde jet at the equator. While the amplitude of the prograde jets is similar on the two planets (250 m/s on Uranus, 275 m/s on Neptune), that of the equatorial retrograde jet is different: it is -50 m/s on Uranus but reaches -400 m/s on Neptune.

Understanding the origin of these jets is one of the major current challenges in physics of planetary atmospheres. Furthermore, the impact of Uranus and Neptune different radiative forcings on their atmospheric circulation remains to be assessed. The weath of observations has motivated the need to develop models in order to better interpret these observations and to understand the processes that govern their atmospheric circulation.

Several models have attempted to explain the atmospheric circulation visible on the four giant planets. In the case of deep convection models, the equatorial sub-rotation could not be reproduced [4,5,6,7,8] except by greatly modifying the known internal heat flux, which is thus not satisfactory [9,10]. In the case of shallow-flow models, this equatorial sub-rotation could be reproduced if convective Rossby wave generation is weak or absent or baroclinic eddies generation is sufficiently strong [11] or by release of latent heat by the water vapor layer located at 200-300 bars [12]. However, the simulated jet speeds are too slow compared to observations. Furthermore, the radiative transfer was idealized as Newtonian cooling, and seasonal effects were ignored. Here, the objective is to apply a shallow-flow model which takes into account realistic physical parameterizations, to attempt to reproduce this circulation, to answer observational questions but also to determine the dynamical processes governing in these atmospheres.

Figure 1: Latitude-pressure cross-section of zonal-mean zonal wind of the third simulated year on Neptune from our preliminary results. A complex zonal structure is present in mid-latitudes and at equator but the zonal structure is still evolving because the radiative-convective equilibrium has still not been reached in the troposphere. Here, the retrograde equatorial stratospheric jet reaches -130 m/s.

We introduce the DYNAMICO-giant model which is a General Circulation Model (GCM) developed by the Laboratoire de Météorologie Dynamique (LMD), previously used for the atmospheres of giant planets [13,14,15,16]. The model is composed of a dynamic core which uses an icosahedral grid [17] and which is coupled to independent physical parameterizations such as a radiative transfer or convection. In this study, the radiative transfer module employs the correlated-k formalism. We take into account gaseous opacities from CH4, C2H2 and C2H6 and collision-induced absorption opacities (H2-H2, H2-He, H2-CH4, He-CH4 and CH4-CH4) assuming a H2 ortho/para fraction at equilibrium. Stratospheric aerosols [18] and two cloud layers of CH4 and H2S  are also included. Our model accounts for the internal heat flux, for multiple scattering as proposed by [19] and Rayleigh scattering. 


During this congress, we will discuss the insights gained from GCM simulations at high horizontal resolution (equivalent to 1° in latitude/longitude) on a layer of the atmosphere located between 3 bar and 0.3 mbar and split in 40 vertical levels. The preliminary results obtained from 3 simulated years on Neptune by the GCM make it possible to highlight a complex zonal circulation characterized by an intense retrograde equatorial jet (fig.1) and a strong eddy activity characterized by bursts.
First of all, we will present the zonal and meridional circulation obtained after 10 simulated Neptune years, which is the expected spin-up time based on our experience with Saturn and Jupiter. Then, we will compare the thermal structure obtained on our simulations with the observations from [20]. Next, we will discuss the eddy activity highlighted by the diagnostics of the circulation (eddy momentum transport, spectral analysis of waves,...) and finally, its contribution to the acceleration or deceleration of the simulated jets.


Acknowledgements

The authors would like to thank Leigh N. Fletcher and Glenn S. Orton for sending us the zonal mean temperature data on Neptune and Uranus, and Bernard Schmitt for sending us the optical constants of H2S ice. G. Milcareck, S. Guerlet and A. Spiga acknowledge funding from Agence Nationale de la Recherche (ANR) project SOUND, ANR-20-CE49-00009-01.

References

[1] Lindal et al. (1987). Journal of Geophysics Research, 92.
[2] Lindal et al. (1992). Astronomical Journal, 103.
[3] Fletcher et al. (2020). Space Science Reviews, 216.
[4] Yano et al. (2005). Geophysical and Astrophysical Fluid Dynamics, 99.
[5] Heimpel et al. (2005). Nature, 438.
[6] Vasavada and Showman (2005). Reports on Progress in Physics, 68.
[7] Heimpel and Aurnou (2007). Icarus, 187.
[8] Glatzmaier et al. (2009). Geophysical and Astrophysical Fluid Dynamics, 103.
[9] Aurnou et al. (2007). Icarus, 190.
[10] Soderlund et al. (2013). Icarus, 224.
[11] Liu and Schneider (2010). Journal of Atmospheric Sciences, 67.
[12] Lian and Showman (2010). Icarus, 207.
[13] Guerlet et al. (2014). Icarus, 238.
[14] Spiga et al. (2020). Icarus, 335.
[15] Cabanes et al. (2020). Icarus, 345.
[16] Bardet et al. (2021). Icarus, 354.
[17] Dubos et al. (2015). Geoscientific Model Development, 8.
[18] Vatant d’Ollone et al. In preparation.
[19] Toon et al. (1989). Journal of GeophysicsResearch, 94.
[20] Fletcher et al. (2014). Icarus, 231.

How to cite: Milcareck, G., Guerlet, S., Spiga, A., Leconte, J., Bardet, D., Montmessin, F., and Boissinot, A.: GCM simulations of Uranus and Neptune: general circulation and eddy activity, Europlanet Science Congress 2021, online, 13–24 Sep 2021, EPSC2021-54, https://doi.org/10.5194/epsc2021-54, 2021.

EPSC2021-203
|
ECP
Naomi Rowe-Gurney, Leigh Fletcher, Glenn Orton, Michael Roman, James Sinclair, Julianne Moses, and Patrick Irwin

Introduction: NASA’s Spitzer Infrared Spectrometer (IRS) acquired mid-infrared (5 - 37 micron) disc-averaged spectra of Neptune in May 2004, November 2004, November 2005, and May 2006. Meadows et al., (2008, doi: 10.1016/j.icarus.2008.05.023) discovered Neptune's complex hydrocarbons methylacetylene and diacetylene and derived their abundances using the May 2004 data. The rest of the Neptune data has yet to be published. The data have all been reduced using the same methodology as Rowe-Gurney et al., (2021, doi: 10.1016/j.icarus.2021.114506) used for Uranus, so that each year can be reliably compared.

We detect the same hydrocarbons seen in Meadows et al., (2008). This includes the strongest bands of methane (CH4), acetylene (C2H2) and ethane (C2H6) as-well-as weaker but still clearly recognisable features of ethylene (C2H4), carbon dioxide, methyl (CH3), methylacetylene (C3H4) and diacetylene (C4H2).

At Uranus, there was a considerable longitudinal variation in stratospheric emission detected in the Spitzer data for multiple epochs (Rowe-Gurney et al., 2021). A variation is not present at Neptune in 2005 or late 2004, when all the separate longitudes displayed the same brightness temperature. In May 2004 a stratospheric variation is present, although it is tentative due to the deviation only appearing at a single longitude and because there are larger uncertainties on this early dataset. If the variation is real then it could be caused by stratospheric methane injection associated with convective clouds or perturbations to the location of the south polar warm vortex (Orton et al., 2012, doi: 10.1016/j.pss.2011.06.013).

Optimal Estimation Retrievals: The data from 2005 have optimised exposure times, multiple observed longitudes, and therefore the lowest noise. It is this data we are using to derive the vertical structure of the temperature and composition in the stratosphere and upper troposphere (between around 1 nanobar and 2 bars of pressure). We present full optimal estimation inversions (using the NEMESIS retrieval algorithm, Irwin et al., 2008, doi: 10.1016/j.jqsrt.2007.11.006) of the globally averaged November 2005 data with the aim of constraining the temperature profile and the abundances of the stratospheric hydrocarbons. We fit both the low-resolution (R~120) and high-resolution (R~600) module data, testing multiple temperature priors derived from chemical models (Moses et al., 2018, doi: 10.1016/j.icarus.2018.02.004) and observations from AKARI (Fletcher et al., 2010, doi: 10.1051/0004-6361/200913358). Initial findings show that we are sensitive to stratospheric D/H ratio (derived from the relative abundances of CH4 and CH3D) and therefore we will attempt to constrain this value by finding the best fit for our model.

Conclusion: Full spectrum mid-infrared data from Neptune in 2005 taken by the Spitzer Infrared Spectrometer is to be analysed using optimal estimation retrievals for the first time. The globally-averaged stratospheric temperature structure and the abundances of stratospheric hydrocarbons will be determined along with the ratio of D/H. The disc-averaged thermal and chemical structure from Spitzer will likely be our best characterisation of Neptune’s thermal structure until JWST/MIRI acquired spatially-resolved mid-infrared spectroscopy in 2022.

How to cite: Rowe-Gurney, N., Fletcher, L., Orton, G., Roman, M., Sinclair, J., Moses, J., and Irwin, P.: Neptune's Atmospheric Structure from the Spitzer Infrared Spectrometer, Europlanet Science Congress 2021, online, 13–24 Sep 2021, EPSC2021-203, https://doi.org/10.5194/epsc2021-203, 2021.

EPSC2021-215
Michael T Roman, Leigh N Fletcher, Glenn S Orton, Naomi Rowe-Gurney, Julianne Moses, Thomas Greathouse, James Sinclair, Arrate Antunano, Patrick GJ Irwin, Yasumasa Kasaba, Takuya Fuhiyoshi, and James Blake

We present results from a comprehensive analysis of mid-infrared imaging of Neptune's atmosphere.  Using all currently available ground-based images, we show how Neptune's mid-infrared emission has changed over the past decades in images sensitive to stratospheric ethane, methane, and temperatures.  Neptune's stratospheric thermal emission appears to vary significantly on sub-seasonal timescales of years or less with significant latitudinal asymmetry not predicted by seasonal radiative and photochemical models.  In particular, Neptune's stratospheric temperatures have declined globally since 2003, although northern and southern latitudes varied separately.  In just the past few years, Neptune's south polar region has dramatically brightened while the remainder of the stratosphere has grown colder.  These collective observations provide the strongest evidence to date that processes produce significant variability in Neptune's stratosphere on sub-seasonal timescales. 

Background: Despite being the most distant giant planet from the Sun, the ice giant Neptune possesses an extremely dynamic atmosphere, with meteorological phenomena evolving over a surprising range of timescales. Theory predicts Neptune's 165-year orbital period should modulate Neptune's stratospheric temperatures and chemistry [1] and, potentially, upper tropospheric temperatures [2] very slowly across seasons lasting several decades. But a growing body of mid-IR observations over the past decades are starting to reveal that Neptune's stratosphere is likely even more dynamic and variable than previously known [3].

Analysis: Ground-based imaging of Neptune at mid-infrared wavelengths (~7.7--24.5 µm) dating back to 2003 are collected, calibrated, and analysed to reveal trends in time. 

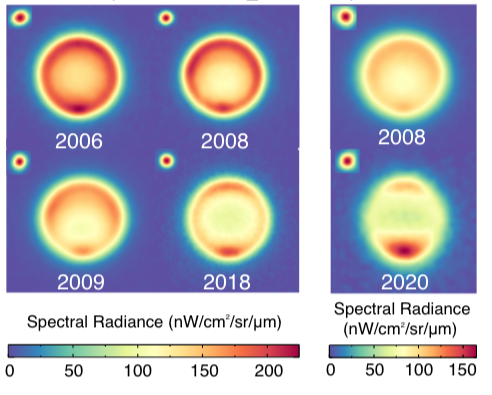
Results:  Significant changes in radiance are detected over the past two decades, with some occurring over periods of just a few years.  For example, images sensing stratospheric ethane show a significant drop in radiance between 2006 and 2009, particularly at southern mid-latitudes (see Figure 1).  By 2018, similar images show emission further reduced.  However, between 2018 and 2020, the southern pole grew dramatically brighter.  Our analysis indicates these observed changes are primarily due to changes in the stratospheric temperatures and, likely, the ethane mixing ratios. These results further suggest the importance of modulating solar UV flux and/or sub-seasonal dynamical processes in Neptune's stratosphere.

Figure 1.  Images of Neptune acquired in different years in filters sensitive to emission from stratospheric ethane. (Left) Images acquired with the VLT-VISIR 12.2 µm filter show a that the observed radiances drop over time, beginning at southern mid-latitudes (Right) Images from Subaru-COMICS 12.4 µm filter show a dramatic increase in the south polar radiance between late 2008 and mid-2020.  Together, these data suggest a rapid brightening of the Neptune's south polar vortex between mid-2018 and mid-2020.

References:

[1] Moses et al., 2018, Icarus 307: 124-145

[2] Li et al., 2018, JQSRT, 217, 1105 353

[3] Hammel et al., 2006, ApJ, 664, 1326-1333


How to cite: Roman, M. T., Fletcher, L. N., Orton, G. S., Rowe-Gurney, N., Moses, J., Greathouse, T., Sinclair, J., Antunano, A., Irwin, P. G., Kasaba, Y., Fuhiyoshi, T., and Blake, J.: Variation in Neptune's Mid-Infrared Emission from Ground Based Imaging, Europlanet Science Congress 2021, online, 13–24 Sep 2021, EPSC2021-215, https://doi.org/10.5194/epsc2021-215, 2021.

EPSC2021-495
|
ECP
Taehyun Kim, Stella Chariton, Vitali Prakapenka, Anna Pakhomova, Hanns-Peter Liermann, Zhenxian Liu, Sergio Speziale, Sang-Heon Shim, and Yongjae Lee

Astrophysical surveys so far have suggested that water-rich planets could be common [1] (including Uranus and Neptune in our Solar System). In the conventional interior model of water-rich planets, it has been assumed to have separate layers of atmosphere, ice/fluid, rocky mantle and metallic core [2]. However, recent studies have proposed the existence of heavy elements in the ice/fluid layer of Uranus, challenging the conventional view [3]. In addition, chemical interaction and thermodynamic processes of major rock-forming minerals at the H2O–rock interface conditions of the water-rich planetary interiors have been scarcely explored.

We have performed laser-heated diamond-anvil cell experiments on two rock-forming minerals, olivine ((Mg0.9,Fe0.1)2SiO4) and ferropericlase ((Mg0.9,Fe0.1)O), in water at the pressure and temperature conditions expected for the water-rich planets. During laser-heating, we collected X-ray diffraction (XRD) data at beamlines 13-IDD of GSECARS at APS and P02.2, the ECB of PETRA III at DESY. Our dataset covers pressures between 20 and 80 GPa. After high-pressure and high-temperature experiments, we conducted chemical and textural analysis using focused ion beam (FIB) and scanning electron microscope (SEM) at Yonsei University.

During laser-heating, Si-rich high-pressure phases were formed, such as bridgmanite ((Mg,Fe)SiO3) and stishovite (SiO2), from the high Mg/Si ratio of starting composition (olivine). The formation of Si-rich phases from Mg-rich starting composition suggests dissolve of MgO into H2O-liquid during laser-heating at high-pressures. This was also found for (Mg0.9,Fe0.1)O ferropericlase starting material. The intensity of the diffraction peak of ferropericlase was dramatically decreased at high-pressure and high-temperature conditions, which indicates that (Mg0.9,Fe0.1)O is soluble in H2O-liquid. From chemical analysis, we found the dome-like structures, which showed that domes are Mg-rich and below the domes is Si-rich. Between Mg-rich and Si-rich regions, porous structures (almost empty) were positioned, meaning that MgO-rich fluid existed at high-pressure and high-temperature conditions. In summary, the textural and chemical analysis combined with XRD data indicates a selective leaching of MgO preferentially from silicate during laser heating, making MgO-dissolved in high-temperature fluid, which peaks between 20 and 40 GPa and above 1,500 K [4].

For water-rich planets with 1–6 Earth masses, the chemical reaction at the deep H2O–rock interface would lead to high concentrations of MgO in the H2O layer. For Uranus and Neptune, our experiments indicate that the top ~3% of the H2O layer of them, the pressure and temperature conditions of which have been achieved in this study, would have a large storage capacity for MgO. If an early dynamic process enables the H2O–rock reaction, the topmost H2O layer may be rich in MgO, possibly affecting the thermal history of the planet.


[1] Batalha, N. M. Proc. Natl Acad. Sci. USA 111, 12647–12654 (2014). [2] Guillot, T. Annu. Rev. Earth Planet. Sci. 33, 493–530 (2005). [3] Helled, R., Nettelmann, N. & Guillot, T. Space Sci. Rev. 216, 38 (2020). [4] Kim, T. et al. Nat. Astron. (2021).

How to cite: Kim, T., Chariton, S., Prakapenka, V., Pakhomova, A., Liermann, H.-P., Liu, Z., Speziale, S., Shim, S.-H., and Lee, Y.: Atomic-scale mixing between MgO and H2O in the deep interiors of water-rich planets, Europlanet Science Congress 2021, online, 13–24 Sep 2021, EPSC2021-495, https://doi.org/10.5194/epsc2021-495, 2021.

EPSC2021-141
|
ECP
Richard Cartwright, Chloe Beddingfield, Tom Nordheim, Catherine Elder, Julie Castillo-Rogez, Marc Neveu, Ali Bramson, Mike Sori, Bonnie Buratti, Robert Pappalardo, Joseph Roser, Ian Cohen, Erin Leonard, Anton Ermakov, Mark Showalter, William Grundy, Elizabeth Turtle, and Mark Hofstadter

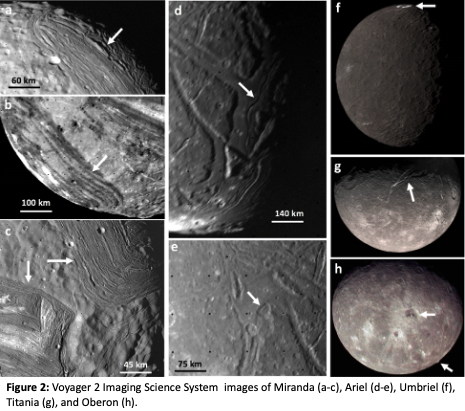
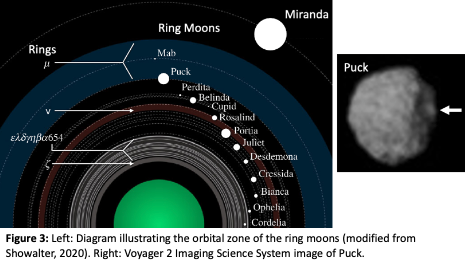
The 27 moons of Uranus (Figure 1) are enigmatic and remain poorly understood. Voyager 2 flew by the Uranus system in 1986, collecting fascinating images of its five largest, tidally-locked ‘classical’ moons (Figure 2), while also discovering a bevy of small moons nestled in its ring system (e.g., [1]) (Figure 3). The surfaces of Uranus’ classical moons Miranda, Ariel, Umbriel, Titania, and Oberon have been modified by endogenic activity, in particular Miranda and Ariel, which exhibit substantial evidence for geologic communication between their interiors and surfaces (e.g., [1-3]) (Figure 2). The available images therefore indicate that these classical moons are candidate ocean worlds, which have, or had, liquid H2O layers beneath their icy exteriors (e.g., [3-5]). 
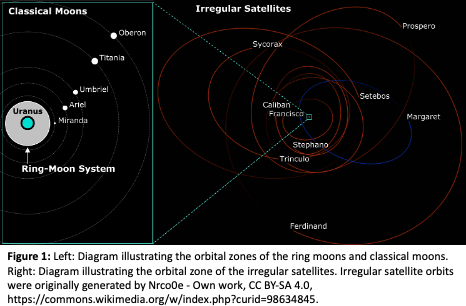
Because the Voyager 2 flyby occurred near Uranus’ southern summer solstice (subsolar latitude ~81°S), the collected images are centered near the south poles of these moons, and their northern hemispheres were largely unobservable. Furthermore, only the classical moons and the largest ring moon Puck (Figure 3) were spatially resolved by Voyager 2. The other nine ring moons Cordelia, Ophelia, Bianca, Cressida, Desdemona, Juliet, Portia, Rosalina, and Belinda were not resolved. Another ring moon, Perdita, was discovered via reanalysis of Voyager 2 data [6], and two more ring moons, Cupid and Mab [7,8], were discovered by space-based telescope observations. All nine known irregular satellites, Francisco, Caliban, Stephano, Trinculo, Sycorax, Margaret, Prospero, Setebos, and Ferdinand, were not detected by Voyager 2 and were discovered later by ground-based observations (e.g., [9-11]).

Voyager 2 was not equipped with a near-infrared (NIR) mapping spectrometer, and most of what we know about the compositions of Uranus’ moons has been determined using data collected by ground and space-based telescopes. The surfaces of Uranus’ classical moons are composed of H2O ice mixed with low albedo material that could be rich in organics and silicate minerals (e.g., [12-14]). Carbon dioxide (CO2) has been detected on the classical moons, primarily on their trailing hemispheres, in particular on Ariel [15,16] (Figure 4). Spectrally red material that could be rich in organics has been detected, primarily on the leading hemispheres of these moons (e.g., [17,18]) (Figure 4). Ammonia (NH3) has possibly been detected on the classical moons and may originate from their interiors [18,19]. Although useful, these prior observations are disk-integrated, limiting our ability to constrain the distribution of surface constituents and identify links between volatile species and geologic terrains. Much less is known about the surface compositions of Uranus’ 13 ring moons and nine irregular satellites, which are mostly too faint (Vmag 19.8 - 25.8) for spectroscopic analysis using existing facilities. Spectrophotometric datasets indicate that Uranus’ ring moons have dark surfaces that show hints of H2O ice features [6]. Uranus’ irregular satellites have dark, reddish surfaces (e.g., [20]) but little else is known about their surface compositions, except for Sycorax, which shows hints of H2O ice [21].

An orbiting spacecraft collecting data during close flybys of Uranus’ ring system and classical moons would reveal the surface geologies of these moons, including on their previously unobserved northern hemispheres, determine their surface compositions, and determine whether any of the classical moons are, or were, ocean worlds. Furthermore, an orbiter could spend time looking outward to characterize Uranus’ irregular satellites, providing new insight into these likely captured objects (e.g., Jewitt & Haghighipour 2007).  By utilizing a Jupiter gravity assist (2030 - 2034 launch window), a mission could arrive at the Uranian system in the mid 2040’s (∼11 years flight time), using existing chemical propulsion technology [22]. This arrival time frame would allow us to observe these moons’ northern hemispheres. An orbiter making close flybys of the classical moons could search for evidence of ongoing geologic activity and characterize migration of CO2 in response to changes in subsolar heating as the Uranian system transitions into southern spring in 2050.

To determine whether liquid H2O layers are present in the interiors of the classical moons, the highest priority instrument onboard an orbiter would be a magnetometer, which could detect  and characterize induced magnetic fields emanating from briny subsurface oceans. Visible (VIS, 0.4 - 0.7 µm) and mid-infrared (MIR, 5 - 250 µm) cameras would also be vital to search for plume activity, hot spots, and other signs of geologic communication between the interiors and surfaces of these moons. A spectrometer (0.4 - 5 µm) would be critical for characterizing volatile species that might result from outgassing of material or recently exposed or emplaced surface deposits. The abundant evidence for geologic activity in the recent past on Ariel and Miranda likely makes them the highest priority targets for any mission that aims to characterize Uranus’ satellites.

References: [1] Smith, B. A. et al. 1986, Science, 233, 43. [2] Schenk, P. M. 1991, JGR: Solid Earth, 96, 1887. [3] Beddingfield, C. B. & Cartwright, R. J. 2020, Icarus, 113687. [4] Hendrix, A. R. et al. 2019, Astrobiology, 19, 1. [5] Cartwright, R.J. et al. 2021. arXiv preprint arXiv:2105.01164. [6] Karkoschka, E. 2001, Icarus, 151, 51. [7] Showalter, M. R. & Lissauer, J. J. 2006, Science, 311, 973. [8] De Pater, I. et al. 2006, Science, 312, 92. [9] Gladman, B. J. et al. 1998, Nature, 392, 897. [10] Kavelaars, J. et al. 2004, Icarus, 169, 474. [11] Sheppard, S. S. et al. 2005, AJ, 129, 518. [12] Cruikshank, D. et al. 1977, AJ, 217, 1006. [13] Clark, R. N. & Lucey, P. G. 1984, JGR: Solid Earth, 89, 6341. [14] Brown, R. H. & Clark, R. N. 1984, Icarus, 58, 288. [15] Grundy, W. et al. 2006, Icarus, 184, 543. [16] Cartwright, R. J. et al. 2015, Icarus, 257, 428. [17] Buratti, B. J. & Mosher, J. A. 1991, Icarus, 90, 1. [18] Cartwright, R. J. et al. 2018, Icarus, 314, 210. [19] Cartwright, R. J. et al. 2020c, ApJL, 898, L22. [20] Maris, M. et al. 2007, A&A, 472, 311. [21] Romon, J. et al. 2001, A&A, 376, 310. [22] Hofstadter, M. et al. 2019, Planetary and Space Science, 177, 104680.

How to cite: Cartwright, R., Beddingfield, C., Nordheim, T., Elder, C., Castillo-Rogez, J., Neveu, M., Bramson, A., Sori, M., Buratti, B., Pappalardo, R., Roser, J., Cohen, I., Leonard, E., Ermakov, A., Showalter, M., Grundy, W., Turtle, E., and Hofstadter, M.: The moons of Uranus: Five candidate ocean worlds and a bevy of small satellites in an ice giant system, Europlanet Science Congress 2021, online, 13–24 Sep 2021, EPSC2021-141, https://doi.org/10.5194/epsc2021-141, 2021.

EPSC2021-594
|
ECP
Benjamin Benne, Michel Dobrijevic, Thibault Cavalié, and Jean-Christophe Loison

Introduction 

Triton is the biggest satellite of Neptune. Discovered in 1846 by W. Lassell, it was visited by Voyager 2 in 1989. It was the only spacecraft to study the neptunian system. Very little was known about Triton at the time of the flyby, except its highly inclined retrograde orbit suggesting that it is a Kuiper Belt object captured by Neptune. This idea was also comforted by the similarities between Triton and Pluto. The flyby allowed to take high resolution pictures of the surface, to determine its temperature, pressure and the composition of the surface ices (N2, CH4, CO, CO2 and water ice). Clouds and haze were also observed respectively under 10 and 30km of altitude as well as plumes of organic material propagating up to 8km, pointing out the existence of a troposphere. It appeared that the low atmosphere was at vapor pressure equilibrium with the surface’s ices (Yelle et al. 1995). The atmosphere was also studied by measuring its airglow and by performing stellar occultations (Broadfoot et al. 1989). It revealed that it is mainly composed of N2, and N with traces of CH4 near the surface. CO was not detected and so only an upper limit on its abundance had been set. An important ionosphere was also observed with an important peak at 340km (Tyler and al. 1989).  As Triton is far from the Sun, this important ionosphere cannot be explained by solar ionization only. So, it was hypothesized that energy was brought by precipitating electrons from the magnetosphere of Neptune (Strobel et al. 1990b). Another source of power is the interplanetary Lyman-Alpha flux that is not negligible at Triton’s distance from the Sun (Strobel et al. 1990a).

However, since the Voyager 2 mission and its only flyby, Triton remains poorly understood in comparison to Titan which was intensely studied during the Cassini-Huygens mission (despite some observations with ALMA and the VLT, see Lellouch et al. 2010 and Merlin et al. 2018). And as for Titan, it is now supposed that Triton is an ocean world (Fletcher et al. 2020). Sending a new mission to the neptunian system appears as a necessity to increase our knowledge about ice giants and their systems. In order to prepare such a mission, having a theoretical photochemical model for Triton can be useful to have a reference against which we would compare data collected during such a mission.

 The photochemical model

 As a starting point, we used the photochemical model of Titan (see Dobrijevic et al. 2016) and adapted it to Triton. In particular, we used the chemical scheme developed for Titan (with recent updates presented in Hickson et al. 2020), as the two atmospheres are mainly composed of N2, with presence of CH4. Our methodology is presented on Figure 1. On Titan, CH4 is the second most abundant species but only traces were observed on Triton. Strobel et al. (1990a) suggested that this species was destructed by solar and interplanetary Lyman-Alpha radiation (as Triton is at 30 UA from the Sun, the interplanetary Ly-Alpha flux is comparable to the solar one). The atmosphere of Triton is also much less dense as the surface pressure is 14 bar against 1.5 bar on Titan. We use data from Strobel and Zhu (2017) for the initial temperature, pressure, density and eddy coefficient profiles. To obtain a first validation of our model, we compare our results with the Voyager 2 data and with the results presented in the principal articles about the photochemistry of Triton published after the Voyager 2 flyby: Strobel and Summers (1995), Krasnopolsky and Cruikshank (1995). Our model takes the interplanetary Ly-Alpha flux into account as well as the energy input of precipitating electrons from the neptunian magnetosphere by adding reactions of electron impact ionization and dissociation for N2. The ionization profile was taken from Strobel et al. (1990b). We modified the chemical network to adapt it to Triton’s atmospheric composition in order to get a nominal chemical scheme.  The eddy coefficient profile is constrained to match our CH4 profile to the one measured by Voyager near the surface, as it was done in Strobel et al. (1990a) and Krasnopolsky and Cruikshank (1995).

Our model takes actually into account 204 species (117 neutrals and 87 ions). Our chemical scheme is composed of 1570 reactions (154 photodissociations, 597 neutral reactions, 31 photoionizations and 788 ionic reactions). We use an altitudinal grid varying in H/5, H being the height scale of the atmosphere, giving 96 levels from 0 to 1026km. 

First results

Our first results confirm that precipitation of magnetospheric electrons is very important to explain the composition of the ionosphere. The solar flux is also a critical parameter of the model since the CH4 abundance profile near the surface depends on the solar activity (the Voyager 2 flyby occurred near a solar maximum). This abundance profile also depends on the eddy diffusion coefficient. We also observed that the results depend strongly on some reactions. A study of the model’s uncertainties seems mandatory and will allow us to identify these key reactions. Uncertainties may indeed be large due to the low temperature of Triton’s atmosphere.


How to cite: Benne, B., Dobrijevic, M., Cavalié, T., and Loison, J.-C.: Photochemical modeling of Triton’s atmosphere: methodology and first results, Europlanet Science Congress 2021, online, 13–24 Sep 2021, EPSC2021-594, https://doi.org/10.5194/epsc2021-594, 2021.

EPSC2021-423
|
ECP
Joseph A'Hearn, Matthew Hedman, Christopher Mankovich, and Mark Marley

We investigate the prospect of using ring seismology to probe the interiors of the ice giants Uranus and Neptune. We produce normal mode spectra for different interior models of Uranus using the program GYRE. These normal mode spectra provide predictions of where in the rings of Uranus we might see effects of interior oscillations. The inner rings of Uranus look to be a promising location for identifying planetary normal mode resonances. The diversity of normal mode spectra implies that identification of even one or two modes in the rings of Uranus would eliminate a variety of interior models, and thus aid in the interpretation of Voyager observations and future spacecraft measurements. In addition, these calculations should show what aspects of the planets’ internal structure can be probed with ring seismology.

How to cite: A'Hearn, J., Hedman, M., Mankovich, C., and Marley, M.: Ice Giant Ring Seismology, Europlanet Science Congress 2021, online, 13–24 Sep 2021, EPSC2021-423, https://doi.org/10.5194/epsc2021-423, 2021.

EPSC2021-444
Daniel Santos-Costa

We present our latest understanding of the processes that shape the spatial distributions of energetic electrons trapped in the magnetospheres of Uranus (L < 15) and Neptune (L < 25). To determine what controls the energy and spatial distributions throughout the different magnetospheres, we compute the time evolution of particle distributions with the help of a diffusion theory particle transport code that solves the governing 3-D Fokker-Planck equation. Different mechanisms of particle loss, source and transport are numerically examined. Our theoretical modeling is guided by the analysis of particle, field and wave data collected during Voyager 2’s flyby of Uranus in January 1986 and at Neptune in August 1989.

Our preliminary data-model comparison results at Uranus show that adiabatic transport cannot explain the radial and angular features of warm to ultra-relativistic electron populations within the ~1-15 L region. Our simulation results also suggest that, with absence of loss mechanisms inside L = 15, energetic and radiation-belt electron populations would be higher by 1-3 orders of magnitude in intensity close to the planet (L ~ 1-8). Particularly, our results confirm that moon sweeping effect is a significant loss mechanism at Uranus. Nonetheless, other radial, energy and pitch-angle dependent mechanisms seem to be missing to explain the in-situ data. We will thus present our ongoing effort to examine the role of --for instance, Uranus’ rings system, atomic hydrogen corona and wave activity inward of L ~ 8-10 to improve our modeling of Uranus’ electron populations between L values of 1 and 15.

Our first physics-based model of energetic electrons at Neptune will be presented, emphasizing first the role of radial transport and moon sweeping effect for the 1-25 L region before investigating new processes. Our models developed for Uranus and Neptune are based on the theoretical modeling of electron distributions at Saturn, which included the modeling of radial transport and interactions of electrons with Saturn's dust/neutral/plasma environments and waves, as well as particle sources from high-latitudes, interchange injections, and outer magnetospheric region. Comparisons between the distributions of electron populations at Gas and Ice Giant systems will be discussed.

Data analysis, theoretical modeling, and numerical computations for Uranus and Neptune are carried out by adapting the Kronian modeling tools developed at Southwest Research Institute to the Ice Giants environment. Key data analysis, theoretical modeling, and numerical computational tasks for Saturn were carried out at Southwest Research Institute under NASA GSFC grant 80NSSC18K1100.

How to cite: Santos-Costa, D.: A new outlook at Uranus' and Neptune's 10 keV--5 MeV energy electron distributions from data analyses and physics-based models, Europlanet Science Congress 2021, online, 13–24 Sep 2021, EPSC2021-444, https://doi.org/10.5194/epsc2021-444, 2021.

EPSC2021-422
Tristan Guillot

Observations at radio wavelengths have shown that ammonia is absent of the atmospheres of Uranus and Neptune, even down to pressures of tens of bars. Recently, the detection of H2S at relatively low pressures, from infrared measurements, provided a definitive confirmation of this finding: In the presence of NH3, sulfur should be sequestered into NH4SH, preventing the presence of H2S and of an H2S condensation cloud at low pressures. The situation can be explained with the same approach as to explain the relative depletion of ammonia in Jupiter.  Within violent storms, ammonia vapor can combine with water ice crystals to melt them, form water-ammonia hailstones ("mushballs") that lead to an efficient transport of both species into the deeper atmosphere. I will show that while in Jupiter, equilibrium chemistry predicts the mushball seed region to be confined to a narrow parameter space, it is much more extended in Uranus and Neptune, implying that the process should be much more efficient, thus explaining the relative lack of detectable ammonia in these planets. The extent of the ammonia (and potentially water) depletion region is however unknown. Being able to determine how deep these species are transported will require a dedicated mission to map the deep atmospheric structure and understand moist convection in planets with hydrogen atmospheres. 

How to cite: Guillot, T.: Mushballs and the lack of Ammonia in Uranus and Neptune, Europlanet Science Congress 2021, online, 13–24 Sep 2021, EPSC2021-422, https://doi.org/10.5194/epsc2021-422, 2021.

EPSC2021-371
Atmospheric Entry Probes for in situ Exploration of the Ice Giant Planets
(withdrawn)
David H. Atkinson, Olivier J. Mousis, Mark Hofstadter, and Sushil K. Atreya
EPSC2021-845
|
ECP
Atmospheric Entry Probes in the Outer Solar System: Developing a Software Tool to Assess Trajectory Options
(withdrawn)
Alena Probst, Linda J. Spilker, Thomas R. Spilker, David H. Atkinson, Olivier J. Mousis, Mark Hofstadter, and Amy Simon
EPSC2021-144
Shahid Aslam, Simon Calcutt, Nicolas Gorius, Patrick Irwin, George Nehmetallah, Gerard Quilligan, and Dat Tran

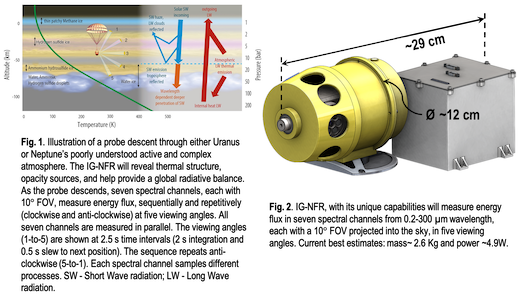
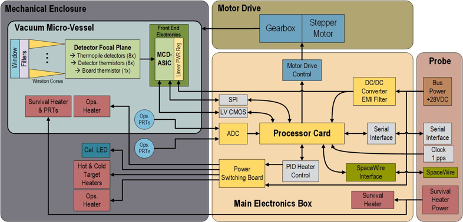
We present the evolving design of an Ice-Giants Net Flux Radiometer (IG-NFR) [1][2][3], onboard a probe, Fig. 1, for in-situ measurements of the upward and downward heat flux in seven spectral channels as a function of altitude/pressure. These in situ probe measurements, will improve our understanding of energy balance and interior heat flux [4] and provide a reference profile to lift ambiguities inherent to remote observations [5].

The IG-NFR, Fig. 2, is designed to (i) accommodate seven filter bandpass channels (ii) measure up and down radiation flux in a 10° FOV for all channels in parallel; (iii) measure a change of flux of at least 0.5 W/m2 per decade of pressure; (iv) view five distinct view angles (±80°, ±45°, and 0°); (v) use application specific integrated circuit technology for the detector readout; (vii) be able to integrate radiance for 2 s or longer, and (vi) sample calibration targets every 19 s (assuming 100 m/s descent rate). Uncooled thermopile detectors are chosen for good detection sensitivity of radiation flux. A close hexagonal packing arrangement of Winston cones gives seven channels, with each Winston cone designed to give a 10° clear FOV. The Winston cone non-imaging optics, detectors and filters are all housed in a micro-vessel with CVD diamond and sapphire windows. The evacuated micro-vessel mitigates rapid excursions of temperature during the probe descent. A stepper motor with the aid of a gearbox rotates the micro-vessel, to each of the five view angles, so that the micro-vessel diamond windows have an unobstructed view through apertures in the mechanical enclosure into the atmosphere. The mechanical enclosure accommodates five apertures, hot and cold targets for radiometric calibration for each sequence of measurements (5-views).


[1] Aslam, S., et al., (2018). 49th Lunar and Planetary Science Conference 2018, The Woodlands, Texas, USA, Volume: LPI Contrib. No. 2083, 2675

[2] Aslam, S., et al., (2019). International Planetary Probe Workshop 2019, Oxford, UK

[3] Aslam, S., et al., (2020). Space Science Reviews, 216(1)

[4] Irwin, P. G. J., et al., (2020). EPSC 2020-306, online

[5] Mousis, O., et al., (2018). Planetary and Space Science 155:12-40

How to cite: Aslam, S., Calcutt, S., Gorius, N., Irwin, P., Nehmetallah, G., Quilligan, G., and Tran, D.: Ice-Giants Net Flux Radiometer for Heat Flux Measurements, Europlanet Science Congress 2021, online, 13–24 Sep 2021, EPSC2021-144, https://doi.org/10.5194/epsc2021-144, 2021.

EPSC2021-449
|
ECP
Dat Tran, Shahid Aslam, Nicolas Gorius, Gerard Quilligan, and George Nehmetallah

From the Ice Giants Pre-Decadal Survey Mission Report 2017 (IGPDS), a Net Flux Radiometer (NFR) was identified in the IGPDS report as a complementary payload for a probe mission to the Ice Giants. In this paper, we will focus on the electrical architecture of an advanced NFR that is applicable to both Uranus and Neptune. The NFR contains seven spectral channels to measure energy flux from 0.2-300 μm region. The NFR rotates clockwise and anti-clockwise at 5 different viewing angles sequentially and each channel projects an unobstructed 5° field-of-view (FOV) into the atmosphere.  It would enable the scientists to determine an ice giant’s atmospheric heat balance and the tropospheric 3D flow which will lead to deeper understanding the plant’s radiation, region of solar energy deposition and the atmospheric conditions [1], [2], [3], [4]. In this design, thermopile sensors are used as the detector to convert radiation energy to electrical signal. Those thermopiles are uncooled and passive detector which help to reduce overall size, weight and power (SWaP) factor of the instrument. However, the readout noise is dominated by low-frequency noise which limited the resolution of the instrument. To overcome such problem, an application specific integrated circuit (ASIC) with multi-channel analog-to-digital converter has been developed to reduce the low frequency noise of the readout system. A field-programmable-gate array (FPGA) has been integrated to the readout system to truly sample seven channels of the ASIC simultaneously. In this paper, we will go over the details of the ASIC and how to use it with the FPGA to implement the readout system for the advanced NFR. Figure 1 shows the system block diagram of the instrument [5], [6], [7].

Figure 1: System block diagram of the instrument

[1] Aslam, S., et al., (2019). International Planetary Probe Workshop 2019, Oxford, UK

[2] Aslam, S., et al., (2020). Space Science Reviews, 216(1)

[3] Aslam, S., et al., (2018). 49th Lunar and Planetary Science Conference 2018, The Woodlands, Texas, USA, Volume: LPI Contrib. No. 2083, 2675

[4] Aslam, S., et al., (2021). EPSC Abstracts Vol. 15, EPSC2021-144, 2021 European Planetary Science Congress 2021

[5] Tran, D., et al., (2020). Sensors and Systems for Space Applications XIII 11422, 1142205.

[6] Tran, D., et al., (2020). Lunar and Planetary Science Conference, 1233.

[7] Quilligan, G., et al.,  (2021). IEEE Transactions on Nuclear Science.

How to cite: Tran, D., Aslam, S., Gorius, N., Quilligan, G., and Nehmetallah, G.: Ice Giants Net Flux Radiometer (IG-NFR) Electrical Architecture, Europlanet Science Congress 2021, online, 13–24 Sep 2021, EPSC2021-449, https://doi.org/10.5194/epsc2021-449, 2021.

EPSC2021-416
Entry Probe Radio Science for Measurements of  Ice Giant Atmospheric Dynamics and Composition
(withdrawn)
David H. Atkinson, Sami W. Asmar, Robert A. Preston, and Mark Hofstadter
EPSC2021-209
|
ECP
Emilie Bessette, Daphne Stam, and Erwin Mooij

We present a 6 DoF mission concept for in situ probing of Uranus’ atmosphere, consisting of two un-propelled gliders and one orbiter in continuous line of sight. We focus on analysing the gliders’ navigation and science modules. The post-processing relation between the vehicles’ estimated states and measured scientific data is investigated. In situ probing by the gliders will allow measurement of spatially variable properties of Uranus’ atmosphere over a flight duration of up to 25 Earth days, as compared to a few hours for a descent probe.


I. Introduction

No spacecraft has ever been to the Ice Giants to perform in situ measurements. The 2030s will offer this possibility, thanks to an alignment of planets allowing gravity assists by Venus and Jupiter, to reach Uranus with limited fuel consumption. This, combined with the illumination of Uranus’ unobserved Northern hemisphere allows for unique science opportunities. In situ knowledge of an Ice Giant’s atmosphere can provide information on the formation of the planet and on that of the Solar System. In particular, it could provide insight into why several models predict these planets’ formation to have taken place much closer to the Sun than where they presently are [1]. The following research question will drive the study: How can knowledge about Uranus’ current atmosphere help us understand the formation of the Ice Giants, and in a broader sense, that of the Solar System?

This study investigates the feasibility of a mission with two gliders exploring Uranus’ atmosphere. The focus is on the systems’ navigation filter and on the post-processing relation between their estimated states and in situ scientific data. All chosen navigation sensors and scientific instruments related to navigation will be modelled in Matlab/SIMULINK and coupled with a 6 DoF flight dynamics model to estimate the gliders’ states with sufficient accuracy. Scientific instruments are used as navigation sensors to tackle the ineffective use of optical sensors due to Uranus’ high opacity atmosphere. The navigation module shall thus provide accurate information on the gliders’ estimated states, and on any other knowledge needed to interpret the scientific data.


II. Proposed Method

The proposed mission architecture consists of two gliders flying in a straight symmetrical flight with tailwind, accompanied by a spacecraft orbiting Uranus. The science objectives can be divided into Tier 1, Tier 2A, and Tier 2B, in order of importance [2]. To fulfil them, Uranus’ troposphere, which extends from 0.1 bar (≈ 50 km deep) to 100 bar (-375 km deep) [3], is targeted. Two target latitudes are selected: the equatorial domain at λ = 17.5°N and the polar domain at λ = 89°N. The gliders will fly at positive longitudes to explore both day and night sides of the Northern hemisphere.

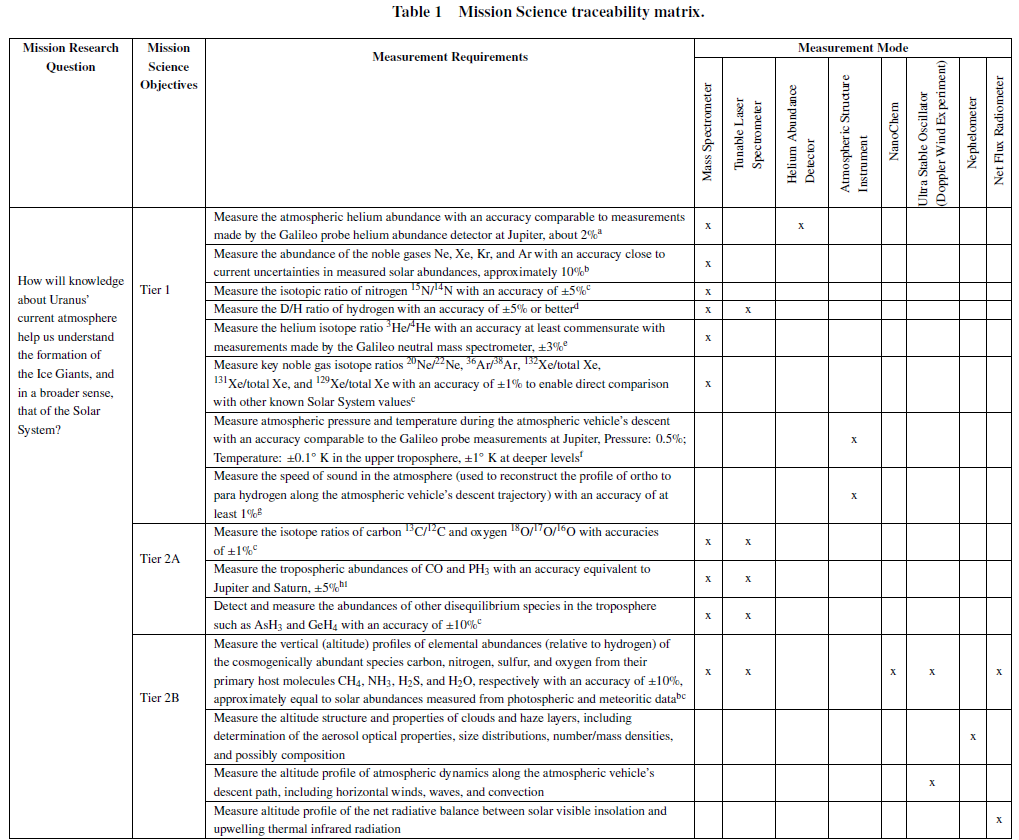
The mission’s scientific payload is inspired by [2] with the addition of a NanoChem instrument [4], for a total payload mass of about 25 kg. A science traceability matrix (Table 1) shows how each instrument contributes towards the research question.


The reference glider possesses ailerons, elevators, and a rudder. The aerodynamic coefficients were generated with Tornado [5] for minimum and maximum Mach numbers: M = 0.008 and M = 0.630. When flying at different angles of attack, the gliders' flight time can range from 2.36 Earth days at α = -6.5° to around 25 Earth days at α = -6°. The orbiter will perform a gravity assisted capture by Uranus and insert itself into a circular orbit, releasing each descent probe containing the gliders at the orbit’s periapsis passages, making use of Uranus’ fast rotation to reach the target latitudes and longitudes.


III. Preliminary Results

The telecommunication between the gliders and the orbiter is inspired by [6]. Respecting a maximum aspect angle of 60° w.r.t. the gliders’ zenith, a maximum range of 100,000 km, and considering a science data rate of 1,493 bps, around 18 min will be needed per glider to uplink its data to the orbiter, and 60 h for the orbiter to transmit that data to Earth. For maximum range, a minimum glide angle of 0.19° is found as well as a corresponding maximum arc distance of darc = 112,256.47 km. By having the gliders fly at respective latitudes of 89°N and 17.5°N, an orbiter at a minimum altitude of 26,487.5 km can continuously be in the gliders’ telecommunication cones.

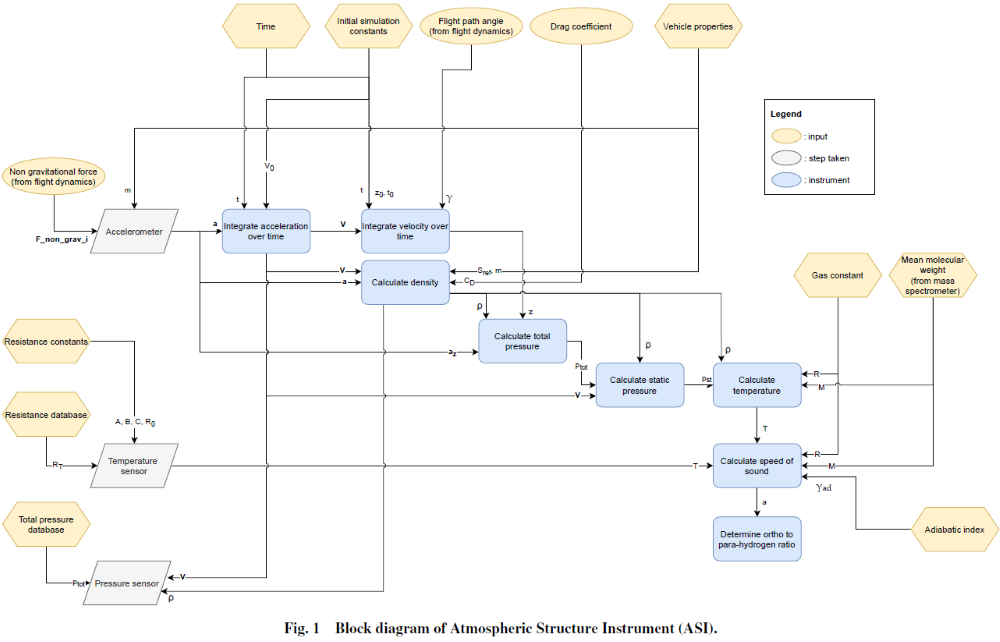
The selected navigation module’s sensors are: an Inertial Measurement Unit (IMU), a Flush Air Data Sensor (FADS), and an Ultra High Frequency (UHF) transceiver. We model and implement an additional sensor, namely the Atmospheric Structure Instrument (ASI), as part of the mission’s scientific instrument suite (Figure 1). It contains an accelerometer, a temperature sensor, and an ambient pressure sensor. Any instrument errors are neglected for now, but will be included in the final version of this study. For now, the drag coefficient CD is assumed to be determined correctly before flight, but will be changed when errors are added to obtain a more realistic flight value.


In the final version of this study, the UHF will be modelled and related to the software, in order to conduct the Doppler wind experiment and navigation radio ranging. The post-processing relation between the gliders’ estimated states and measured data will be presented, to yield accurate state estimations for trajectory tracking. 


References

[1] Morbidelli, A., et al., “Dynamics of the Giant Planets of the Solar System in the Gaseous Protoplanetary Disk and Their Relationship to the Current Orbital Architecture,” AJ, Vol. 134, No. 5, 2007, pp. 1790–1798. https://doi.org/10.1086/521705.

[2] Atkinson, D. H., et al., “Reference Model Payload for Ice Giant Entry Probe Missions,” Space Sci. Rev., Vol. 216, No. 8, 2020, 120. https://doi.org/10.1007/s11214-020-00738-y.

[3] Lunine, J. I., “The atmospheres of Uranus and Neptune.” ARA&A, Vol. 31, 1993, pp. 217–263. https://doi.org/10.1146/annurev.aa.31.090193.001245.

[4] Li, J., et al., “Carbon Nanotube Sensors for Gas and Organic Vapor Detection,” Nano Letters, Vol. 3, No. 7, 2003, p. 929–933. https://doi.org/10.1021/nl034220x.

[5] Melin, T., “User’s Guide and Reference Manual: Tornado 1.0,”, 2001.

[6] Hofstadter, M., et al., “NASA Ice Giants Pre-Decadal Study Final Report,” Tech. rep., Jet Propulsion Laboratory California Institute of Technology, Pasadena, California, Jun. 2017.

How to cite: Bessette, E., Stam, D., and Mooij, E.: Mission Analysis and Navigation Design for Uranus Atmospheric Flight, Europlanet Science Congress 2021, online, 13–24 Sep 2021, EPSC2021-209, https://doi.org/10.5194/epsc2021-209, 2021.