Europlanet Science Congress 2022
Palacio de Congresos de Granada, Spain
18 – 23 September 2022
Europlanet Science Congress 2022
Palacio de Congresos de Granada, Spain
18 September – 23 September 2022
TP7
Atmospheres and Exospheres of Terrestrial Bodies

TP7

Atmospheres and Exospheres of Terrestrial Bodies
Convener: Anni Määttänen | Co-conveners: Francisco González-Galindo, Dmitrij Titov
Orals
| Thu, 22 Sep, 10:00–13:30 (CEST)|Room Machado
Posters
| Attendance Thu, 22 Sep, 18:45–20:15 (CEST) | Display Wed, 21 Sep, 14:00–Fri, 23 Sep, 16:00|Poster area Level 1

Session assets

Discussion on Slack

Orals: Thu, 22 Sep | Room Machado

Chairperson: Anni Määttänen
Mars
10:00–10:10
|
EPSC2022-786
Ehouarn Millour, Francois Forget, Aymeric Spiga, Thomas Pierron, Antoine Bierjon, Luca Montabone, Margaux Vals, Franck Lefèvre, Jean-Yves Chaufray, Miguel Lopez-Valverde, Francisco Gonzalez-Galindo, Stephen Lewis, Peter Read, Marie-Christine Desjean, and Fabrice Cipriani and the MCD Team

Introduction:

The Mars Climate Database (MCD) is a database of meteorological fields derived from General Circulation Model (GCM) numerical simulations of the Martian atmosphere and validated using available observational data. The MCD includes complementary post-processing schemes such as high spatial resolution interpolation of environmental data and means of reconstructing the variability thereof.

The GCM that is used to create the MCD data, now known as the Mars Planetary Climate Model (Mars PCM) is developed at Laboratoire de Météorologie Dynamique du CNRS (Paris, France) [1] in collaboration with LATMOS (Paris, France), the Open University (UK), the Oxford University (UK) and the Instituto de Astrofisica de Andalucia (Spain) with support from the European Space Agency (ESA) and the Centre National d'Etudes Spatiales (CNES).

The latest version of the MCD, version 5.3 [2], was released in July 2017, and at the time of writing of this abstract we are working on MCDv6.1 [3], which we will release in June 2022. This new version will benefit from all the recent developments and improvements in the Mars PCM’s physics package.

The MCD is freely distributed and intended to be useful and used in the framework of engineering applications as well as in the context of scientific studies which require accurate knowledge of the state of the Martian atmosphere. Over the years, various versions of the MCD have been released and handed to more than 400 teams around the world.

Current applications include entry descent and landing (EDL) studies for future missions, investigations of some specific Martian issues (via coupling of the MCD with homemade codes), analysis of observations (Earth-based as well as with various instruments onboard Mars Express, Mars Reconnaissance Orbiter, Maven, Trace Gas Orbiter, Hope),...

The MCD is freely available upon request via an online form on the dedicated website: http://www-mars.lmd.jussieu.fr which moreover includes a convenient web interface for quick looks.

Figure 1: Illustrative example of the online Mars Climate Database web interface and its plotting capabilities.

Overview of MCD contents:

The MCD provides mean values and statistics of the main meteorological variables (atmospheric temperature, density, pressure and winds) as well as atmospheric composition (including dust and water vapor and ice content), as the GCM from which the datasets are obtained includes water cycle, chemistry, and ionosphere models. The database extends up to and including the thermosphere (~350km). Since the influence of Extreme Ultra Violet (EUV) input from the sun is significant in the latter, 3 EUV scenarios (solar minimum, average and maximum inputs) account for the impact of the various states of the solar cycle.

As the main driver of the Martian climate is the dust loading of the atmosphere, the MCD provides climatologies over a series of synthetic dust scenarios: standard year (a.k.a. climatology), cold (i.e: low dust), warm (i.e: dusty atmosphere) and dust storm, These are derived from home-made, instrument-derived (TES, THEMIS, MCS, MERs), dust climatology of the last 12 Martian years. In addition, we also provide additional “add-on” scenarios which focus on individual Martian Years (from MY 24 to MY 35) for users more interested in more specific climatologies than the MCD baseline scenarios.

In practice the MCD provides users with:

  • Mean values and statistics of main meteorological variables (atmospheric temperature, density, pressure and winds), as well as surface pressure and temperature, CO2 ice cover, thermal and solar radiative fluxes, dust column opacity and mixing ratio, [H20] vapor and ice concentrations, along with concentrations of many species: [CO], [O2], [O], [N2], [Ar], [H2], [O3], [H] ..., as well as electrons mixing ratios. Column densities of these species are also given.

  • Physical processes in the Planetary Boundary Layer (PBL), such as PBL height, minimum and maximum vertical convective winds in the PBL, surface wind stress and sensible heat flux.
  • The possibility to reconstruct realistic conditions by combining the provided climatology with additional large scale (derived from Empirical Orthogonal Functions extracted from the GCM runs) and small scale perturbations (gravity waves).

  • Dust mass mixing ratio, along with estimated dust effective radius and dust deposition rate on the surface are provided.

  • A high resolution mode which combines high resolution (32 pixel/degree) MOLA topography records and Insight pressure records with raw lower resolution GCM results to yield, within the restriction of the procedure, high resolution values of atmospheric variables (pressure, but also temperature and winds via dedicated schemes).


Validation of MCDv6.1:

At EPSC2022 we will present validation campaigns between the MCDv6.1 and multiple measurements such as:

  • Surface temperatures, atmospheric temperatures and water vapor from TES/MGS.

  • Atmospheric temperatures, water ice and airborne dust from MCS/MRO.

  • Atmospheric temperatures from MGS and MEx radio occultations

  • Atmospheric temperatures from TIRVIM/ACS/TGO

  • Surface pressures recorded by Viking Landers, Phoenix, Curiosity and Insight

  • And hopefully much more...


References:

[1] Forget et al. (2022), “Challenges in Mars Climate Modelling with the LMD Mars Global Climate Model, Now Called the Mars « Planetary Climate Model »(PCM) “, The 7th International Workshop on the Mars Atmosphere : Modelling and Observations, 14-17 June 2022, Paris, France.

[2] Millour et al. (2018), “The Mars Climate Database (version 5.3) “, From Mars Express to ExoMars Scienfic Workshop, 22-28 February 2018, ESAC Madrid, Spain.

[3] Millour et al. (2022), “The Mars Climate Database, Version 6.1 “, The 7th International Workshop on the Mars Atmosphere : Modelling and Observations, 14-17 June 2022, Paris, France.

How to cite: Millour, E., Forget, F., Spiga, A., Pierron, T., Bierjon, A., Montabone, L., Vals, M., Lefèvre, F., Chaufray, J.-Y., Lopez-Valverde, M., Gonzalez-Galindo, F., Lewis, S., Read, P., Desjean, M.-C., and Cipriani, F. and the MCD Team: The Mars Climate Database (Version 6.1), Europlanet Science Congress 2022, Granada, Spain, 18–23 Sep 2022, EPSC2022-786, https://doi.org/10.5194/epsc2022-786, 2022.

10:10–10:20
|
EPSC2022-260
Jean-Claude Gérard, Lauriane Soret, Rena Lee, Joe Ajello, J. Scott Evans, Nicholas Schneider, and Sonal Jain

The spin-forbidden CO a 3Π→ X 1Σ Cameron bands (190-270 nm) are the dominant feature of the middle ultraviolet spectrum of the Martian dayglow and aurora. Since their discovery in the Mars dayglow during the Mariner era (Barth, 1969), a number of studies based on observations with the SPICAM instrument on board the Mars Express (Leblanc et al., 2006; Cox et al., 2010; González‐Galindo et al., 2018) and IUVS/MAVEN (Jain et al., 2015) have revealed their altitude distribution and seasonal changes (Gérard et al., 2019). The Cameron bands are also an important marker of the distribution of auroral events on the nightside aurora, together with the CO2+ ultraviolet doublet at 288-289 nm (Gérard et al., 2015; Schneider et al., 2015). One of the important processes producing the metastable a 3Π upper state of the transition is dissociative excitation of CO2 by impact of photoelectrons or auroral electrons:

 e (E> 11.5 eV) + CO2 à CO (a 3Π) + O + e

 The excitation process includes cascades from higher lying states, which makes ab initio calculations quite complex.

Until recently, models for the production of the Cameron bands used the energy dependence of the cross section initially published by Ajello (1971) 50 years ago. It was later normalized by Avakyan et al. (1999) to the value of Erdman and Zipf (1983) at 80 eV. The absolute value of the cross section was later scaled by different factors to account for revisions of the radiative lifetime of the a3Π state and match the observations.  Recently, a new set of measurements in a large laboratory facility attenuating the wall effects has led to a revision of both the shape and the peak value of this cross section (Lee et al., 2021a).

In this presentation, we assess the consequences of this revision on the production of the Cameron bands in the Martian airglow and aurora. In particular, we discuss the importance of the contribution of the excitation of CO by electron impact e (E> 6 eV) + CO → CO(a 3Π) + e,  also recently re-examined by Lee et al. (2021b).  We discuss the relative importance of the two processes and its dependence on the CO mixing ratio in the Mars thermosphere. We also examine how these new values may affect the anomalies in the Cameron/CO2+ UV doublet intensity ratio observed with IUVS in the discrete aurora (Soret et al., 2021).

References

Ajello, J. M. (1971). The Journal of Chemical Physics55(7), 3169-3177.

Avakyan, S. V. et al. (1999).  CRC Press.

Barth, C. A. et al. (1969). Science165(3897), 1004-1005.

Cox, C. et al. (2010). Journal of Geophysical Research: Planets115(E4).

Erdman, P. W., & Zipf, E. C. (1983). Planetary and Space Science31(3), 317-321.

Gérard, J. C. et al. (2019). Journal of Geophysical Research: Space Physics124(7), 5816-5827.

González‐Galindo, F. et al. (2018). Journal of Geophysical Research: Planets123(7), 1934-1952.

Jain, S. K. et al. (2015). Geophysical Research Letters42(21), 9023-9030.

Leblanc, F. et al. (2006). Journal of Geophysical Research: Planets111(E9).

Lee, R., et al. (2021a). Mars and Venus dayglow studies based upon laboratory aeronomy from electron Impact of CO2 for analysis of UV Observations by MAVEN, EMM, MEx, and VEx. AGU Fall meeting 2021, New Orleans.

Lee, R. A. et al. (2021b). Journal of Geophysical Research: Planets126(1), e2020JE006602.

Schneider, N. M. et al. (2015). Discovery of diffuse aurora on Mars. Science350(6261), aad0313.

Soret, L. et al. (2021). Journal of Geophysical Research: Space Physics126(10), e2021JA029495.


How to cite: Gérard, J.-C., Soret, L., Lee, R., Ajello, J., Evans, J. S., Schneider, N., and Jain, S.: The CO Cameron bands in the Mars dayglow and aurora:consequences of revised cross sections, Europlanet Science Congress 2022, Granada, Spain, 18–23 Sep 2022, EPSC2022-260, https://doi.org/10.5194/epsc2022-260, 2022.

10:20–10:30
|
EPSC2022-274
Matteo Crismani, Robert Tyo, Nicholas Schneider, John Plane, Wuhu Feng, Juan-Diego Carrillo-Sanchez, Geronimo Villanueva, Sonal Jain, and Justin Deighan

Since the discovery of atmospheric Mg+ at Mars in 2015 by the Mars Atmosphere and Volatile Evolution (MAVEN) mission, there have been almost continuous observations of this meteoric ion layer in a variety of seasons, local times, and latitudes. Here we present the most comprehensive set of observations of the persistent metal ion layer at Mars, constructing the first grand composite maps of a metallic ion species. These maps demonstrate that Mg+ appears in almost all conditions when illuminated, with peak values varying between 100 and 500 cm-3, dependent on season and local time. There exists significant latitudinal variation within a given season, indicating that Mg+ is not simply an inert tracer, but instead may be influenced by the meteoric input distribution and/or atmospheric dynamics and chemistry. Geographic maps of latitude and longitude indicate that Mg+ may be influenced by atmospheric tides, and there is no apparent correlation with remnant crustal magnetic fields. This work also presents counter-intuitive results, such as a reduction of Mg+ ions in the northern hemisphere during Northern Winter in an apparent correlation with dust aerosols.

How to cite: Crismani, M., Tyo, R., Schneider, N., Plane, J., Feng, W., Carrillo-Sanchez, J.-D., Villanueva, G., Jain, S., and Deighan, J.: Martian Meteoric Mg+: Atmospheric Distribution and Variability from MAVEN/IUVS, Europlanet Science Congress 2022, Granada, Spain, 18–23 Sep 2022, EPSC2022-274, https://doi.org/10.5194/epsc2022-274, 2022.

10:30–10:40
|
EPSC2022-436
Franck Montmessin, Denis Belyaev, Franck Lefevre, Juan Alday, Anna Fedorova, Oleg Korablev, Alexander Trokhimovskiy, Mike Chaffin, and Nick Schneider

We have used a 1D hybrid model to represent the ascent of a wet air parcel at times of intense dust and transport activity. This model combines observations of the ACS instrument that measured, for the first time, water vapor abundance from 20 to 120 km. These observations enable the in-depth study of how the water vapor penetration to high altitude contributes to hydrogen production above 80 km. In contrast with other 1D models that have been used to explore Mars’ photochemistry, our model represents the vertical transport through advection with a constant velocity of 10 cm/s up to 100 km. Our results imply that, contrary to a common assumption made in models used to study Mars’ photochemistry and escape processes, the region between 60 and 80 km cannot be neglected in the production and migration of hydrogen to the upper atmosphere. In particular, these results imply that upper atmosphere photochemistry models intending to capture Southern Summer conditions need to carefully consider the flux boundary condition for H at the lower boundary if it is higher than 80 km. Testing a variety of configurations, from the MY34 GDS to the recent MY35 perihelion period, we have been able to assess how the hydrogen upward flux from above 60 km varies with events. Stochastic events (GDS and A, B, C- storms) have a strong imprint on the escape budget, but our results suggest perihelion remains the dominant escape component on the long term.

How to cite: Montmessin, F., Belyaev, D., Lefevre, F., Alday, J., Fedorova, A., Korablev, O., Trokhimovskiy, A., Chaffin, M., and Schneider, N.: Reappraising the Production and Transfer of Hydrogen to the Upper Atmosphere at Times of Elevated Water Vapor , Europlanet Science Congress 2022, Granada, Spain, 18–23 Sep 2022, EPSC2022-436, https://doi.org/10.5194/epsc2022-436, 2022.

10:40–10:50
|
EPSC2022-693
Francisco González-Galindo, Jean-Yves Chaufray, Gabriella Gilli, Margaux Vals, Franck Lefèvre, Franck Montmessin, Loic Rossi, Francois Forget, Ehouarn Millour, Miguel Ángel López-Valverde, and Adrián Brines

Introduction

The thermal (Jeans) escape of Hydrogen accumulated during the history of Mars has been one of the major mechanisms explaining the transition of Mars from a thicker and wetter atmosphere in the past to the current thin and dry atmosphere (Brain et al., 2017). Recent observations (Heavens et al., 2018, Chaffin et al., 2021) have revealed a clear link between the water cycle in the lower atmosphere, the transport of water to the middle/upper atmosphere, and the thermal escape of Hydrogen. However, many unknowns remain, including the role of the different processes responsible of transporting water from the lower to the upper atmosphere and converting it to Hydrogen atoms, or the effects of global dust storms (GDS hereafter) compared to the regular seasonal variability.

While different 1D models have been used to reproduce and understand some of the observations (e.g. Chaffin et al., 2017), until now global models have failed to reproduce the observed variability of the H escape. In particular, a recent study with the Laboratoire de Météorologie Dynamique Mars Global Climate Model (LMD-MGCM hereafter) evidences that the model significantly underestimates the H escape rate when comparing with Mars Express SPICAM observations, in particular during the perihelion season (Chaufray et al., 2021).

In this work we will summarize the recent improvements that we have included in the LMD-MGCM in order to better reproduce the observed Hydrogen escape rate, and will discuss some of the results obtained with the improved model.

Model description

We have included three improvements with respect to the version of the LMD-MGCM used in Chaufray et al., 2021.

First, we have incorporated in the simulations a sophisticated model of the microphysics of water ice clouds allowing for the formation of supersaturated water layers (Navarro et al., 2014). Second, we have extended the photochemical model in the LMD-MGCM to incorporate the chemistry of H2O+ and derived ions, as well as of deuterated (both neutral and ion) species. Third, we have also included in the calculations an improved model of deuterium fractionation (Vals et al., 2022). While this allows us to study the D escape, we will focus here only on the H escape; simulations of the deuterium escape are discussed in Chaufray et al. (this issue).

Preliminary results

The incorporation in the calculations of the microphysical model allowing for the formation of supersaturated water layers significantly increases the amount of water in the upper atmosphere of the planet with respect to the previous calculations, producing a strong enhancement of up to one order of magnitude in the H escape rate. The incorporation of the chemistry of water-derived ions further increases the escape rate in between ~20 and ~40%, depending on the season. This results in a better agreement with observations of H escape (figure 1). However, significant differences still remain. In particular, the decrease in the rate of H escape at the end of the year is not well captured by the model, suggesting that, in the model, water remains in the upper atmosphere longer than observed.

We study also the interannual variability of the simulated escape rate. While the solar activity seems to play a secondary role, dust storms in the lower atmosphere have a clear effect over the H escape rate. Our simulations show, for example, that the global dust storm in MY34 increased the annually integrated H escape rate in about 30%. This confirms the importance of taking into account the effects of GDSs when calculating the accumulated escape rate over Martian history.

This work opens the doors to studying the H escape rate at past Mars conditions characterized by different orbital parameters (e.g. obliquity, time of perihelion, etc.). See Gilli et al., this issue, for a first study in this direction.

Figure 1. H escape rate simulated for MY28 (light green line) and MY33 (orange line). The black thin line shows the escape rate for MY28 simulated with the previous model version, taken from Chaufray et al. (2021). The green and red symbols represent measured values of the H escape rate during MY28 and MY33, respectively, taken from Chaffin et al. (2014) and Heavens et al. (2018)

Acknowledgements

F.G-G. and G.G. are funded by the Spanish Ministerio de Ciencia, Innovación y Universidades, the Agencia Estatal de Investigación and EC FEDER funds under project RTI2018-100920-J-I00. AB and MALV were supported by grant PGC2018-101836-B-100 (MCIU/AEI/FEDER, EU). The IAA team acknowledges financial support from the State Agency for Research of the Spanish MCIU through the Center of Excellence “Severo Ochoa" award to the Instituto de Astrofísica de Andalucía (SEV-2017-0709)

References

Brain, D., et al., (2017), Solar Wind Interaction and Atmospheric Escape. Chapter 15 in “The Atmosphere and Climate of Mars”, Cambridge University Press, doi:10.1017/9781139060172.015

Chaffin, M., et al. (2021), Martian water loss to space enhanced by regional dust storms, Nat. Astron. doi:10.1038/s41550-021-01425-w

Chaufray, J.-Y., et al. (2021), Study of the hydrogen escape rate at Mars during martian years 28 and 29 from comparisons between SPICAM/Mars express observations and GCM-LMD simulations. Icarus, doi:10.1016/j.icarus.2019.113498

Heavens, N., et al. (2018). Hydrogen escape from Mars enhanced by deep convection in dust storms. Nat. Astron., doi:10.1038/s41550-017-0353-4

Navarro, T., et al. (2014), Global climate modeling of the Martian water cycle with improved microphysics andadiatively active water ice clouds. JGR (Planets), doi.org:10.1002/2013JE004550

Vals, M., et al. (2022), Improved modeling of Mars' HDO cycle using a Mars' Global Climate Model. Paper submitted to JGR-Planets.

How to cite: González-Galindo, F., Chaufray, J.-Y., Gilli, G., Vals, M., Lefèvre, F., Montmessin, F., Rossi, L., Forget, F., Millour, E., López-Valverde, M. Á., and Brines, A.: Simulation of the Hydrogen escape from Mars using a Global Climate Model, Europlanet Science Congress 2022, Granada, Spain, 18–23 Sep 2022, EPSC2022-693, https://doi.org/10.5194/epsc2022-693, 2022.

10:50–11:00
|
EPSC2022-696
|
ECP
Ashwin Braude, Franck Montmessin, Kevin Olsen, Margaux Vals, Juan Alday, Loïc Rossi, Alexander Trokhimovskiy, Anna Fedorova, Frédéric Schmidt, Oleg Korablev, Franck Lefèvre, Lucio Baggio, Abdanour Irbah, Gaetan Lacombe, Andrey Patrakeev, and Alexey Shakun

Abstract

Measuring vertical variations in the deuterium to hydrogen ratio with altitude is essential in understanding the processes that lead to the escape of water vapour from the Martian atmosphere. We retrieve vertical profiles of HDO and H2O from the ACS instrument, monitoring seasonal changes particularly above the water condensation level. We discuss these results in relation to previously observed seasonal variations in D/H together with the expected variations from theoretical models.

Introduction

The ratio of deuterium to hydrogen (D/H) is a sensitive tracer of the rate of escape of water from the Martian atmosphere over its history. Hydrogen preferentially escapes from the atmosphere over its heavier isotope (e.g. [1]), and so the greater the amount of historical escape of water vapour, the larger the average D/H ratio. On Mars, this value is measured to be around 4-6 times that of terrestrial distilled ocean water [2,3], showing that the early atmosphere of Mars contained significantly more water than it does today. In addition, a number of processes in the lower and middle atmosphere can cause relative changes in the concentrations of semi-heavy water (HDO) with respect to water vapour, notably due to differences in rates of cloud deposition (e.g. [4,5]) and photolysis (e.g. [6,7]). We therefore wish to look at spatial and temporal changes in the vertical profile of D/H, particularly above the level of water condensation, in order to better characterise the processes that influence the escape of water vapour from the lower atmosphere into space.

Method

The mid-infrared channel of the Atmospheric Chemistry Suite Instrument (ACS MIR, [8]) on board the ExoMars Trace Gas Orbiter obtains transmission spectra of the Martian atmosphere in solar occultation geometry, which is sensitive to trace gases at very low abundance and at high vertical resolution. We make use of observations in grating position 11, which is sensitive to a wavenumber regime in which a large number of resolvable HDO lines are present that in the best cases provide sensitivity to HDO abundance up to around 70 km. These are then inverted using the RISOTTO radiative transfer and retrieval pipeline [9,10] to give vertical profiles of HDO volume mixing ratio. Concurrent vertical profiles of H2O are obtained using the near-infrared (NIR) channel of the same instrument [11], and then the D/H ratio computed assuming that H2O and HDO are the main carriers of the two isotopes of hydrogen. Accurate quality control of the data is performed using probability-sparse Non-negative Matrix Factorisation (psNMF [12,13]).

Results and Perspective

We report seasonal changes in the fractionation of D/H in the middle atmosphere throughout the temporal range of the data starting from the autumn equinox in MY34 to the end of MY 35. These will be discussed in relation to the findings of seasonal changes in the vertical profiles of D/H reported by the NOMAD instrument [14], and the results interpreted in relation to predictions from Global Climate Models (GCMs) of HDO ([5,15,16]).


Fig. 1: Retrieved vertical profiles of (left) water vapour from (right) D/H from the near- and mid-infrared channels respectively of the ACS instrument.

References

[1] Krasnopolsky, V. A., Mumma, M. J., & Randall Gladstone, G. 1998, Science, 280, 1576

[2] Owen, T., Maillard, J. P., de Bergh, C., et al. 1988, Science, 240, 1767-1770

[3] Webster, C. R.; Mahaffy, P. R.; Flesch, G. J., et al. 2013, Science, 341, 260-263

[4] Fouchet, T. & Lellouch, E. 2000, Icarus, 144, 114-123

[5] Montmessin, F., Fouchet, T. & Forget, F. 2005, J. Geophys. Res. Plan., 110

[6] Yung, Y. L., Wen, J.-S., Pinto, J. P., et al. 1988, Icarus 76, 146-159

[7] Alday, J., Trokhimovskiy, A., Irwin, P. G. J., et al. 2021, Nat. As. 5, 943-950

[8] Korablev, O., Montmessin, F., Trokhimovskiy, A., et al. 2018, Space Sci. Rev.,214,7

[9] Braude, A. S., Ferron, S., & Montmessin, F. 2021, J. Quant. Spec. Rad. Transf.,274,107848

[10] Braude, A. S., Montmessin, F., Olsen, K. S., et al. 2022, A&A,658,A86

[11] Fedorova, A. A., Montmessin, F., Korablev, O., et al. 2020, Science 367, 297-300

[12] Hinrich, J.L. & Mørup, M. 2018, Latent Variable Analysis and Signal Separation. LVA/ICA 2018. Lecture Notes in Computer Science(), 10891, 488–498

[13] Schmidt, F.; Mermy, G. C.; Erwin, J., et al. 2021, JQSRT, 259, 107361

[14] Villanueva, G. L.; Liuzzi, G.; Crismani, M. M. J., et al. 2021, Sci. Adv. 7, eabc8843

[15] Rossi, L., Vals, M., Montmessin, F., et al., J. Geophys. Res. Plan., in review.

[16] Vals, M., Rossi, L., Montmessin, F., et al. 2022, J. Geophys. Res. Plan., in press.

How to cite: Braude, A., Montmessin, F., Olsen, K., Vals, M., Alday, J., Rossi, L., Trokhimovskiy, A., Fedorova, A., Schmidt, F., Korablev, O., Lefèvre, F., Baggio, L., Irbah, A., Lacombe, G., Patrakeev, A., and Shakun, A.: Measurements of HDO and the D/H ratio in the Martian atmosphere from ACS MIR, Europlanet Science Congress 2022, Granada, Spain, 18–23 Sep 2022, EPSC2022-696, https://doi.org/10.5194/epsc2022-696, 2022.

11:00–11:10
|
EPSC2022-730
|
ECP
Shane Stone, Geronimo Villanueva, Roger Yelle, Mehdi Benna, Giuliano Liuzzi, Meredith Elrod, and Paul Mahaffy

Isotope ratios manifest escape of the atmosphere to space and thus evolution of the climate through time, because lighter isotopes are removed from the atmosphere at a faster rate than heavier isotopes. Therefore, atmospheres experiencing extensive loss are enriched in the heavier isotopes of escaping elements. This occurs because the upper atmosphere, the reservoir of gas which escapes to space, is enriched in lighter isotopes due to diffusive separation and lighter isotopes have smaller escape energies. The Mars Atmosphere and Volatile EvolutioN (MAVEN) Neutral Gas and Ion Mass Spectrometer (NGIMS) measures the abundances of a number of molecular isotopologues, enabling an investigation of isotope ratios in the upper atmosphere of Mars.[1,2]

Using NGIMS data, we investigate both the magnitude and variation of isotope ratios in the upper atmosphere of Mars. The isotope ratios measured in this region of the atmosphere vary due to a number of processes in addition to atmospheric escape, such as diffusive separation, atmospheric transport, condensation, and photochemistry. MAVEN NGIMS has now collected thousands of vertical profiles of major isotope ratios, such as those of oxygen and carbon, over a wide range of atmospheric conditions: over the entire Martian day, across most latitudes, and through the seasons of multiple Mars years.

An isotope ratio is obtained from the NGIMS data by calculating the ratio of detector count rates in two mass per charge (m/z) channels. Then, a δ value is calculated relative to typical references standards such as Vienna Pee Dee Belemnite or Vienna Standard Mean Ocean Water. Mean profiles of the isotope ratios are produced from sequential orbits to improve the signal-to-noise ratio. Individual orbit profiles are also binned on local time, latitude, and season, to produce maps of the variation of each of the ratios. Uncertainties in these measurements must be carefully calculated to validate the accuracy of the relatively small differences measured between the isotope ratios of Martian atmospheric species and the terrestrial reference standards.

The isotope ratios of C and O in CO2 are of interest because CO2 is the main atmospheric species and thus the predominant atmospheric reservoir of C and O atoms which may escape to space. In the upper atmosphere, above the homopause, the ratios of heavier isotopes to lighter isotopes decrease with height due to diffusive separation, because lighter species have larger scale heights than heavier species. The expected decrease with height of measured isotope ratios is observed, for example, in the δ13C ratio in CO2 measured by NGIMS using m/z channels 45, corresponding to 13C16O2, and 44 corresponding to 12C16O2 (Figure 1). In addition, significant variation of δ13C in CO2 is found with Martian local time (Figure 2). This trend follows the trend in temperature.[3] Where the atmosphere is cooler, δ13C is smaller, and where the atmosphere is warmer δ13C is larger. The observed trend can be explained by a process which begins with heating on the dayside, causing the upward transport from below of gas relatively enriched in the heavier isotope, followed by subsolar-to-antisolar flow and downwelling on the nightside, causing the downward transport from above of gas relatively enriched in the lighter isotope on the cooler nightside.


Figure 1. A mean vertical profile of δ13C measured in CO2 relative to Vienna Pee Dee Belemnite (VPDB).


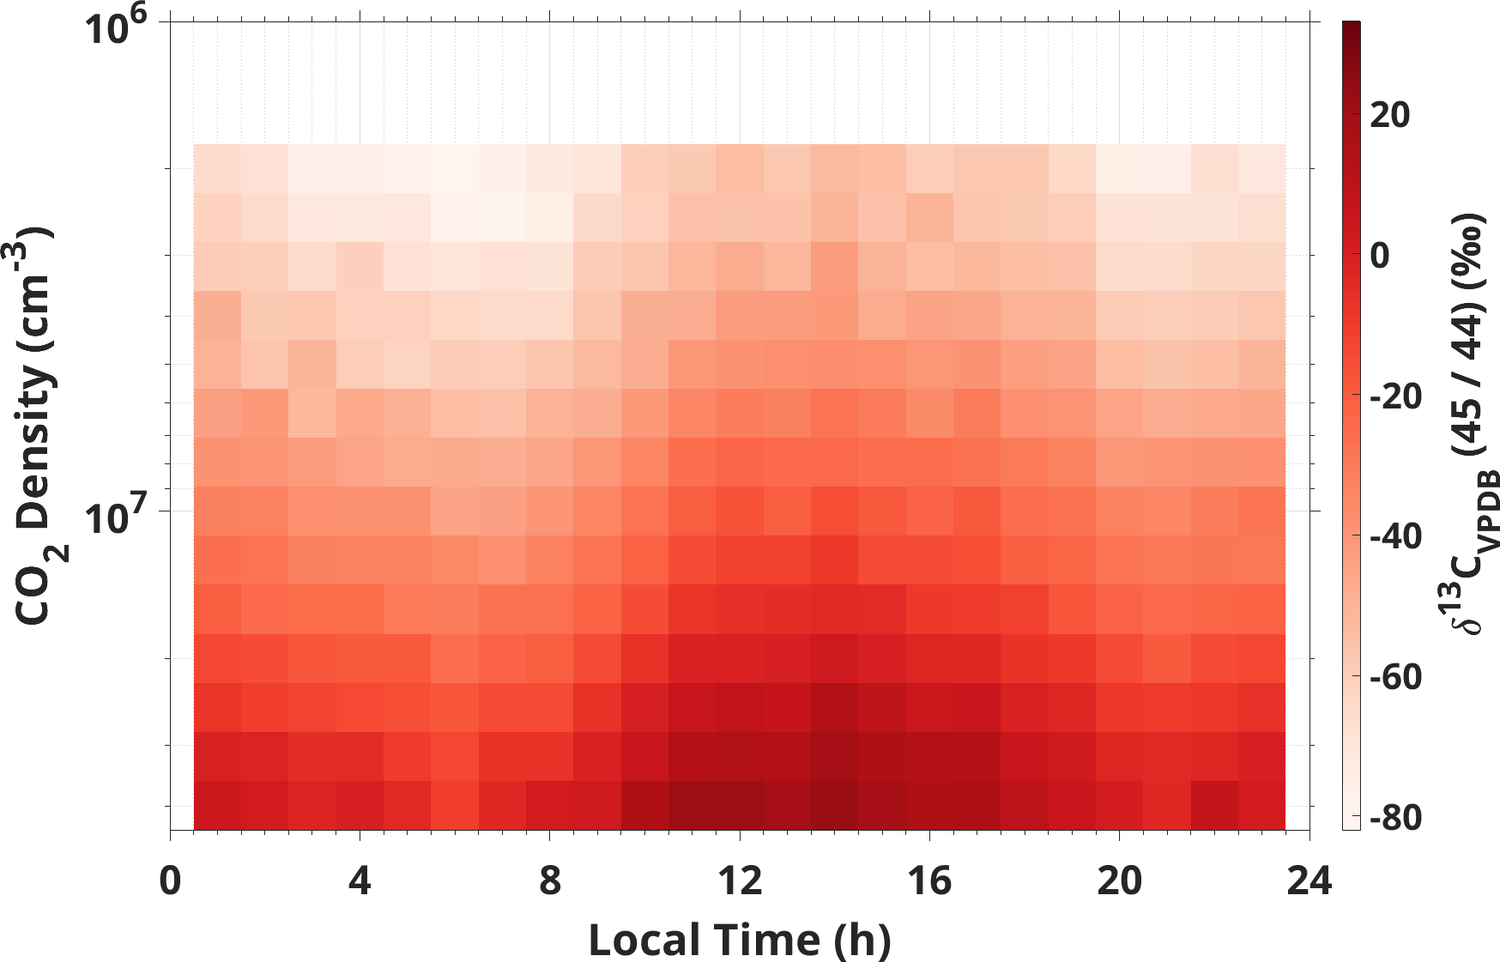
Figure 2. The local time variation of δ13C in CO2 relative to Vienna Pee Dee Belemnite (VPDB).


Comparisons can be made between the MAVEN NGIMS measurements of the isotope ratios in the upper atmosphere and measurements of these isotope ratios in the lower, middle, and upper atmosphere collected by Sample Analysis at Mars (SAM) on the NASA Curiosity rover,[4-5] Nadir and Occulation for MArs Discovery (NOMAD) and Atmospheric Chemistry Suite (ACS) onboard the ESA Trace Gas Orbiter,[8] and the NASA Viking Upper Atmospheric Mass Spectrometers.[9] These comparisons provide opportunities for the validation of NGIMS observations and provide further insight into the processes affecting the magnitude and variation of these isotope ratios from the surface to the top of the atmosphere.


References

[1] Jakosky, B. M., Lin, R. P., Grebowsky, J. M., Luhmann, J. G., Mitchell, D. F., Beutelschies, G., et al. (2015). The Mars Atmosphere and Volatile Evolution (MAVEN) Mission. Space Science Reviews, 195(1), 3–48. doi:10.1007/s11214-015-0139-x

[2] Mahaffy, P. R., Benna, M., King, T., Harpold, D. N., Arvey, R., Barciniak, M., et al. (2015). The Neutral Gas and Ion Mass Spectrometer on the Mars Atmosphere and Volatile Evolution Mission. Space Science Reviews, 195(1–4), 49–73. doi:10.1007/s11214-014-0091-1

[3] Stone, S. W., Yelle, R. V., Benna, M., Elrod, M. K., & Mahaffy, P. R. (2018). Thermal Structure of the Martian Upper Atmosphere From MAVEN NGIMS. Journal of Geophysical Research: Planets, 123(11), 2842–2867. doi:10.1029/2018je005559

[4] Mahaffy, P. R., Webster, C. R., Atreya, S. K., Franz, H. B., Wong, M. H., Conrad, P. G., et al. (2013). Abundance and Isotopic Composition of Gases in the Martian Atmosphere from the Curiosity Rover. Science, 341(6143), 263–266. doi:10.1126/science.1237966

[5] Webster, C. R., Mahaffy, P. R., Flesch, G. J., Niles, P. B., Jones, J. H., Leshin, L. A., et al. (2013). Isotope Ratios of H, C, and O in CO2 and H2O of the Martian Atmosphere. Science, 341(6143), 260–263. doi:10.1126/science.1237961

[6] Wong, M. H., Atreya, S. K., Mahaffy, P. R., Franz, H. B., Malespin, C., Trainer, M. G., et al. (2013). Isotopes of nitrogen on Mars: Atmospheric measurements by Curiosity’s mass spectrometer. Geophysical Research Letters, 40(23), 6033–6037. doi:10.1002/2013GL057840

[7] Atreya, S. K., Trainer, M. G., Franz, H. B., Wong, M. H., Manning, H. L. K., Malespin, C. A., et al. (2013). Primordial argon isotope fractionation in the atmosphere of Mars measured by the SAM instrument on Curiosity and implications for atmospheric loss. Geophysical Research Letters, 40(21), 5605–5609. doi:10.1002/2013GL057763

[8] Alday, J., Trokhimovskiy, A., Irwin, P. G. J., Wilson, C. F., Montmessin, F., Lefévre, F., et al. (2021). Isotopic fractionation of water and its photolytic products in the atmosphere of Mars. Nature Astronomy, 5(9), 943–950. doi:10.1038/s41550-021-01389-x

[9] Nier, A. O., McElroy, M. B., & Yung, Y. L. (1976). Isotopic composition of the martian atmosphere. Science, 194(4260), 68–70. doi:10.1126/science.194.4260.68

How to cite: Stone, S., Villanueva, G., Yelle, R., Benna, M., Liuzzi, G., Elrod, M., and Mahaffy, P.: Isotope Ratios in the Martian Upper Atmosphere Measured by MAVEN NGIMS, Europlanet Science Congress 2022, Granada, Spain, 18–23 Sep 2022, EPSC2022-730, https://doi.org/10.5194/epsc2022-730, 2022.

11:10–11:20
|
EPSC2022-568
Jean-Yves Chaufray, Francisco Gonzalez-Galindo, Margaux Vals, Loic Rossi, Franck Montmessin, Franck Lefevre, François Leblanc, Ronan Modolo, François Forget, Ehouarn Millour, Gabriella Gilli, Miguel Lopez-Valverde, and Majd Mayyasi

The D/H ratio is a key parameter to understand the atmospheric evolution of a planet. On Mars a D/H ~ 5 times larger than the ratio on Earth is measured. This large ratio can be explained by a preferential escape of the hydrogen compared to the deuterium due to its lower mass. However, while the thermal escape (Jeans escape) is strongly mass dependent other non-thermal processes are less mass dependent and would impact the time needed to fractionate the water from the terrestrial value to the current value.

After the first detections of the deuterium Lyman-α emission from Earth (Bertaux et al. 1992, Krasnopolsky et al. 1998), the mission MAVEN performed the first systematic observations of the atomic deuterium Lyman-α emission around Mars showing a brightness of several hundreds of Rayleigh near Mars winter solstice (Clarke et al. 2017, Mayyasi et al. 2017), much larger than the Earth detections done near aphelion (~ 20 – 50 Rayleighs). This seasonal variation of the deuterium Lyman-α brightness is consistent with the variations of the hydrogen Lyman-α brightness observed from Mars Express (Chaffin et al. 2014, Chaufray et al. 2021), HST (Clarke et al. 2014), and MAVEN/IUVS (Clarke et al. 2017, Chaffin et al. 2018) and should result from the processes transporting the water vapor from the lower atmosphere to the upper atmosphere (Vals et al. 2022).

In this work we will present preliminary simulations of the 3D deuterium abundance in the Martian upper atmosphere (Fig. 1) using a 3D time dependent global circulation model, including the chemical reactions between HD and HDO with the ions in the upper atmosphere, its extension in the exosphere, and a comparison of the simulated D Lyman-α brightness with the brightness measured by MAVEN/IUVS (Mayyasi et al. 2017) for the Martian year 33.

Fig. 1 Simulated average dayside and nightside D density at different altitudes in the thermosphere and exosphere along one Martian year.

We will also present first results of the simulated non-thermal escape of H and D produced by collisions between hot oxygen with H, D, H2 and HD as well as the escape of planetary H+ and D+ driven by the solar wind interaction. We will compare the D and H thermal escape rate with the non-thermal escape rates.


References: 


Bertaux et al. (1992), in ESOC conference and workshop proceedings, 44, 459.

Chaffin, M. et al. (2014), Geophys. Res. Lett., 41, 314-320

Chaffin, M. et al. (2018), J. Geophys. Res., 123, 2192-2210

Chaufray et al., (2021), Icarus, 353,113498

Clarke et al. (2014), Geophys. Res. Lett., 41, 8013-8020

Clarke et al. (2017), J. Geophys. Res., 122, 2336-2344

Krasnopolsky et al., (1998), Science, 280, 1576

Mayyasi et al., (2017), J. Geophys. Res., 122, 10811-10823

Vals et al. (2022), J. Geophys. Res., under revisions

How to cite: Chaufray, J.-Y., Gonzalez-Galindo, F., Vals, M., Rossi, L., Montmessin, F., Lefevre, F., Leblanc, F., Modolo, R., Forget, F., Millour, E., Gilli, G., Lopez-Valverde, M., and Mayyasi, M.: Simulation of the atomic deuterium density and escape at Mars and comparison with MAVEN/IUVS observations, Europlanet Science Congress 2022, Granada, Spain, 18–23 Sep 2022, EPSC2022-568, https://doi.org/10.5194/epsc2022-568, 2022.

11:20–11:30
|
EPSC2022-578
Gabriella Gilli, Francisco Gonzalez-Galindo, François Forget, Ehouarn Millour, Joseph Naar, and Jean-Yves Chaufray

Introduction

The climate of Mars during its first billion years is one of the most intriguing questions in our understanding of the Solar System. Mars was not always as dry as it is today, as several geologic and mineralogical observations indicate the evidence for past liquid water: valley networks and lakes are still visible on the surface (Bibring et al. 2004). Loss to space appears to explain why the Mars atmosphere evolved from an early, warmer climate to the cold, dry climate that we see today. Substantial amounts of water could have escaped into the interplanetary medium in the form of atomic hydrogen H (Jakoski et al. 2018) Furthermore, recent observations indicate that the amount of exosphere hydrogen at Mars has important seasonal variations, with significant increases of both the water abundance in the mesosphere and the H escape rate during dust storms (Chaffin et al. 2004, Clarke e al. 2004).

By analysing observations by SPICAM on board Mars Express and simulations with the LMD Mars General Circulation Model (LMD-MGCM), (Chaufray et al. 2021) suggested that episodic dust storm and associated enhancement at high altitude near the perihelion, averaged over one Martian year or longer period, are a major factor in the H escape estimates. Nevertheless, the accumulated water lost for 4 billion years at the estimated rate is much lower than the amount of water needed to form the flow channels observed on Mars. Both the dust content and the water content of the atmosphere are expected to vary with the obliquity of the planet, thus, the loss rate is definitely not expected to have been constant with time and may vary significantly during Martian history.

Theoretical studies show that in the past 250 Myrs Mars's axis inclination covered a large range of variations, between 0 and 66º, with a mean obliquity of about 35º (Laskar et al. 2004). This variation may have induced significant modifications in fundamental aspects of the Martian climate, mainly due to the differences in the distribution of the insolation, such as the CO2 cycle (and thus the surface pressure), the dust and water cycle, or the global circulation (Forget et al. 2017)

Preliminary results:  H escape during higher obliquity periods

In this work we use an improved version of the ground-to-exosphere Mars General Circulation Model (MGCM) developed at the Laboratoire de Meteorologie Dynamique (LMD) (see Gonzalez-Galindo et al. EPSC 2022, this session) to provide an estimation of the variation of water escape in past epochs characterized by different orbital parameters. Our simulations with the LMD-MGCM show that, when the martian obliquity was higher (e.g. 35º) than current values, the escape rate could have increased up to one order of magnitude (1028 atoms/s), especially during dust storm seasons (see Figure 1). This indicates that a significant H loss could have taken in the past, producing the evaporation of the large reservoir of liquid water potentially present on the surface of Mars in the past million of years.

Figure 1: Estimated H loss rate (atoms/s) from observations made from different spacecraft, together with simulated H loss rate (min/max values over 1 Martian Year) for comparison. (Adapted from Jakoski et al. 2018).


Acknowledgments: GG and FGG are funded by the Spanish Ministerio de Ciencia, Innovación y Universidades, the Agencia Estatal de Investigación and EC FEDER funds under project RTI2018100920JI00.The IAA team acknowledges financial support from the State Agency for Research of the Spanish MCIU through the Center of Excellence Severo Ochoa" award to the Instituto de Astrofísica de Andalucía (SEV20170709)

References:

[1] Bibring et al. (2004). “Perennial water ice identified in the south polar cap of Mars.”, 428(6983):627–630, Nature

[2] Jakoski et al. (2018) “Loss of the Martian atmosphere to space: Present-day
loss rates determined from MAVEN observations and integrated loss through time”, 315:146–157, Icarus

[3] Chaffin et al.(2014) ,“Unexpected variability of Martian hydrogen escape”, 41(2):314–320 GRL

[4] Clarke et al. (2014), “A rapid decrease of the hydrogen corona of Mars”, 41(22):8013–802, GRL

[5] Chaufray et al. (2021), “Study of the hydrogen escape rate at Mars dur-
ing martian years 28 and 29 from comparisons between SPICAM/MEx observations and GCM-LMD simulations”, 353:113498, Icarus

[6] Laskar et al (2004), “Long term evolution and chaotic diffusion of the insolation quantities of mars,”, 170(2):343–364 Icarus

[7] Forget et al. (2017), “Recent climate Variations”, ACM 2017, p. 464–496. 2017.

How to cite: Gilli, G., Gonzalez-Galindo, F., Forget, F., Millour, E., Naar, J., and Chaufray, J.-Y.: On the effect of the orbital parameters of Mars to the H escape and the fate of water in the last millions of years, Europlanet Science Congress 2022, Granada, Spain, 18–23 Sep 2022, EPSC2022-578, https://doi.org/10.5194/epsc2022-578, 2022.

Coffee break
Chairperson: Francisco González-Galindo
12:00–12:10
|
EPSC2022-852
|
ECP
Climate Simulations of Mars at Low Obliquity
(withdrawn)
Lucas Lange, François Forget, Romain Vandemeulebrouck, and Ehouarn Millour
12:10–12:20
|
EPSC2022-252
|
ECP
Francisco Brasil, Pedro Machado, Gabriella Gilli, Alejandro Cardesín-Moinelo, José E. Silva, Daniela Espadinha, and Rafael Rianço-Silva

Atmospheric gravity waves are mesoscale atmospheric oscillations in which buoyance acts as the restoring force, being a crucial factor in the circulation of planetary atmospheres since they transport momentum and energy, which can dissipate at different altitudes and force the dynamics of several layers of the atmosphere [1]. The source of these waves can be associated with the topographic features (orographic gravity waves) of surface, or with jet streams and atmospheric convection (non-orographic gravity waves). Recent modelling studies showed the strong role of gravity waves on diurnal tides on Mars atmosphere [2], however their characteristics are still not well constrained by observations.

Here we report follow-up results from the detection and charaterisation of atmospheric waves on Mars’ atmosphere, using data from the OMEGA spectrometer onboard the Mars Express (MEx) space mission [3]. We used image navigation and processing techniques based on contrast enhancement and geometrical projections to characterise morphological properties of the detected waves.

Our observations include the MEx nominal mission of the OMEGA instrument for the Martian years 27 and 28 (from January 2004 – January 2006 and from June – July 2007), constituted by 27 orbits and 4072 hyperspectral data QUBES. Every image was navigated and processed in order to optimise the detection of the wave packets and accurate characterisation of the wave properties such as the horizontal wavelength, packet width, packet length and orientation. The characterised wave-packets present a wide range of properties over a broad region of Mars’ globe specially in the evolution of gravity waves along the time. We also found that the detected waves occur at solar longitudes between 240-250º and 330-340º, which almost corresponds to the beginning and the end of the dust storm seasons. This preliminary result suggest a relationship between the presence of atmospheric waves and the dust storm events, already mentioned by Gondet et al. (2019).


Acknowledgements: We acknowledge support from the Portuguese Fundação Para a Ciência e a Tecnologia of reference PTDC/FIS-AST/29942/2017, through national funds and by FEDER through COMPETE 2020 of reference POCI-01-0145-FEDER-007672, and through a grant of reference 2021.05455.BD. Funded by ESA Faculty research contract and Science Exchange Programme in the frame of MWWM - Mars Wind and Wave Mapping project. We would like to thank the late Dr Brigitte Gondet for her considerable help that made this work possible.


References

[1] Fritts, D. C.; Alexander, M. J. Gravity wave dynamics and effects in the middle atmosphere. Reviews of geophysics, 2003, 41.1.

[2] Gilli, G., et al. Impact of gravity waves on the middle atmosphere of Mars: A non‐orographic gravity wave parameterization based on global climate modeling and MCS observations. Journal of Geophysical Research: Planets, 2020, 125.3: e2018JE005873.

[3] Brasil, Francisco, et al. Characterising Atmospheric Gravity Waves on Mars using Mars Express OMEGA images–a preliminary study. In: European Planetary Science Congress. 2021. p. EPSC2021-188.

[4] Gondet and J.-P. Bibring. Mars observations by omega/mex during the dust events from 2004 to 2019. In EPSC-DPS Joint Meeting 2019, volume 2019, pages EPSC–DPS2019, 2019.

How to cite: Brasil, F., Machado, P., Gilli, G., Cardesín-Moinelo, A., Silva, J. E., Espadinha, D., and Rianço-Silva, R.: Characterising Atmospheric Gravity Waves on Mars using Mars Express OMEGA images – novel results from systematised study, Europlanet Science Congress 2022, Granada, Spain, 18–23 Sep 2022, EPSC2022-252, https://doi.org/10.5194/epsc2022-252, 2022.

12:20–12:30
|
EPSC2022-390
|
ECP
Jorge Pla-Garcia, Asier Munguira, Scot C.R. Rafkin, Ricardo Hueso, Agustín Sánchez-Lavega, Manuel de la Torre, Daniel Viúdez-Moreiras, Claire Newman, Tanguy Bertrand, Teresa del Río, Naomi Murdoch, Germán Martínez, Hannu Savijarvi, Baptiste Chide, Mark Richardon, and Jose Antonio Rodríguez-Manfredi

The aim of this investigation is to carry out a study of the variability of nocturnal atmospheric turbulence at Jezero crater supported by modeling effort and monitored by MEDA. The rapid turbulent kinetic energy (hereafter TKE), wind and pressure fluctuations observed during nighttime both with modeling and MEDA is a clear indicator of nocturnal turbulence. The origin of this nocturnal turbulence is explored with MRAMS and, as opposed to Gale crater, low evidence of significant gravity waves activity during the whole period studied was found. On the contrary, the nighttime turbulence at Jezero crater could be shear driven and may be explained due to an enhanced mechanical turbulence produced by increasingly strong shear (onset of a strong low-level jet) at the nocturnal inversion interface.

As the nocturnal inversion develops, the winds above become decoupled from the surface and the decrease in friction produces a net acceleration [refs 4, 5, 6, 7]. Once the critical Richardson Number is reached (Ri ∼< 0.25, Figure 3), shear instabilities can mix warmer air aloft down to the surface [refs 8, 9, 10]. 

1. Introduction

The Mars 2020 Perseverance rover landed in Mars in February 2021 at 18.44°N 77.45°E within and near the northwest rim of Jezero crater. The MEDA weather station is aboard Perseverance rover [ref 1].

2. MRAMS mesoscale simulations

MRAMS was applied to Mars 2020 landing site region using nested grids with a spacing of 330 meters on the innermost grid that is centered over the landing site [ref 2]. 

3. Nighttime turbulence modeled with MRAMS

The effect of subgrid-scale eddies is captured within MRAMS via a prognostic TKE (Figure 1) equation [ref 3]. MRAMS shows a peak in TKE during the afternoon, which is consistent with the modeled high-frequency variations in air temperatures [Figure 3 of ref 2]. The sudden increase in air temperature during the evenings [Figure 3 of ref 2] at the onset of radiative cooling is produced by mechanically driven turbulence since the atmosphere is stable and non-convective in the evening.

The model does often show small increases of TKE during the night (Figure 1), especially during Ls=180º (corresponding to Mars 2020 sol 362) and some during Ls 105 and Ls 160 (corresponding to Mars 2020 sols 216 and 326), that could be associated with the turbulent aspects of the nighttime dynamical flows when compared with nearby locations with more flat topography. During the late evening and night, MRAMS is resolving thermal variations [2, Figure 3] and does often show small increases of TKE at that time (Figure 1). The rapid air temperature fluctuations modeled at night in all seasons is indicative of nocturnal turbulence.

There is low evidence of significant wave activity during the whole period studied and only some gravity waves were found. The nighttime turbulence could be attributed to shear driven turbulence and may be explained due to an enhanced mechanical turbulence driven by increasingly strong shear, with the onset of the nocturnal low-level jet, at the nocturnal inversion interface (an example on Figure 2). Based on GCM model efforts, looks like the low-level jet is a large scale circulation feature. The westward wind at 2 km altitude shown on Figure 2 is also show up nicely in the MCD. The jet could be forced by the diurnal cycle.

The dustier atmosphere, when arrival of northern autumn equinox, also contributes to decrease the nighttime Richardson number by two means: strengthening of the nighttime low-level jet deeping the near-surface wind shear and weakening near-surface atmospheric stability by increasing the nighttime surface temperature and decreasing of atmospheric temperature.

A third possible strengthening of the nighttime turbulence at Jezero could be the convergence, after 01:00 LTST, of downslope winds blowing from NW rim fighting against SE winds blowing both from east crater rims and from Jezero mons (located SE outside the crater), producing a big whirlpool inside the crater (Figure 4) that could be the responsible of the high variability of wind directions observed by MEDA.

4. Nightime turbulence observed with MEDA

The rapid fluctuations of pressure (moreover during high dust periods), TKE (derived only with horizontal wind speeds, that will be updated with vertical winds in the future) and wind speeds observed during nighttime with MEDA (Figures 5 and 6) is a clear indication of nocturnal turbulence.

5. Figures

Figure 1: TKE diurnal cycle predicted with MRAMS for Jezero crater at Ls0, 60, 90, 105, 160, 180 and 270.


Figure 2: MRAMS vertical cross-section (Jezero’s west rim to east rim) at 21:35 LTST of Ls=180º -corresponding to Mars 2020 sol #362- of total wind (zonal + meridional) in colored shadowed, zonal + vertical (exaggerated x5) wind in white arrows and TKE in black contours. The west crater rim is the hill on the left. Perseverance rover is located at x ≈ 17 km.


Figure 3: MRAMS vertical profiles of wind magnitude, wind shear, Richardson number (Ri) and TKE for Ls180 at Mars 2020 location corresponding to Mars 2020 sol #362 (Ls=180º). Once the critical Richardson Number is reached (Ri ∼< 0.25, red line).


Figure 4: Near-surface winds (vectors) and potential temperature (shaded) as predicted on numerical grid 5. Vectors are plotted at every other grid point. Topography contours are shown in black. Wind vector scale is shown in the bottom right area of the panels. hh:mm LTST on the top right. A big whirlpool inside the crater could be responsible for the large variability of wind directions observed by MEDA after 01:00 LTST.


Figure 5: MEDA TKE (derived only with horizontal wind speeds, that will be updated with vertical winds in the future), wind direction and horizontal wind speed instantaneous measurements for the period 00:14 to 00:23 LTST at sol #73.


Figure 6: Diurnal cycle of MEDA TKE averaged over 5 min for sols #73-87.

6. References

[1] Rodriguez-Manfredi et al. 2020; [2] Pla-Garcia et al. 2021; [3] Mellor and Yamada 1974; [4] Davis 2000; [5] Blackadar 1957; [6] Thorpe and Guymer 1977; [7] Mahrt 1981; [8] Miles 1961; [9] Banfield et al. 2020; [10] Chatain et al. 2021


How to cite: Pla-Garcia, J., Munguira, A., Rafkin, S. C. R., Hueso, R., Sánchez-Lavega, A., de la Torre, M., Viúdez-Moreiras, D., Newman, C., Bertrand, T., del Río, T., Murdoch, N., Martínez, G., Savijarvi, H., Chide, B., Richardon, M., and Rodríguez-Manfredi, J. A.: Nocturnal turbulence at Jezero driven by the onset of a low-level jet as determined from MRAMS modeling and MEDA measurements, Europlanet Science Congress 2022, Granada, Spain, 18–23 Sep 2022, EPSC2022-390, https://doi.org/10.5194/epsc2022-390, 2022.

12:30–12:40
|
EPSC2022-885
John Lee Grenfell, Fabian Wunderlich, Miriam Sinnhuber, Konstantin Herbst, Ralph Lehmann, Markus Scheucher, Stefanie Gebauer, Gabriele Arnold, and Heike Rauer

It is currently uncertain as to whether methane exists on Mars. Data from the Curiosity Rover suggests a
background methane concentration of a few tenths parts per billion whereas data from the Trace Gas Orbiter
suggest an upper limit of twenty parts per trillion. If methane exists on Mars then we do not understand fully the
physical and chemical processes affecting its lifetime. Atmospheric models suggest an over-estimate in the
lifetime by a factor of around six hundred compared with earlier observations. In the present work we assume the
Curiosity Rover background methane value and estimate the uncertainty in atmospheric chemistry and mixing
processes in our atmospheric column model 1D TERRA. Results suggest that these processes can only explain a
factor of ~sixteen lowering in the methane lifetime. This implies that if methane is present then additional,
currently unknown processes are required to explain the observed lifetime.

How to cite: Grenfell, J. L., Wunderlich, F., Sinnhuber, M., Herbst, K., Lehmann, R., Scheucher, M., Gebauer, S., Arnold, G., and Rauer, H.: Atmospheric processes affecting methane on Mars, Europlanet Science Congress 2022, Granada, Spain, 18–23 Sep 2022, EPSC2022-885, https://doi.org/10.5194/epsc2022-885, 2022.

Venus
12:40–12:50
|
EPSC2022-7
Emmanuel Marcq, Bruno Bézard, Séverine Robert, Jean-Michel Reess, Pierre Drossart, and Giuseppe Piccioni

From 2006 to 2014, the ESA Venus Express orbiter has provided a wealth of data that has not been fully analyzed yet. Here, using all available and suitable night side thermal spectra provided by the -H channel of the VIRTIS spectral imaging suite near 2.3 µm, we constrained the vertical profiles of various trace gases (CO, OCS, H2O or HDO, SO2) below the clouds in the 30-40 km altitude range. With the help of an updated version of the radiative transfer model used in our first study [Marcq et al., 2008], our preliminary results confirm previously reported findings [Marcq et al., 2008; Tsang et al., 2009; Arney et al., 2014], especially the latitudinal anti-correlation of CO and OCS. Such reanalyses of past data sets are relevant more than ever, since they provide background truth for designing future instruments on board recently selected missions towards Venus, such as the high-resolution IR spectrometer VenSpec-H onboard ESA's EnVision.

Best CO and cloud opacity fit of an order 6 VIRTIS-H spectrum acquired during orbit #277

Figure 1 (left): Best CO and cloud opacity fit of a VIRTIS-H (order 6) spectrum acquired during orbit #277
Figure 2 (right) : Retrieved CO abundances (with 1σ error bars) near 36 km with respect to latitude.

How to cite: Marcq, E., Bézard, B., Robert, S., Reess, J.-M., Drossart, P., and Piccioni, G.: Minor species measurements below the clouds of Venus using VIRTIS-H/Venus Express data set., Europlanet Science Congress 2022, Granada, Spain, 18–23 Sep 2022, EPSC2022-7, https://doi.org/10.5194/epsc2022-7, 2022.

12:50–13:00
|
EPSC2022-1058
Arianna Piccialli, Davide Grassi, Alessandra Migliorini, Romolo Politi, Giuseppe Piccioni, and Pierre Drossart

Introduction

We present zonal thermal winds derived by applying the cyclostrophic balance from the Visible and Infrared Thermal Imaging Spectrometer (VIRTIS) temperature retrievals. VIRTIS was one of the experiments on board the European mission Venus Express [1]. It consisted of two channels: VIRTIS-M and VIRTIS-H. For this study, we will analyze the complete VIRTIS dataset acquired between December 2006 and January 2010 [2,3].

Mesosphere dynamics

Venus mesosphere (60 – 100 km altitude) is a transition region characterized by different dynamical regimes. A retrograde super-rotation dominates in the lower part above the cloud top (>70 km) with wind speeds of about 100 m s-1, while a solar-antisolar circulation, driven by the day-night contrast in solar heating, can be observed above 120 km. The processes responsible for maintaining the zonal super-rotation in the lower atmosphere and its transition to the solar-antisolar circulation in the upper atmosphere are still poorly understood [4].

Different techniques have been used to obtain direct observations of wind at various altitudes: tracking of clouds in ultraviolet (UV) and near infrared (NIR) images give information on wind speed at cloud top (~70 km altitude) [5] and within the clouds (~61 km, ~66 km) [6], while ground-based measurements of dopplershift in CO2 band at 10 μm [7] and in several CO (sub-)millimeter lines [8,9] sound thermospheric and upper mesospheric winds, showing strong variability.

In the mesosphere, at altitudes where direct observations of wind are not possible, zonal wind fields can be derived from the vertical temperature structure using the thermal wind equation. Previous studies [10,11,12] showed that on slowly rotating planets, like Venus and Titan, the strong zonal winds at cloud top can be successfully described by an approximation of the Navier–Stokes equation, the cyclostrophic balance in which equatorward component of centrifugal force is balanced by meridional pressure gradient.

References

[1] Drossart, P. et al. (2007) PSS, 55:1653–1672

[2] Grassi D. et al. (2008) JGR., 113, 2, E00B09.

[3] Migliorini, A. et al. (2012) Icarus 217, 640–647.

[4] Sanchez-Lavega, A. et al. (2017) Space Science Reviews, Volume 212, Issue 3-4, pp. 1541-1616.

[5] Goncalves R. et al. Atmosphere, 12:2., 2021. doi: 10.3390/atmos12010002.

[6] Hueso, R. et al. (2012) Icarus, Volume 217, Issue 2, p. 585-598.

[7] Sornig, M. et al. (2013) Icarus 225, 828–839.

[8] Rengel, M. et al. (2008) PSS, 56, 10, 1368-1384.

[9] Piccialli, A. et al. A&A, 606, A53 (2017) DOI: 10.1051/0004-6361/201730923

[10] Newman, M. et al. (1984) J. Atmos. Sci., 41, 1901-1913.

[11] Piccialli A. et al. (2008) JGR, 113,2, E00B11.

[12] Piccialli A. et al. (2012) Icarus, 217, 669–681

How to cite: Piccialli, A., Grassi, D., Migliorini, A., Politi, R., Piccioni, G., and Drossart, P.: Zonal winds in the Venus mesosphere from VIRTIS/VEx temperature sounding, Europlanet Science Congress 2022, Granada, Spain, 18–23 Sep 2022, EPSC2022-1058, https://doi.org/10.5194/epsc2022-1058, 2022.

13:00–13:10
|
EPSC2022-384
|
ECP
Daniela Espadinha, Pedro Machado, Javier Peralta, José Silva, and Francisco Brasil

As the closest planet to Earth, it should be expected Venus to be the most Earth-like planet we know. Both Earth and Venus share almost the same radius, mass and density and were formed from the same available ingredients, at the same time and location in the Solar System. Yet, Venus has undoubtedly ended up with an extreme climate, with a dense carbon dioxide dominated atmosphere responsible for a runaway greenhouse effect and high surface temperatures. Because of these similarities and differences, Venus is a key planet in the understanding of planetary evolution to which the study of the atmospheric dynamics is indispensable. For Venus, the better understanding of cloud circulation can yield important results such as the possibility to explain and describe one of its most fascinating characteristics: the superrotation of Venus’ atmosphere.

To accurately describe the atmospheric circulation of Venus, this work employed the use of two distinct methods (described below) to obtain wind velocities on specific layers of the Venusian atmosphere:

The Doppler velocimetry for fibre-fed spectrographs was initially developed by Thomas Widemann (Widemann et al., 2008) and was later evolved by Pedro Machado who also developed and fine-tuned a Doppler velocimetry method for long slit spectrographs (Machado et al., 2012, 2014).  This technique is based on solar light scattered on Venus’ dayside and provides instantaneous wind velocities measurements of its atmosphere. The sunlight is absorbed by cloud particles in Venus’ top clouds and then re-emitted in Earth’s direction in a single back-scatter approximation (Machado et al., 2012, 2014, 2017).

The cloud-tracking method consists of a simple analysis of a pair of navigated and processed images, provided that the time interval between both is known. It is possible to analyse the motion of cloud features between the initial and second image, either by matching specific points or areas in both images. This matching process allows us to measure displacements and velocities of cloud features and deduct an average velocity for a certain cloud layer of the atmosphere, selected in the wavelength range of the observations (Peralta et al. 2018).

The use of an evolved tool of cloud tracking based on phase correlation between images and other softwares (Hueso et al. 2010) allows to explore Venus' atmospheric dynamics based on space and ground observations including data from Akatsuki UVI instrument and TNG/HARPS-N. The images used were navigated and processed for optimal identification of cloud features which help with the processes described above.

In short, the main goal of this work was to build wind profiles in different wavelengths which allow us to analyse several layers of the Venusian atmosphere. Some results of this study are presented following the works of Sánchez-Lavega et al. 2008, Hueso et al. 2013 and Horinouchi et al. 2018.

Another goal of this study is connected to the detection and characterisation of atmospheric gravity waves also using Akatsuki/UVI images. These waves are oscillatory disturbances on an atmospheric layer in which buoyancy acts as the restoring force. They can only exist in stably stratified atmospheres, that is, a fluid in which density varies mostly vertically (Silva et al. 2021). It is possible that the exploration of these waves can lead to a better understanding of the mechanisms that drive the state of superrotation of the Venusian atmosphere.


References

[1] Hueso et al., The Planetary Laboratory for Image Analysis (PLIA). Advances in Space Research, 46(9):1120–1138, 2010. 

[2] Sánchez-Lavega et al., Variable winds on Venus mapped in three dimensions. Geophysical Research Letters, 35 (13), 2008

[3] Hueso et al., Venus winds from ultraviolet, visible and near infrared images from the VIRTIS instrument on Venus Express.  2013.

[4] Horinouchi et al., Mean winds at the cloud top of venus obtained from two-wavelength UV imaging by Akatsuki. Earth, Planets and Space, 70:10, 2018.

[7] Machado et al., Characterizing the atmospheric dynamics of Venus from ground-based Doppler velocimetry, Icarus, Volume 221, p.248-261, 2012.

[6] Machado et al., Wind circulation regimes at Venus’ cloud tops: Ground-based Doppler velocimetry using CFHT/ESPaDOnS and comparison with simultaneous cloud tracking measurements using VEx/VIRTIS in February 2011, Icarus, 2014.

[7] Machado et al., Venus Atmospheric Dynamics at Two Altitudes: Akatsuki and Venus Express Cloud Tracking, Ground-Based Doppler Observations and Comparison with Modelling. Atmosphere 2021, 12, 506.

[8] Machado et al., Venus cloud-tracked and Doppler velocimetry winds from CFHT/ESPaDOnS and Venus Express/VIRTIS in April 2014. Icarus, vol. 285, p. 8-26, 2017.

[9] Peralta et al., Nightside Winds at the Lower Clouds of Venus with Akatsuki/IR2: Longitudinal, Local Time, and Decadal Variations from Comparison with Previous Measurements. The American Astronomical Society. The Astrophysical Journal Supplement Series, Volume 239, Number 2, 2018

[10] Widemann et al., Venus Doppler winds at cloud tops observed with ESPaDOnS at CFHT, Planetary and Space Science, Volume 56, p. 1320-1334, 2008.

[11] Silva et al., Characterising atmospheric gravity waves on the nightside lower clouds of Venus: a systematic analysis, A&A 649 A34, 2021.


Acknowledgements

We thank the JAXA’s Akatsuki team for support with coordinated observations. We gratefully acknowledge the collaboration of the TNG staff at La Palma (Canary Islands, Spain) - the observations were made with the Italian Telescopio Nazionale Galileo (TNG) operated on the island of La Palma by the Fundación Galileo Galilei of the INAF (Istituto Nazionale di Astrofisica) at the Observatorio del Roque de los Muchachos of the Instituto de Astrofisica de Canarias. We acknowledge support from the Portuguese Fundação Para a Ciência e a Tecnologia (ref. PTDC/FIS-AST/29942/2017) through national funds and by FEDER through COMPETE 2020 (ref. POCI-01-0145 FEDER-007672) and through a grant of reference 2020.06389.BD.

How to cite: Espadinha, D., Machado, P., Peralta, J., Silva, J., and Brasil, F.: Venus Atmospheric Dynamics: Akatsuki UVI and TNG HARPS-N observations, Europlanet Science Congress 2022, Granada, Spain, 18–23 Sep 2022, EPSC2022-384, https://doi.org/10.5194/epsc2022-384, 2022.

13:10–13:20
|
EPSC2022-542
|
ECP
Antoine Martinez, Sebastien Lebonnois, Enora Moisan, Ehouarn Millour, Thomas Pierron, Gabriella Gilli, and Franck Lefevre
  • Introduction

                    Based on the simulations provided by the IPSL Venus GCM, our team is now ready to offer access to a reference climatological model for use by the scientific community that study the atmosphere of Venus and by engineers that develop mission designs and instrumentation for Venus exploration. The VCD is now available (see http://www-venus.lmd.jussieu.fr), and provides a climatology (mean values and variability) for many characteristics of the Venusian atmosphere from the surface to the exosphere, validated against available observations.

In order to provide a predicted atmosphere reproducing as closely as possible the observations, a few adjustments and tunings were done to the IPSL Venus GCM model ([1,2]) basic processes in the context of the Venus Climate Database (VCD). To validate the thermosphere model and tuning, temperature, mass density and number densities measurements from Pioneer Venus, Magellan and Venus Express mission are used around the equator and at the poles for maximum and minimum-intermediate solar cycle conditions. 

The results of these improvements, tuning and comparisons will be presented in this study.


  • Recent improvements and tuning

Improvements have been made on the parameterization of non-LTE CO2 near-infrared heating and on the parameterization of non-orographic gravity waves. To reproduce O and CO number densities in the thermosphere, a tuning was done by increasing significantly (by a factor 10) the photodissociation of CO2 into CO and O for altitudes above 135 km. This raises many questions that we are currently investigating: role of the ionospheric chemistry and uncertainties associated with the molecular diffusion. The validation was performed using temperature, number densities and mass density data from the Pioneer Venus, Magellan and Venus Express missions.


  • Results and raised questions

Despite the initial underestimation of the atomic oxygen number density above 130-140 km by a factor of 10, the increase by the same factor of the CO2 photodissociation into O and CO above these altitudes range allow to fit very well the vertical profile of the PV-ONMS number density and to reproduce the temperature and density evolution of the Venusian thermosphere during high solar activity (180-230 s.f.u). The reduction of the nightside temperature compared to [3] comes mainly from changes in the non-orographic gravity wave parameterization. Our results suggest that the increase of their amplitude and the altitude where the waves break (above 130 km) have weakened the day-to-night transport. The difficulty in tuning the GW parameterization comes from the lack of systematic GW observations which are necessary to constrain the model parameters. However, observations of wave structure at 140 km altitude and above 160-200 km altitude at the poles led us to parameterize our GWs so that they propagate above 140 km.

  • Acknowledgements

The PV-ONMS neutral densities are obtained from the Planetary Data System (PDS) (https://pds.nasa.gov/). The authors thank Robert H. Tolson for providing Magellan aerobraking and PV-OAD data, Moa Persson, Ingo Müller-Wodarg and Pascal Rosenblatt for providing the Venus Express VExADE datasets, as well as François Lott for his advices on the GW parameterization. This work was funded by ESA under the contract No. 4000130261/20/NL/CRS. The IPSL VGCM simulations were done thanks to the High-Performance Computing (HPC) resources of Centre Informatique National de l'Enseignement Supérieur (CINES) under the allocation n°A0100110391 made by Grand Equipement National de Calcul Intensif (GENCI).


  • References

[1] Lebonnois, S., Hourdin, F., Eymet, V., Crespin, A., Fournier, R., Forget, F., 2010. J. Geophys. Res. (Planets) 115, 6006. https://doi.org/10.1029/2009JE003458.

[2] Lebonnois, S., Sugimoto, N., Gilli, G., 2016. Icarus 278, 38–51. https://doi.org/10.1016/j.icarus.2016.06.004.

[3] Gilli, G., Lebonnois, S., González-Galindo, F., López-Valverde, M.A., Stolzenbach, A., Lefèvre, F., Chaufray, J.-Y., Lott, F., Icarus, Vol 281, 2017, 55-72, 0019-1035, https://doi.org/10.1016/j.icarus.2016.09.016.

How to cite: Martinez, A., Lebonnois, S., Moisan, E., Millour, E., Pierron, T., Gilli, G., and Lefevre, F.: Exploring the variability of the Venusian Thermosphere with the IPSL Venus GCM, Europlanet Science Congress 2022, Granada, Spain, 18–23 Sep 2022, EPSC2022-542, https://doi.org/10.5194/epsc2022-542, 2022.

13:20–13:30
Display time: Wed, 21 Sep 14:00–Fri, 23 Sep 16:00

Posters: Thu, 22 Sep, 18:45–20:15 | Poster area Level 1

L1.47
|
EPSC2022-745
Raphael Moreno, Emmanuel Lellouch, Carsten Kramer, Gabriel Paubert, and Miguel Sanchez

Knowing the controversy  about the presence (or not)  of phosphine (PH3)  on Venus’ atmosphere, we have obtained spectra  of Venus  in the millimeter domain to constrain PH3 with new measurements.

Our observations -performed on Nov. 09th, 11th and 16th  2020- used the IRAM-30m single dish telescope located in Granada, Spain. to search in Venus’ atmosphere for the PH3(1-0) rotational lines at 266.944 GHz, and  the CO(2-1) and  13CO(2-1)   lines at 230.538 and 220.398 GHz, respectively. These disk-averaged measurements were obtained with  an  angular resolution of ~10” (HPBW)  while  Venus’ angular  diameter was ~12.5”.

These measurements have not  shown any PH3 spectral  signature, while the CO and  13CO lines were detected as expected.

We will present the data analysis of these observations, and use radiative transfer modelling to constrain the abundance upper limits  of PH3, and other minor species (HDO, SO and SO2)  present in our spectra.

How to cite: Moreno, R., Lellouch, E., Kramer, C., Paubert, G., and Sanchez, M.: Upper limits of PH3 in the Venus atmosphere from mm spectra observed with the IRAM-30m telescope, Europlanet Science Congress 2022, Granada, Spain, 18–23 Sep 2022, EPSC2022-745, https://doi.org/10.5194/epsc2022-745, 2022.

L1.48
|
EPSC2022-387
Itziar Garate-Lopez, Pablo Rodriguez-Ovalle, and Paula Fernandez-Urrutia

One of Venus’ unsolved mysteries is the dynamics of its polar vortices: what makes them so changeable? Where do they get the energy to survive for at least 8 years without disappearing once? How, if at all, do they affect the general circulation of the atmosphere (the so-called superrotation)? Here, we will show new measurements of wind, air temperature, and Ertel’s potential vorticity to try to clarify these points.

The VIRTIS imaging spectrometer on board the Venus Express spacecraft constantly observed the south polar vortex from 2006 to 2014. Using the data provided by this instrument in the 1.0 – 5.1 microns wavelength range, we have analysed 11 different dates and morphologies of the vortex, which added to those analysed in our previous studies [1, 2, 3] sum up to 35 in total for the wind analysis, 8 for the thermal analysis and 8 for the potential vorticity analysis.

Wind speed has been measured by tracking clouds in more than a couple of images per date. Radiative transport and inversion techniques have been used to obtain the three-dimensional spatial distribution of the air temperature [4]. In this way, we have produced wind maps at two heights (for the lower cloud and the upper cloud, that is, ~42 km and ~62 km above the surface at polar latitudes) and air temperature maps for several atmospheric layers between 55 and 85 km altitude.

The aim is to improve our understanding of the dynamics governing these vortices by confirming or refuting previously observed trends [3]. For example, the annular shape of the potential vorticity in the upper level of the clouds or the anti-correlation between the visible structures in the thermal infrared (the most characteristic structures of the Venus polar vortex) and the peaks of the potential vorticity.

References

[1] I. Garate-Lopez, R. Hueso, A. Sánchez-Lavega, J. Peralta, G. Piccioni, P. Drossart. A chaotic long-lived vortex in Venus’ southern pole. Nature Geoscience 6, 254-257 (2013). https://doi.org/10.1038/ngeo1764

[2] I. Garate-Lopez, A. García Muñoz, R. Hueso, A. Sánchez-Lavega. Instantaneous three-dimensional thermal structure of the South Polar Vortex of Venus. Icarus 245, 16-31 (2015). https://doi.org/10.1016/j.icarus.2014.09.030

[3] I. Garate-Lopez, R. Hueso, A. Sánchez-Lavega, A. García Muñoz. Potential Vorticity of the South Polar Vortex of Venus. Journal of Geophysical Research: Planets 121, 574-593 (2016). https://doi.org/10.1002/2015JE004885

[4] D. Grassi, P. Drossart, G. Piccioni, N. I. Ignatiev, L. V. Zasova, A. Adriani, M. L. Moriconi, P. G. J. Irwin, A. Negrao, A. Migliorini (2008). Retrieval of air temperature profiles in the venusian mesosphere from VIRTIS-M data: Description and validation of algorithms. Journal of Geophysical Research: Planets 113, 1–12. https://doi.org/10.1029/2008JE003075

How to cite: Garate-Lopez, I., Rodriguez-Ovalle, P., and Fernandez-Urrutia, P.: Delving deeper into Venus’ South Polar Vortex’s dynamics with VIRTIS-VEx observations, Europlanet Science Congress 2022, Granada, Spain, 18–23 Sep 2022, EPSC2022-387, https://doi.org/10.5194/epsc2022-387, 2022.

L1.49
|
EPSC2022-398
Javier Peralta, Antonio Galeote, Yeon Joo Lee, Mark Bullock, Eliot Young, Pedro Machado, Daniela Espadinha, and Roberto Baena

The study of the atmospheric circulation in the planets and moons of our solar system and exoplanets is critical for the advances in Meteorology. In slowly rotators like Venus, Titan and tidally-locked exoplanets, the Coriolis effect is too weak to balance the pressure gradients and other metric terms (centrifugal forces) generate a different balance called “cyclostrophic”. For reasons yet not fully understood, these slowly rotating bodies tend to exhibit atmospheres which rotate much faster than the solid globe, a phenomenon called atmospheric “superrotation”. Venus constitutes the most extreme case known in our solar system, with its clouds rotating up to 60 times faster than the surface, although numerical models yet fail to accurately reproduce this superrotation, especially at the deeper atmosphere. Besides, despite the richness of information provided by the space missions that explored Venus in the past and the varied and numerous Earth-based observations, accuracy in wind measurements at present is yet insufficient to isolate and characterize the several contributors of the observed speeds of the lower clouds of Venus located within 48-60 km. As a result, the net meridional circulation, influence of the solar tides or the magnitude of transient waves and eddied are yet uncertain.

In this work we intend to provide new insights about the circulation at the deeper atmosphere of Venus obtaining wind speeds with an accuracy better than 1 m·s-1 taking advantage of the long-term coherence of the lower clouds’ patterns, which enables confidently tracking cloud tracers in images separated by more than 5 hours. These high-precision winds were obtained from sequences of images taken at 1.74, 2.26 and 2.32 µm by space missions Venus Express/VIRTIS-M (2006-2008) and Akatsuki/IR2 (2016), as well as with pairs of images acquired co-ordinately by Earth-based telescopes located at different geographical locations: IRTF/SpeX in Hawaii and HCT/IRCAM in India (May and July 2004, December 2010), IRTF/SpeX in Hawaii and NOT/NOTCam (July 2020). Our results extend those from VIRTIS-M recently published by Gorinov et al. (Atmosphere 2021, 12, 186) and confirm some of their results.

How to cite: Peralta, J., Galeote, A., Lee, Y. J., Bullock, M., Young, E., Machado, P., Espadinha, D., and Baena, R.: The circulation at the nightside lower clouds of Venus with high-precision winds, Europlanet Science Congress 2022, Granada, Spain, 18–23 Sep 2022, EPSC2022-398, https://doi.org/10.5194/epsc2022-398, 2022.

L1.50
|
EPSC2022-156
Gabriele Arnold, Rainer Haus, Joern Helbert, Mario D'Amore, Alessandro Maturilli, and Harald Hiesinger

Introduction

The MErcury Radiometer and Thermal Infrared Spectrometer (MERTIS) onboard BepiColombo is designed to study and map Mercury surface mineralogy and temperatures. It combines an imaging push-broom infrared spectrometer (TIS, 7-14 µm) with a radiometer (TIR, 7-40 µm) that share the same in-flight optics, electronics, and calibration unit [1]. During the two Venus flybys of BepiColombo spacecraft in October 2020 and August 2021, MERTIS-TIS acquired several hundred thousand spectra in the mid-infrared range with spectral resolution down to 90 nm [2, 3, 4]. The MERTIS measurements were the first spectrally resolved observations of Venus in the mid-IR range since the Venera 15 mission in 1983 [8]. We report on the results of MERTIS mid IR measurements and show average brightness temperature spectra. Basing on a multi-channel radiative transfer simulation and retrieval algorithm we extract atmospheric temperature profiles and cloud parameters of Venus’ upper troposphere and mesosphere.

Method

A multi-channel radiative transfer simulation and retrieval algorithm has been adapted to investigate MERTIS-TIS data and to extract atmospheric temperature altitude profiles and cloud mode factors MF1/2 of Venus’ atmosphere. The Radiative Transfer Model (RTM) includes the discrete ordinate package DISORT [5]. It considers absorption, emission, and multiple scattering by gaseous and particulate atmospheric constituents and makes simultaneous use of information from different spectral ranges of an individual spectrum [6,7]. Mesospheric temperature profiles are retrieved using Smith’s relaxation method [8]. It employs initial and measured brightness temperatures in the 15 µm CO2 band. The results of the MERTIS measurements were compared with mid-infrared data recorded by the FS-1/4 spectrometer (PMV) aboard the Venera-15 mission in 1983 [8].

Results

We show that Venusian mesospheric parameters like temperature profiles and cloud properties can reliable determined from MERTIS flyby data (Fig. A). The short-wave edge of the 15-µm CO2 band was used to determine atmospheric temperature profiles in an altitude range of about 58-77 km (Fig. B). The retrieved temperature profiles well agree both with VIRA [9] and corresponding profiles obtained from Venera 15 PMV data. 

Atmospheric cloud factors were investigated from MERTIS spectral data around 10 µm. They are also well coinciding with earlier analyses.   Still ongoing refinements of calibration will allow the use of data between 7 and 10 μm for the analysis of further atmospheric properties.

Fig. MERTIS-TIS FB2, A: Comparison of measured and simulated MERTIS brightness temperature spectra, B: Comparison of initial and retrieved temperature profiles. Fig. MERTIS-TIS FB2, A: Comparison of measured and simulated MERTIS brightness temperature spectra, B: Comparison of initial and retrieved temperature profiles.

Fig. MERTIS-TIS FB2, A: Comparison of measured and simulated MERTIS brightness temperature spectra, B: Comparison of initial and retrieved temperature profiles.


References

[1] Hiesinger, H. and Helbert, J., Planet. Space Sci. 58, (2010).

[2] Maturilli, A., et al., 52nd LPSC, 1435, (2021).

[3] Helbert, H., et al., 52nd LPSC, 1521, (2021).

[4] Arnold, G., et al., SPIE Optics+Photonics, IR Remote Sensing and Instrumentation XXIX, 1183009, (2021).

[5] Stamnes, K. et al., Appl.Opt. (12), 2502-2509, (1988).

[6] Haus, R., Kappel, D., Arnold, G., Icarus 232C, 232-248, (2014)

[7] Haus, R., Kappel, D., Arnold, G., Planet. Space Sci. 89, 77-101, (2013).

[8] Smith, W.L., Appl. Opt.9(9), 1993-1999, (1970).

[8] Oertel, R. et al., Adv. Space Res. 5(9), 25-36, (1985).

[9] Zasova, L.V. et al., Cosmic Res. 44(4), 364-383, (2006).

How to cite: Arnold, G., Haus, R., Helbert, J., D'Amore, M., Maturilli, A., and Hiesinger, H.: Spectroscopic studies of Venusian atmosphere by BepiColombo's MERTIS instrument during the two Venus flybys, Europlanet Science Congress 2022, Granada, Spain, 18–23 Sep 2022, EPSC2022-156, https://doi.org/10.5194/epsc2022-156, 2022.

L1.51
|
EPSC2022-663
Wind conditions in the Martian planetary boundary layer
(withdrawn)
Mark Paton, Ari-Matti Harri, and Hannu Savijärvi
L1.52
|
EPSC2022-236
Wuhu Feng, John Plane, Francisco González-Galindo, Daniel Marsh, Martyn Chipperfield, Juan Diego Carrillo-Sánchez, Diego Janches, Jean-Yves Chaufray, Francois Forget, Ehouarn Millour, Matteo Crismani, Robert Tyo, Nicholas Schneider, and Mehdi Benna

It is evident that a variety of metals are deposited in the Earth’s mesosphere and lower thermosphere (MLT, ~70-120 km) through meteoric ablation when the cosmic dust particles enter the atmosphere at high entry velocity (11-72 km/s). However, it is still unclear how much and accuarate cosmic dust enters the atmosphere of Mars (though the estimation of global dust input would be a few tons per sol) and what is the difference comparing to Earth’s atmosphere (which has a 1-2 order global input range from different estimations).

We have developed global atmospheric meteoric models of Na, Fe, K, Mg, Ni, Ca, Al, Si, P, S etc) into the Whole Atmosphere Community Climate Model (WACCM) and its vertical extensions to 600 km (WACCM-X) from US National Center for Atmospheric Research (NCAR, termed WACCM-metals), which simulate well the metal layers compared with the available lidar/rocket/satellite measurements.

New observations of some metals for the Martian atmosphere (i.e., Mg+ observations from IUVS (Imaging UV Spectrometer) and Mg+, Na+ and Fe+ from NGIMS (Neutral Gas Ion Mass Spectrometer)) instruments on NASA’s Mars Atmosphere and Volatile Evolution Mission (MAVEN) spacecraft are available from 2014. Therefore, we have incorporated the chemistry of three metals (Mg, Na and Fe) in the Laboratoire de Météorologie Dynamique (LMD) Mars global circulation model (termed as LMD-Mars-Metals), following similar work we have done for the Earth’s atmosphere. The model has been developed by combining three components: the state-of-the-art LMD-Mars model covering the whole atmosphere from the surface to the upper thermosphere (up to ~ 2 x10⁻⁸ Pa or 240 km), a description of the neutral and ion-molecule chemistry of Mg, Fe and Na in the Martian atmosphere (where the high CO2 abundance produces a rather different chemistry from the terrestrial atmosphere), and a treatment of injection of the metals into the atmosphere from the ablation of cosmic dust particles. The LMD-Mars model contains a detailed treatment of atmospheric physics, dynamics and chemistry from the lower atmosphere to the ionosphere. The model also includes molecular diffusion and considers the chemistry of the C, O, H and N families and major photochemical ion species in the upper atmosphere, as well as improved treatments of the day-to-day variability of the UV solar flux and 15 mm CO2 cooling under non-local thermodynamic equilibrium conditions.

We have incorporated the chemistries of Mg, Fe and Na into LMD-Mars because these metals have different chemistries which control the characteristic features of their ionized and neutral layers in the Martian atmosphere. The Mg chemistry adds 7 neutral and 8 ionized Mg-containing species, connected by 42 neutral and ion-molecule reactions. The corresponding Fe chemistry has 39 reactions with 14 Fe-containing species. Na chemistry adds 7 neutral and only 2 ionized Na-containing species, with 32 reactions. The injection rate of these metals as a function of latitude, solar longitude at different pressure levels is pre-calculated from the Leeds Chemical Ablation Model (CABMOD) combined with an astronomical model which predicts the dust from Jupiter Family and Long Period comets, as well as the asteroid belt, in the inner solar system. The model has been evaluated against by Mg+, Na+ and Fe+ observations from IUVS and NGIMS measurements.

The comparison of these metal layers between Earth’s and Mar’s atmospheres will be discussed, which allows us to understand the meteor astronomy, chemistry and transport processes that control the different metal layers in the upper atmosphere on different planets.  

How to cite: Feng, W., Plane, J., González-Galindo, F., Marsh, D., Chipperfield, M., Carrillo-Sánchez, J. D., Janches, D., Chaufray, J.-Y., Forget, F., Millour, E., Crismani, M., Tyo, R., Schneider, N., and Benna, M.: Differential Ablation of meteoric metals in the LMD-Mars-Metals and NCAR WACCM-Metals models, Europlanet Science Congress 2022, Granada, Spain, 18–23 Sep 2022, EPSC2022-236, https://doi.org/10.5194/epsc2022-236, 2022.

L1.53
|
EPSC2022-171
How good are recent satellite based sensors and models for monitoring of air quality in Africa
(withdrawn)
Gizaw Mengistu Tsidu