Oral presentations and abstracts
Amateur astronomy has evolved dramatically over recent years. A motivated amateur, with his/her backyard instrument and available software is nowadays capable of getting high-resolution planetary images in different wavelengths (better than many professional observatories could achieve 15 years ago). Topics well covered by amateur astronomers include: high-resolution imaging of solar system planets, high-precision photometry of stellar occultations by minor objects and giant planets' atmospheres, satellites' mutual phenomena and high-precision photometry of exoplanet transits. Additionally amateurs use dedicated all-sky cameras or radio-antennae to provide continuous meteor-detection coverage of the sky near their location and they start to contribute to spectroscopic studies of solar system objects.
Hundreds of regular observers are sharing their work providing very valuable data to professional astronomers. This is very valuable at a time when professional astronomers face increasing competition accessing observational resources. Additionally, networks of amateur observers can react at very short notice when triggered by a new event occurring on a solar system object requiring observations, or can contribute to a global observation campaign along with professional telescopes.
Moreover, some experienced amateur astronomers use advanced methods for analysing their data meeting the requirements of professional researchers, thereby facilitating regular and close collaboration with professionals. Often this leads to publication of results in peer-reviewed scientific journals. Examples include planetary meteorology of Jupiter, Saturn, Neptune or Venus; meteoroid or bolide impacts on Jupiter; asteroid studies, cometary or exoplanet research.
Additionally, since July 2016, the NASA spacecraft Juno explores Jupiter's inner structure from a series of long elliptical orbits with close flybys of the planet. To understand the atmospheric dynamics of the planet at the time of Juno, NASA collaborates with amateur astronomers observing the Giant Planet. The collaborative effort between Juno and amateurs is linked to the visual camera onboard Juno: JunoCam. Juno showcases an exciting opportunity for amateurs to provide an unique dataset that is used to plan the high-resolution observations from JunoCam and that advances our knowledge of the atmospheric dynamics of the Giant planet Jupiter. Contribution of amateurs range from their own images to Junocam images processing and support on selecting by vote the feature to be observed during the flybys.
This session will showcase results from amateur astronomers, working either by themselves or in collaboration with members of the professional community. In addition, members from both communities will be invited to share their experiences of pro-am partnerships and offer suggestions on how these should evolve in the future.
Oral and poster presentations are welcome.
Public information:
Amateur astronomy has evolved dramatically over recent years. A motivated amateur, with his/her backyard instrument and available software is nowadays capable of getting high-resolution planetary images in different wavelengths (better than many professional observatories could achieve 15 years ago). Topics well covered by amateur astronomers include: high-resolution imaging of solar system planets, high-precision photometry of stellar occultations by minor objects and giant planets' atmospheres, satellites' mutual phenomena and high-precision photometry of exoplanet transits. Additionally amateurs use dedicated all-sky cameras or radio-antennae to provide continuous meteor-detection coverage of the sky near their location and they start to contribute to spectroscopic studies of solar system objects.
Hundreds of regular observers are sharing their work providing very valuable data to professional astronomers. This is very valuable at a time when professional astronomers face increasing competition accessing observational resources. Additionally, networks of amateur observers can react at very short notice when triggered by a new event occurring on a solar system object requiring observations, or can contribute to a global observation campaign along with professional telescopes.
Moreover, some experienced amateur astronomers use advanced methods for analysing their data meeting the requirements of professional researchers, thereby facilitating regular and close collaboration with professionals. Often this leads to publication of results in peer-reviewed scientific journals. Examples include planetary meteorology of Jupiter, Saturn, Neptune or Venus; meteoroid or bolide impacts on Jupiter; asteroid studies, cometary or exoplanet research.
Additionally, since July 2016, the NASA spacecraft Juno explores Jupiter's inner structure from a series of long elliptical orbits with close flybys of the planet. To understand the atmospheric dynamics of the planet at the time of Juno, NASA collaborates with amateur astronomers observing the Giant Planet. The collaborative effort between Juno and amateurs is linked to the visual camera onboard Juno: JunoCam. Juno showcases an exciting opportunity for amateurs to provide an unique dataset that is used to plan the high-resolution observations from JunoCam and that advances our knowledge of the atmospheric dynamics of the Giant planet Jupiter. Contribution of amateurs range from their own images to Junocam images processing and support on selecting by vote the feature to be observed during the flybys.
This session will showcase results from amateur astronomers, working either by themselves or in collaboration with members of the professional community. In addition, members from both communities will be invited to share their experiences of pro-am partnerships and offer suggestions on how these should evolve in the future.
Session assets
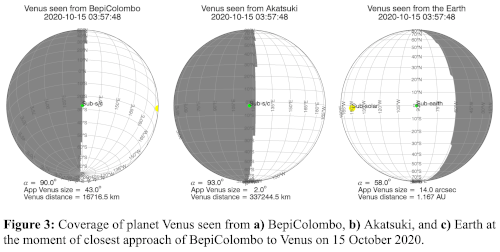
The European-Japanese joint mission BepiColombo (ESA/JAXA) will arrive to Mercury on December 2025 after an interplanetary trajectory in which it will perform two flybys of Venus on 15 October 2020 and 11 August 2021. The flybys will be a unique opportunity to study Venus from a multiple perspective. In fact, during the flybys BepiColombo will make Venus observations and measurements in coordination with the Japanese Akatsuki mission, currently in an equatorial orbit around the planet. In addition, a large ground-based campaign to observe Venus has been organized not only during the flyby, but also in August 2020, when Venus reaches its maximum elongation (45º), with an apparent size from Earth of 23-24 arcsec.
Because Venus has a dynamic atmosphere subject to the development of large-scale waves, small scale changes in its winds, and different cloud patterns, and because the views from BepiColombo and Akatsuki are obtained at different phase angles than those observed from Earth, context observations provided by amateur astronomers can significantly enhance the scientific return of the BepiColombo flyby. At the time of this writing (June 2020), we are organizing an additional ground-based amateur campaign to observe Venus during July-October 2020 to support the first Venus flyby. Observations in July will also be used to support the analysis of data acquired during the 3rd flyby of Venus by the Parker Solar Probe on 11 July 2020.
Amateur observations of Venus are regularly posted in the ALPO-Japan webpages (http://alpo-j.sakura.ne.jp/indexE.htm) and in the PVOL database of amateur observations (http://pvol.ehu.eus) and highlights will be posted in the BepiColombo ESA page dedicated to the flyby (https://www.cosmos.esa.int/web/bepicolombo-flyby/venus1flyby).
The campaign has two roads of collaborations. Firstly, we are encouraging amateur observers to observe Venus in July-October with a particular focus on observations at the end of August and in the week of the flyby. Secondly, we encourage amateur observers to apply for observations in the Europlanet Telescope Network (https://bit.ly/2Br5LDt), where observations of solar system targets and ground-based support of space missions are primary themes. The Telescope Network opened its call for observations on 1 June 2020 and it is open to applications from both professional and amateur astronomers. All applications are reviewed by a scientific board. If granted, the Europlanet Telescope Network will support travel, per diem costs, and local accommodation costs of up to two observers, as well as the incurred service costs of the telescope facilities. The network is also open to non-European participants.
Figure 1 summarizes the viewing geometry of Venus during July – October 2020. Amateur observations of the Venus surface are possible in July and August, and observations of the upper clouds in UV and near-infrared wavelengths are possible through July to October.
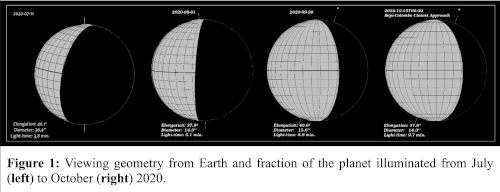
Figure 2 shows the trajectories of the BepiColombo and Akatsuki missions close to the Venus flyby. These different perspectives result in different geometries of the observations during the flyby as showed in Figure 3.
The Science potential of an Amateur Campaign
We have issued an observational alert and campaign through PVOL with communication of the amateur campaign using social networks such as Facebook amateur astronomy webpages and email lists such as ALPO, hstJupiter and others. The current campaign has been inspired by the excellent observations of Venus obtained during Spring 2020, and the successful scientific use of Venus amateur observations prior to the Akatsuki orbit insertion in 2015 [1] and during the Messenger flyby of Venus in 2007 [2]. Current studies of Venus atmosphere from Akatsuki also show the potential of amateur observations that complement data obtained by large telescopes or from dedicated spacecraft [3]. In this presentation we will show preliminary results of the observations obtained during July-August, perspectives for the closest approach on October 15 and further plans for a similar campaign during the second BepiColombo flyby of Venus in August 2021.
Updated information on the amateur campaign will be available on the PVOL website at: http://pvol2.ehu.es/bc/Venus/
Acknowledgements
Europlanet 2024 RI has received funding from the European Union’s Horizon 2020 research and innovation programme under grant agreement No 871149. Y.J. Lee has received funding from the European’s Union’s Horizon 2020 research and innovation programme under the Marie Sklodowska-Curie grant agreement No 841432. We are very grateful to the ensemble of amateur astronomers sending their data to PVOL and participating in international observation campaigns.
References
[1] Sánchez-Lavega, A., Peralta, J. et al., Venus cloud morphology and motions from ground-based images at the time of the Akatsuki orbit insertion. Astrophysical Journal Letters, 833, L7 (2016), doi: 10.3847/2041-8205/833/1/L7.
[2] Peralta, J., Lee, Y. J. et al. Venus's Winds and Temperatures during the Messenger's flyby: an approximation to a three-dimensional instantaneous state of the atmosphere. Geophys. Res. Lett., 44, 3907–3915 (2017), doi:10.1002/2017GL072900.
[3] Peralta, J., Navarro, T. et al. A Long-Lived Sharp Disruption on the Lower Clouds of Venus. Geophys. Res. Lett., 47, e2020GL087221 (2020), doi: 10.1029/2020GL087221.
How to cite: Garate-Lopez, I., Hueso, R., Lee, Y. J., Mangano, V., Jessup, K. L., Peralta, J., Sanchez-Lavega, A., Zender, J., Benkhoff, J., Murakami, G., and Scherf, M.: Amateur Ground-based Support of the first BepiColombo flyby of Venus, Europlanet Science Congress 2020, online, 21 Sep–9 Oct 2020, EPSC2020-1060, https://doi.org/10.5194/epsc2020-1060, 2020.
Abstract
We present the detection and evolution of a planet-scale Cloud Discontinuity on Venus for the first time from amateur data sensing the middle clouds of Venus during March/April 2020. The Cloud Discontinuity was observed mainly as a long vertical dark streak on the dayside hemisphere of Venus in amateur near-infrared images (NIR). Observations were obtained by small telescopes mainly from Greece and Ukraine. Amateur observations will continue in support of professional earth-based and spacecraft observations.
Introduction
The dayside upper clouds of Venus (56.5–70 km above the surface) can be observed in UV wavelengths and they drift to the west with velocities 60 times faster than the planet surface, a phenomenon known as superrotation. Imaging the dayside of Venus in the NIR spectrum (~750-1000nm) reveals the morphology and dynamics of the middle clouds (50.5–56.5 km), while longer certain windows at longer infrared wavelengths allow to sense the lower clouds (47.5–50.5 km) on nightside images. Lower-middle and upper clouds comprise the main cloud deck in the atmosphere of Venus. The middle and lower clouds move slower than the upper ones and they were poorly studied until JAXA’s Akatsuki mission. During the year 2016, Akatsuki revealed the presence of a giant discontinuity propagating on the middle and lower clouds. Mysteriously, this discontinuity (interpreted to be a new atmospheric wave), has not been observed on the middle clouds since December 2016.
Methodology
This preliminary analysis is based on measurements on the first available dayside images by authors, 3 by EK and 2 by YN, made in 5-day steps (the period needed for the same feature of middle atmosphere to be visible again) from 11 March to 31 March 2020. At that epoch (~21/3/2020) Venus presented solar elongation of 46°East, 23 arcsec in diameter, and 52% of illuminated disk. The amateur technique is based on the “lucky imaging” technique combined with special processing to increase contrast. The application WinJupos, was used for feature measurements and analysis.
Analysis
During March 2020, we detected and followed the re-apparition of the Cloud Discontinuity (hereafter CD). It was observed mainly as a long vertical dark streak on the dayside hemisphere of Venus (see Figure 1).
Figure 1: The first image of the March Cloud Discontinuity. It can be seen as dark vertical streak in the centre of the illuminated disc in the right image (E.Kardasis 11/3/2020 16:45-55 UT, 355mm SCT,ZWO 290MM, Right image 884-900 nm & left image UVenus filter, Glyfada-Athens, Greece)
On the 11th of March EK captured a long dark vertical feature (followed by a brighter streak), suspected to be a CD. We confirmed that it still existed 10 days later when the specific longitude was again observable. An alert was sent to worldwide observers. Previous observations presented not obvious signs of the event. The CD was observed until April 25th.
The CD spanned between ~30° S and ~30° N, with a total length ranging from ~4500-6500 km and 350-700km width. The CD drifted to the west at an approximate rate of -69° per day. Speed measurements were made between pair of images (March 11 & 16, March 16 & 21, March 21 & 26) separated by 5-day period. The average speed calculated with the three combination of images confirms that the CD seems to propagate with the same speed during March. The velocity gradually peaks at the equator, reaching ~84 ± 0,5 m/s. When comparing the CD speed with wind speeds of the middle clouds from past reports, we observe that the CD propagates faster than the the average zonal speed of the middle clouds. Finally, we report that the CD is not visible in simultaneous UV images of the upper clouds, confirming previous findings from Akatsuki.
Acknowledgements
We acknowledge the contribution of ALPO-Japan database, Grischa Hahn for providing support on WinJupos, and Iakovos-Marios Strikis for the technical support.
How to cite: Kardasis, E., Peralta, J., Maravelias, G., and Naryzhniy, Y.: Amateur observations of a planetary-scale wave in the middle clouds of Venus , Europlanet Science Congress 2020, online, 21 Sep–9 Oct 2020, EPSC2020-712, https://doi.org/10.5194/epsc2020-712, 2020.
Introduction
Many of Juno’s observations use external information to determine their context in space and time for the “snapshots” of usually very limited regions of the planet that it detects in its close approaches (“perijoves”, PJs). This has been the role of the campaign of supporting observations from the professional community, but it has always been bolstered by the near-continuous observations made by the increasingly sophisticated cadre of the world-wide amateur network. This year is one in which this role was particularly apparent.
Tracking Activity in Jupiter
Among the many areas of interest in Jupiter undergoing changes are the following.
Great Red Spot (GRS). Continuing activity follows on from remarkable interaction of small-scale anticyclones transported counter-clockwise inside the GRS Hollow throughout the spring and fall of 2019. These caused arcuate features, commonly called “flakes”, to appear on the western side of the GRS , which were likely to be material swept off the upper portions of the GRS itself [1]. JunoCam continued to record evidence of them during geocentric solar conjunction at PJ23, PJ24 & PJ25, and the amateur community has continued to monitor them in early 2020. We expect that this type of interaction will continue, as it is apparently tied to the secular longitudinal shrinkage of the GRS, with the results distinguishing between different models for the dynamical interactions involved [2,3].
Equatorial Zone Disturbance. The Equatorial Zone (EZ) was predicted to undergo a disturbance based on the cyclic nature of past events [4] with a major disruption of its bright visual and cold 5-µm appearance. Although the disruption of its 5-µm appearance did not happen, the EZ darkened in blue and UV light, and there was an increase in the thickness or altitude of an upper-atmospheric haze [5]. The amateur-observation record shows that a darker shade of its visual appearance is still present as this coloration episode declines. Juno scientists continue to be interested in the EZ to determine whether such events relate to changes in the remarkably deep-seated upwelling of air detected by the Juno Microwave Radiometer as a column of concentrated ammonia gas [6]. So we are interested in changes to the color, either a return to its normally bright appearance or a renewed darkening that might presage a true disruptive event that is simply “late”.
Outbursts. Two major outbursts of convective plumes were observed by JunoCam, one in the North Temperate Belt shortly before PJ2 [7] and another in the South Equatorial Belt near PJ4 [8,9] that was associated with lightning detections [10]. Such outbursts are of interest to Juno scientists. Hi-res amateur imaging also synergizes with JunoCam in characterizing smaller outbursts. One notable example, discovered just before this writing by Foster [11], was recorded in detail by JunoCam at PJ27, showing some morphological similarities with the initial development stages of terrestrial tropical storms.
Overcoming COVID-19 Disruptions
For recent Juno orbits, low-latitude regions are observed at extremely oblique angles except during perijoves when off-Earth pointing of the spacecraft is adopted. These are chosen carefully because they use up fuel that the Juno science team would like to reserve for an extension of the mission. A single orbit in 2020, chosen for such a turn at PJ26 on April 10, turned out to be in the middle of the COVID-19 pandemic when nearly all professional observatories scheduled to provide Juno support were shuttered. Except for two semi-automated observatories and Hubble Space Telescope, whose ground crew were deemed “essential”, it was the amateur community who provided the only information about Jovian variability during this time. This was also true for PJ27 on June 2, when a few more professional observatories opened.
Future Prospects
We hope for continued support from the amateur community. Scientists on the Juno mission hope to persuade NASA to fund an extension; one candidate scenario could extend out to PJ70 in late 2025. This would not only extend the time line for continued observations of atmospheric evolution but would take advantage of different types of observations not possible during the primary mission, due to orbital geometry. We would hope observations by this community would continue to provide the continuity of atmospheric scrutiny from which we have benefitted so far.
References
[1] Foster et al. 2020. The Great Red Spot in 2019 and its interaction with retrograding vortices as monitored by the amateur planetary imaging community. https://britastro.org/node/22552
[2] Sanchez-Lavega, et al. 2019. Jupiter’s Great Red spot threatened along 2019 by strong interactions with close anticyclones. Amer. Geophys. Union meeting. P44A-01.
[3] Marcus, et al. 2019. On the shedding of flakes by Jupiter’s Great Red Spot: It is not dying. Amer. Geophys. Union meeting. P13B-3505.
[4] Antuñano, et al. 2018. Infrared characterisation of Jupiter's equatorial disturbance cycle. Geophys. Res. Lett. 45, 10987-10995.
[5] Orton, et al. 2019. Juno and Juno-supporting observations of Jupiter’s 2018-2019 Equatorial Zone disturbance. EPSC-DPS2019-109.
[6] Li et al. 2017. The distribution of ammonia on Jupiter from a preliminary inversion of Juno microwave radiometer data. Geophys. Res. Lett. 44, 5317-5325.
[7] Sanchez-Lavega et al. 2017. A planetary-scale disturbance in the most intense Jovian atmospheric jet from JunoCam and ground-based observations. Geophys. Research Lett. 44, 4679-4686.
[8] de Pater et al. 2019. First ALMA millimeter wavelength maps of Jupiter, with a multi-wavelength study of convection. Astronomical Journal. 158, 139 (17pp).
[9] Wong, et al. 2020. High-resolution UV/optical/IR imaging of Jupiter in 2016-2019. Astrophys. J. Suppl. Ser. M. H. Wong, et al. 2020. High-resolution UV/optical/IR imaging of Jupiter in 2016-2019. Astrophys. J. Suppl. Ser. 247:58 (25 pp).
[10] Brown et al. 2018. First detection of lightning sferics from Jupiter reveals new insights into the global distribution of moist convection. Nature 558, 87-90.
[11] Foster et al. 2020. A rare methane-bright outbreak in Jupiter’s South Temperate domain. EPSC2020.
How to cite: Orton, G., Momary, T., and Rogers, J.: The Role of Amateur Astronomers in Documenting the Spatial Context and Time Evolution of the Jovian Atmosphere to Benefit the Juno Mission, Europlanet Science Congress 2020, online, 21 Sep–9 Oct 2020, EPSC2020-174, https://doi.org/10.5194/epsc2020-174, 2020.
Introduction
The Juno mission has given the first opportunity to characterise the flow patterns in Jupiter’s south polar region (SPR). Fast winds can be measured by comparing hi-res JunoCam images over up to 2 hours within a single pass, which shows in detail the motion of the southernmost jet at 64ºS (all latitudes planetocentric), and the circulations of cyclonic folded filamentary regions (FFRs) and anticyclonic white ovals (AWOs) further south [1]. However, Juno data cannot trace slower motions, in particular the drifts of these coherent circulations over days to months. Over the 53-day interval between perijoves a few AWOs can be recognised, but the interval is too long to recognise individual FFRs, which are the dominant structures of this region. The best amateur ground-based images now have sufficient resolution to identify and track some of these features. Here, we use maps and measurements from amateur images in 2016-2020, combined with JunoCam maps that provide secure identification of the features. Thus we find that pale patches in ground-based images usually represent FFRs in Juno maps, and some small light spots are AWOs.
Measurements of drifts of FFRs over days (e.g. Fig.1)
From hi-res images by several amateur observers, we made south polar projection maps using WinJUPOS [2]. From blinking and animating these maps, we find that features in the SPR could only be tracked using v-hi-res images at intervals of less than 5 days; FFRs cannot be confidently identified over longer gaps as they change shape and position rapidly, although they may last for weeks. With maps spaced by 2-4 days, it is possible to observe their zonal motions and changes in outline. This is best done within a few days of a Juno perijove so that the features can be identified in the Juno map.
We selected several short series of maps in 2018 April-May and 2020 April-June that gave the clearest results, mostly using I-band images by A.C. as these were most consistent. Preliminary results show:
--Features at ~60-65ºS are prograding (around the S6 jet at 64ºS).
--Features at ~66-74ºS are retrograding (including FFRs in the belt), with speeds comparable to those of the AWOs (see below).
-- Around 66ºS, where JunoCam images often show FFRs in the belt apparently extending north towards the S6 jet, they can sometimes be observed being sheared accordingly, with the north part of the FFR prograding close to the jet (e.g. Fig.1).
Measurements of drifts of AWOs at ~70-74ºS over weeks to months
The JunoCam maps (e.g. Fig.1) show several AWOs in this latitude range at every perijove. We have tracked these white ovals from 2016 to 2018 using positions from JunoCam (our maps) and ground-based images (measurements and maps by the JUPOS team) plus a few from HST (OPAL maps). Fig.2 shows part of the chart.
The largest AWO (A) has been tracked from 2015 (pre-Juno) to 2020. Some other ovals have probably existed for at least 8 months each, regardless of latitude, although small ones cannot always be tracked between perijoves. Some ovals have merged or disappeared within the first two years of the Juno coverage. Others are seen passing each other in different latitudes in Juno maps, although we cannot tell which is which thereafter. There are also even smaller AWOs and eddies, so there may be rapid turnover by growth, wandering in latitude, and mergers or disappearance.
The resulting zonal drift profile (ZDP) is in Fig.3. These AWOs move with essentially uniform retrograde flow from 69.5-72.4ºS, [in L3, +42 (±3) deg/53d, -3.8 to -3.2 (±0.25) m/s], but at higher latitudes, above 72.4ºS, they show a steep gradient to faster (prograding) speeds. The highest-latitude and fastest speeds (spots P & E’: Fig.3) are close to those of small AWOs that drift irregularly around the periphery of the south polar pentagon of cyclones at ~80ºS [3]. There we found one shift of -44 deg in 53d, and several of ~-29 deg in 53d.
Conclusions
The main belt of FFRs is retrograding, along with the AWOs on its S edge. On its N edge, disturbance from FFRs often extends north to the S6 jet and is entrained by the prograding jet.
The ZDP (Fig.3) resembles that of high-latitude northern domains (N4, N5)[4], so the belt of FFRs and the loose ring of AWOs just south of it partially retain the organised structure of regular domains, although unconfined towards the pole.
South of 73ºS, long-term zonal drifts of AWOs become prograding with a steep gradient of mean speed increasing towards higher latitudes, where it becomes comparable to drifts of AWOs around the polar pentagon.
A companion abstract in the OPS1 session [1] describes the short-term wind measurements derived from the JunoCam maps at individual perijoves.
References
Figure 1. Examples of maps used for tracking FFRs in 2018.
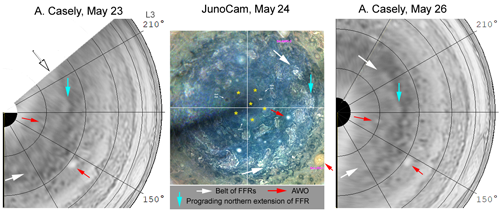
Figure 2. Excerpt from chart tracking AWOs. (L2 moves at +8.0º/30d relative to L3.)
Figure 3.
How to cite: Rogers, J., Casely, A., Adamoli, G., Jacquesson, M., Vedovato, M., Bullen, R., Mettig, H.-J., Eichstädt, G., Hansen, C., Orton, G., and Momary, T.: Jupiter’s south polar region (~60-75ºS): Medium-term flow patterns from amateur and JunoCam maps, Europlanet Science Congress 2020, online, 21 Sep–9 Oct 2020, EPSC2020-153, https://doi.org/10.5194/epsc2020-153, 2020.
Introduction
Energetic, high altitude eruptions in Jupiter’s atmosphere, which we refer to as outbreaks, are not uncommon in the North and South Equatorial Belts (NEB and SEB) as well as higher latitudes. However, few have been observed in the Temperate regions. An intense methane-bright outbreak in the South Temperate Belt (STB) latitudes was observed by the lead author on 2020 May 31. Although the outbreak, which would become known as “Clyde’s Spot” in the Pro-Am planetary community, faded quite rapidly in methane wavelengths, developments were monitored by the amateur community over the following weeks. The outbreak occurred two days prior to the Juno Perijove 27 flyby, and close Pro-Am collaboration resulted in very high-resolution images of the outbreak being obtained by the JunoCam imager during the flyby.
Outbreak detection
The outbreak occurred in the southern part of a pre-existing small white spot at 31⁰S, embedded in a pale grey streak, and suspected of being a cyclonic vortex and was detected early on the 31 May. Observations from other amateurs confirmed that the outbreak had occurred within the previous 10 hours. It was only slightly brighter than before in RGB, but extremely bright in the 0.89 micron CH4 absorption band. It remained methane-bright though much weaker over the following rotations, and from June 1 onwards appeared to consist of two (individually unresolved) parts which moved gradually apart up to June 6, mostly in the E-W direction but with slight cyclonic rotation from June 1-3.
NASA Juno PJ27
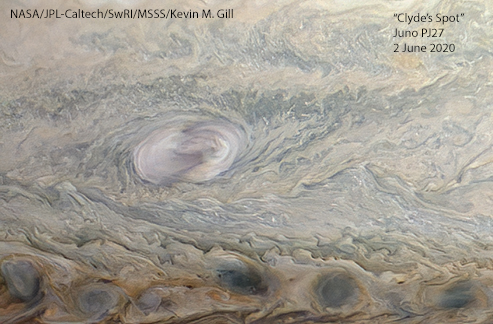
The JunoCam images on June 2 showed Clyde’s spot as an unusual, roughly oval, bright spot in RGB and CH4, with brighter arcs in its E and W ends that were the pair of methane-bright spots in ground-based images. The spot does not show popup clouds but is marked by numerous concentric arcs which could represent gravity waves in the expanding high-level white cloud (A. Casely). Surrounding streaks confirm that it is within a strongly cyclonic vortex, although it may be over-riding those streaks on the S side.
Outcome of the outbreak
Amateur images from June 2-3, only small spots at the site of the initial eruption. From June 3 to June 13, v-hi-res images showed at least one white spot and one very dark spot; they changed rapidly in detail, possibly with cyclonic motion. No obvious changes have developed outside this site, apart from appearance of thin blue-grey lines close to the STBn and STBs jets for ~13 deg west Clyde’s spot. In methane images, by June 11 the appearance had reverted to a short oblique methane-dark streak with no bright spot, as it was before the eruption.
Cycles of STB Structured sectors
This spot erupted tens of degrees east of the only large anticyclonic oval in this domain, Oval BA. Small cyclonic spots have repeatedly arisen here in the last 20 years and expand to form structured sectors of the STB, which persist as large cyclonic segments for several years until they catch up with Oval BA from the west side. Although a new structured sector has been anticipated, it was only ground-based images early in 2020 that showed two new features which could be its precursors. One was a small, very dark spot ~40⁰ east of BA, which persists; the other was the faint oblique streak, centred on a tiny white spot, ~80⁰ east of BA. Clyde’s spot erupted in this latter white spot. Therefore, this eruption may be a previously unknown feature of a cyclonic vortex in this transitional location and stage. Although the outbreak was very short-lived, implying similar outbreaks might be occurring unobserved, its occurrence in this location suggests that it was significant.
The outbreak in the context of previous outbreaks.
The only similar methane-bright outbreaks previously recorded in the cyclonic STB latitudes were in large structured sectors at the end of their life: the so-called STB Remnant in 2010 and the STB Ghost in 2018 [1,2]. These generated rapidly expanding disturbances that converted these long cyclonic circulations into dark turbulent STB segments. In contrast, Clyde’s spot, being in a very compact cyclonic vortex, has remained confined in its immediate vicinity and has not developed further (as of 2020 June 22).
Similar plume outbreaks occasionally occur in small but stable cyclonic vortices in the SEB. This was the way in which at least two recent SEB Revivals [2007, 2010] and two mid-SEB outbreaks [1979, 2017] began, and it is possible that they always do so.
Conclusion
This was a single, very energetic plume eruption within the small cyclonic spot. Over the following days the plume expanded locally, and disturbance continued at the original site, but there is no evidence of substantial wider changes. This contrasts with the results of the similar eruptions within larger circulations, which were rapidly converted into turbulent dark STB segments. Clyde’s spot was a brief event, never conspicuous in visible light, but detected because of frequent monitoring with methane images. It may represent a previously unknown type of eruption in a small cyclonic spot in the early stages of development of a STB structured sector. An update will be provided in the presentation.
Figures:
‘Clyde’s spot’ in 889 nm methane band (left) and RGB (right): (Top) initial detection from C.F. on 31 May 2020; (Bottom) closeups from JunoCam on 2 June 2020.
References:
How to cite: Foster, C., Rogers, J., Mizumoto, S., Orton, G., Hansen, C., Momary, T., and Casely, A.: A rare methane-bright outbreak in Jupiter’s South Temperate domain, Europlanet Science Congress 2020, online, 21 Sep–9 Oct 2020, EPSC2020-196, https://doi.org/10.5194/epsc2020-196, 2020.
Impact detection on Jupiter through amateurs’ processing of their own videos using DeTeCt
(delcroix.marc@free.fr)
(1) Societé Astronomique de France, Paris, France
(2) Université Cheikh Anta Diop, Dakar, Sénégal
(3) Observatoire de Paris, IMCCE, Paris, France
(4) Física Aplicada I, Escuela de Ingeniería de Bilbao, UPV/EHU, Bilbao, Spain
(5) Institut de Recherche pour le Développement, UMR5563, Géosciences Environnement Toulouse, IRD, CNRS et Université Toulouse III, Toulouse, France
Since 2010, amateur astronomers have discovered six flashes in Jupiter caused by the entry of small bodies in Jupiter’s atmosphere [1-5]. The last of these impact flashes was discovered thanks to a pro-am collaborative project called “DeTeCt”. This project is based on a software tool released to the amateur community that allows the observers themselves to analyze their video observations.
The software DeTeCt performs differential photometry to find sudden brightness variations, generates a detection image and a report. The detection image allows the users to do a quick look of the analysis and the reports and detection images are sent to two of us (MD, SS) for in depth analysis and statistics of the positive and negative detections. In this work we will see the latest evolutions of the project presenting the new features in the software, details of the detection algorithm and changes in the methodology of the statistical analysis.
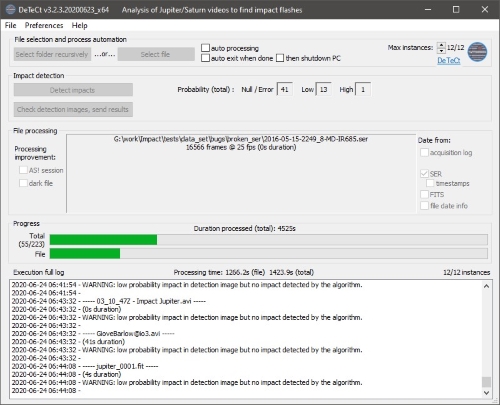
Fig. 1: New GUI in the DeTeCt software.
This project has accumulated data acquired over 17 years of Jupiter observations. The total time covered by the videos analyzed is equivalent to 5 full months of observations. This has been possible only thanks to the active participation of a hundred of amateur astronomers worldwide. The accumulated time analyzed in the project allows a more accurate estimation of the impact frequencies on Jupiter [4]. The project website (http://www.astrosurf.com/planetessaf/doc/project_detect.php) maintains up to date results of the statistical analysis, and provides the software to download.
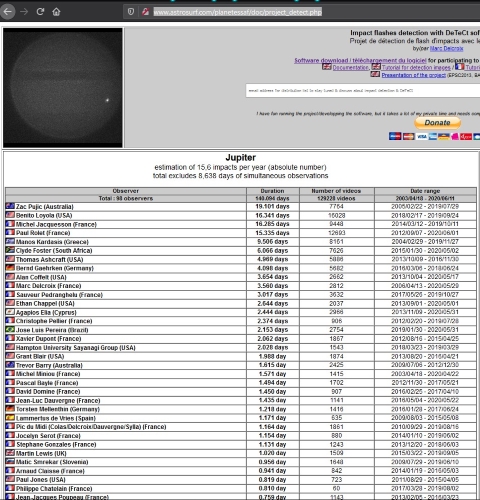
Fig. 2: Webpage of the project with statistics, estimation of the impact frequency and links to software and tutorial.
Additionally, observational campaigns were organized at Pic du Midi to acquire Jupiter and Saturn videos taking advantage of the excellent seeing of the site of observation. A large number of positive detections is expected based on the combination of an excellent seeing and the large diameter of the telescope (with respect to other observations campaigns, amateur astronomers’ telescopes diameters range from 15 to 50cm). The observation campaigns were generally organized around the opposition of Jupiter when the planet was high in the sky. Each night we could acquire at least two hours of video recording of the planet.
The scientific analysis of the different impacts allows to estimate the impact bodies in terms of the released energy and mean mass, which translates in ranges of possible sizes and density. Light curves of the more recent impacts allow to study impact fragmentation and possible densities of the impact body [5].
This project showcases the usefulness of amateur astronomers’ observations, who provide unique essential data for this scientific work.
References
[1] Hueso R. et al., 2010, «First Earth-based detection of a superbolide on Jupiter», The Astrophysical Journal Letters, 721, L129-L133.
[2] Hueso R., et al. (incl. M. Delcroix), 2013, «Impact flux in Jupiter: From superbolides to large-scales collisions», Astronomy & Astrophysics, 560, A55.
[3] Hueso R., M. Delcroix et al.,2018a, « Small impacts on the Giant planet Jupiter », Astronomy & Astrophysics 617, A68 pp1-13.
[4] Hueso R., del Rio-Gaztelurrutia, Sánchez-Lavega, Delcroix M. et al. 2018b, « Detectability of possible weather effects on Mars upper atmosphere and meteor impacts in Jupiter and Saturn with small telescopes », Journal of Space Weather and Space Climate, 123,3020-3034
[5] Sankar R. et al. (incl. M. Delcroix) 2020, « Fragmentation modelling of the August 2019 impact on Jupiter », Monthly Notices of the Royal Astronomical Society, 2020
How to cite: Delcroix, M., Sylla, S., Hueso, R., Colas, F., and Baratoux, D.: Impact detection on Jupiter through amateurs’ processing of their own videos using DeTeCt, Europlanet Science Congress 2020, online, 21 Sep–9 Oct 2020, EPSC2020-775, https://doi.org/10.5194/epsc2020-775, 2020.
NOAK Observatory, Stavraki (IAU code L02) Ioannina, Greece (nsioulas@hotmail.com)
Introduction
In this work, the astrometric observations of four asteroids will be presented which took place on 2019 from NOAK observatory located at Stavraki in Greece. The results and the procedure of submitting the measurements to MinorPlanetCenter will be discussed.
Abstract
Astrometry is the measurement of positions, parallaxes and proper motion of an astronomical body. Especially the astrometry of Near Earth Objects (NEO) demands great accuracy and the cooperation between the professional and amateur astronomers for better results. All these objects that need confirmation are listed in the Near Earth Object Confirmation Page (NEOCP) and in the Possible Comet Confirmation Page (PCCP) at the site of the Minor Planet Center (MPC). When an object is confirmed, then a Minor Planet Electronic Circular (MPES) is published, including observations, the observers details and the orbital elements of the object. Due to the high number of the objects that need confirmation is important to use all available telescopes to track them.
My amateur observatory participates in the effort to record all these objects in the Solar System. The Observatory also conducts observations of various objects and other phenomena such as exoplanet transits contributing to the Ariel Space Mission with the Exoclock Project. However, the main goal of the observatory is to conduct asteroid and comet photometry and the methods, observations and results will be discussed in this presentation.
The observatory is registered in IAU as L02, «NOAK Observatory, Stavraki», in the town of Ioannina, Greece.
Acknowledgements
I would like to thank Anastasia Kokori and Angelos Tsiaras for encouraging me to publish my work and for their advice.
References
[1] Minor Planet Center: https://www.minorplanetcenter.net/
[2] Astrometrica: http://www.astrometrica.at/
[3] Roger Dymock: Asteroids and Dwarf Planets
[4] Brian D. Warner: A Practical Guide to Lightcurve Photometry and Analysis
[5] Project Pluto: https://www.projectpluto.com/
[6] NEODyS-2: https://newton.spacedys.com/
[7] Center for Near Earth Objects Studies: https://cneos.jpl.nasa.gov/
How to cite: Sioulas, N.: Astrometric observations of Near Earth Objects and Minor Planet Center, Europlanet Science Congress 2020, online, 21 Sep–9 Oct 2020, EPSC2020-24, https://doi.org/10.5194/epsc2020-24, 2020.
The Rosetta Mission invited amateur astronomers to be part of a ground-based observing campaign for Comet 67P/Churyumov–Gerasimenko. Amateurs, with greater access to telescope time and wider geographical coverage, can add important temporal coverage and wider scale observations to complement those of professional astronomers. They add the bigger picture. This allows for greater multi-scale analysis of comet activity.
This campaign followed on from campaigns in support of the Halley-related and Deep Impact Missions, as well as general comet observing campaigns such as for Comet C/2012 S1 ISON.
With 67P coming back shortly, and future comet missions such as Comet Interceptor being planned, there is an opportunity to consider the effectiveness of the 67P amateur campaign, a related 46P/Wirtanen schools’ observing campaign, and draw lessons from these and previous comet and other Pro-Am campaigns to inform good practice for future campaigns.
Feedback has been sought, via 3 surveys, from those who took part in the 67P and 46P campaigns, and from amateur astronomers who might be encouraged to take part in future campaigns. The survey results will be presented, along with reflections from some of amateurs involved, and a discussion of how future campaigns may be made most effective.
How to cite: Usher, H., Snodgrass, C., Roche, P., Norton, A., Angel, T., Clark, W., and Yanamandra-Fisher, P.: Comets: Seeing The Bigger Picture – Maximising the Contribution of Amateurs, Europlanet Science Congress 2020, online, 21 Sep–9 Oct 2020, EPSC2020-849, https://doi.org/10.5194/epsc2020-849, 2020.
Since the discovery of the first transiting Exoplanet in 1999, shortly after the initial discovery by the radial velocity method, over 3189 such systems have been discovered. As a result in recent years the field has started to transition from a discovery phase to one of characterisation and understanding more about the planets discovered. Ground based surveys with very small telescopes have been extremely successful discovery machines but the majority of known transiting exoplanets were discovered by the space borne Kepler and K2 missions, a legacy that is continuing with the NASA TESS mission. Consequently the field of transiting exoplanet science is now a target rich environment, which combined with the relative scarcity and competition for professional telescope time, provides an ideal opportunity for participation by citizen scientists. In this context a citizen scientist is a person or group with access to, and the knowledge to use, the equipment required to make precise photometric observations, whether this is their own telescope or through the use of shared , educational or commercial facilities.
Exoplanet science is a field that excites and captures the imagination of both the general public, amateur astronomers and students alike. Arguably the most successful project supporting citizen scientist participation has been the Exoplanet Transit Database (ETD) run by the Czech Astronomical Society since 2009 the database has accumulated over 10,000 lightcurves of 350+ exoplanet systems, contributed mostly by an army of nearly 1200 globally distributed amateur observers. Although originally created as a way to search for transit timing variations, the wealth of data gathered has been used by professional astronomers including searches for orbital period decay or apsidal precession in transiting hot Jupiters. The network of observers has also resulted in a number of pro-am collaborations producing exciting results such as the discovery of TrEs-5c.
One of the key missions planned for this decade to help characterise transiting exoplanet atmospheres is the ESA medium class mission ARIEL (Atmospheric Remote-sensing Infrared Exoplanet Large-survey satellite), scheduled for launch sometime in 2028. This ambitious transit spectroscopy mission aims to measure the spectra of over 1000 transiting exoplanet atmospheres to better understand their chemical composition, their formation and evolutionary histories and the links between the planets and their stellar environment. To help achieve this, precise knowledge of all 1000+ planet ephemerides is required to optimise the science return from the 4-year mission. The Exoclock project is an initiative run by the ARIEL Ephemerides Working Group to focus and coordinate both professional and citizen scientist observations of exoplanet transit light curves to measure transit mid-times and to monitor the stellar variability of the host stars for all the systems on the ARIEL target list. To this end the Exoclock team have created a suite of tools, guides and educational material to help widen participation, target those systems most in need of observations and provide homogenous results to allow accurate scheduling of ARIEL observations. ARIEL is by no means the only space science mission eliciting support from the citizen scientist and amateur astronomy community with projects also being run for the follow up of TESS observations and the PLATO amateur collaboration project.
In this presentation I will review the growing need for citizen scientists to support flagship exoplanet science missions and look at results of some successful pro-am collaborations highlighting the contribution made by citizen scientists. Using results obtained from multiple ~0.4m telescopes I will look at opportunities for maximising the science return from the observations obtained.
How to cite: Salisbury, M.: Citizen Scientist Participation in Transiting Exoplanet Science, Europlanet Science Congress 2020, online, 21 Sep–9 Oct 2020, EPSC2020-363, https://doi.org/10.5194/epsc2020-363, 2020.
Variable Star and Exoplanet Section of Czech Astronomical Society (VSES CAS) is a citizen astronomy organization with almost century tradition in basic and advanced research on variable stars in Czech Republic. Members are formed both amateur and professional astronomers all age groups, including youths and students. VSES CAS is primary focus on observing variable stars and exoplanet, education and training of astronomers. The society annually organizes workshops, meetings or conferences for astronomers and many popularisation activities intended for general public. Many amateur astronomers also meaningfully contribute to professional astronomy with unquenchable enthusiasm, precise photometry reduction or acquiring photometric data with hardware similar to professional surveys.
Some of the VSES projects have global impact. Database B.R.N.O. collects data of light curves of eclipsing binaries from observers. Since 2007, more then 19,000 minima timings from hundreds observers has saved to database. After revision, the contribution of times of minima are regularly published in Open European Journal of Variable Star. Project MEDUZA was focused on long-period variable stars. The database contains observations more then 1346 objects obtained both visual and CCD methods. The most important international project is Exoplanet Transit Database (ETD). The database administrators are periodically checking for new transits - both in literature and in on-line internet sources. The ETD also offers modern online fitting tool for publication of data of observers. Observers can plot their own observations in diagrams, finding out parameters HJDmid, depth, duration or global transit predictions. From 2008 to now, more then 8400 transits observed by observers from around the world are published in ETD.
The members of VSES CAS operate and develop the observing remote-controlled setup of Newton 150/750 telescope and cooled CCD camera situated in Valasske Mezirici Observatory. The telescope is used mostly for observing campaigns, cooperation with profesional astronomers or student research projects. The results obtained using this telescope was also published in several international projects. Recently, the telescope is mostly used for follow-up observations of TESS exoplanet candidates.
In VSES, we have now started developing a new generation of our web application. One of the goals is improved user experience and consolidation services, which were put together over a long time and using some now outdated technologies. New applications should reflect recent trends in modern astronomy and represent complete service for data processing, publishing observations, cloud storage, platform for campaigns and projects also social network between observers in around the world.
New pro-am international cooperation on projects of variable stars and exoplanet, and important results of VSES members will be also presented.
How to cite: Honkova, K. and Walter, F.: Importance of citizen Czech Astronomical Society for variable star and exoplanet research, Europlanet Science Congress 2020, online, 21 Sep–9 Oct 2020, EPSC2020-857, https://doi.org/10.5194/epsc2020-857, 2020.
ABSTRACT
It has been observed, mostly from the findings of the Kepler mission, that the vast majority of Earth-like exoplanets, and small planets in general, are formed very close to their host stars. This comes into contradiction with the cases of planets in the size of Neptune and bigger that most likely form at longer distances and migrate closer to the star over time. Based on the findings of the Kepler telescope, it is suggested that there is a relationship between the radius and the formation distance. The bigger the radius, the greater the distance at which the planet will form, and the smaller the radius, the smaller the distance from the host star. In this work, we present an empirical approach for the derivation of the density for habitable-zone exoplanets with radii 0.6-1.5 Earth radii, without the knowledge of the mass of the planet. The 1.5 Earth radii limit was selected as objects up to this size are believed to be rocky. In general, it seems that, up to this limit, gravity continues to accumulate and compress matter, and as a result, density increases. This can also be observed for planets within the Fulton Gap (1.5–2.0 Earth radii). The densities of such objects most likely is the result of accreting heavier elements and of the existence of a core consisted of iron or other ferromagnetic compounds. For bigger planets the possibility of sustaining a solid surface decreases, but there is still some uncertainty on whether they are rocky or gaseous. Following the above, we present additional empirical approaches for the derivation of density for all exoplanets with radii 0.6-3.0 Earth radii. We split these planets in three categories: 0.6-1.5, 1.5-2.0 (Fulton Gap), and 2.0–3.0, regardless of the planets' orbital position.
1. INTRODUCTION
We experimented with a mathematical formula to derive the density of rocky exoplanets that are transiting, focusing to:
1) the absence of Doppler spectroscopy data. Knowing the density helps to directly derive the mass as we already know the radius (and as a result, the volume) from the observed transit dips. Our solution proved to be effective for the majority of transiting rocky exoplanets of our sample (Table, page 2) with a maximum radius of 1.5 Earth radii, given that such planets lie within the conservative habitable zone of their host stars.
2) cover the range of densities 2.9-8.5 g/cm3. The observables we use for our solution is the orbital period expressed in days, the mean motion of the exoplanet expressed in radians, and a factor that is related to, and dependent upon, the exoplanet/Earth radius ratio, expressed in Earth radii. We applied our mathematical expression for rocky-type exoplanets in the conservative habitable zone, and we saw the results to be close to the published values for many transiting exoplanets and candidates that are orbiting their parent stars inside their circumstellar, conservative habitable zones.
2. APPLICATION OF THE EXPRESSION FOR DENSITIES
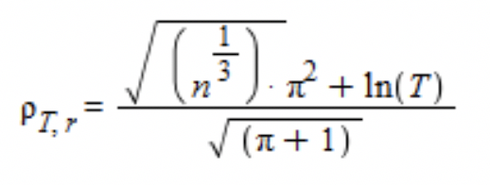
We experimented with known predicted values for objects added to the HEC (Habitable Exoplanets Catalog) catalogue and we found our results to be in good agreement with the published values. As we are focused on the exoplanet discoveries made by Kepler, we developed our mathematical expression in absence of Doppler spectroscopy measurements for the vast majority of these exoplanets. The density formula for rocky exoplanets inside the habitable zone is:
where n=(2π)/Τ, with T expressed in days. For stars with effective temperatures lower than 0.7 times that of the Sun’s, the formula includes the ratio TSun/Tstar as a denominator.
It is important, though, in case of Earth-like planets that orbit M stars, to solve with both expressions for density. The reason is that M stars tend to allow the formation of Earth-like planets in a wide range of densities, e.g from planets like Trappist-1f (3.5 g/cm3) to planets like LHS-1140 b.
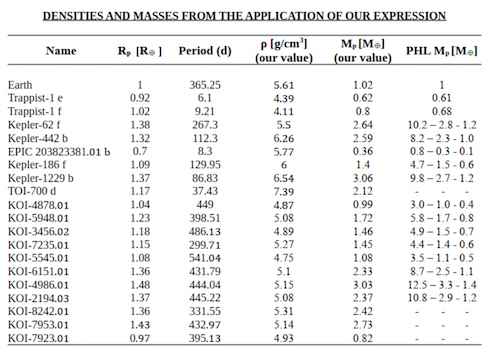
We applied our expression for densities for a list of 20 habitable-zone transiting exoplanets, and the results are shown in the table below. We also attempted to apply the first expression to the inner planets of the solar system, despite Mercury and Venus are not inside the habitable zone of the Sun. The deviations from the real values were ~12% for Mercury, ~3% for Venus, ~2% for the Earth and ~7% for Mars.
3. GENERAL EXPRESSIONS FOR EXOPLANETS BETWEEN 0.6 AND 3.0 EARTH RADII
a) Terran planets (0.6-1.5 Earth radii)
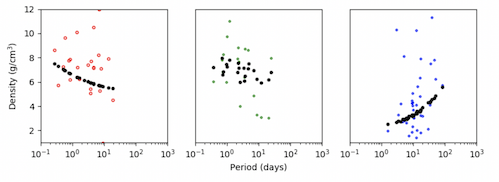
The general expression we use for the sub-category of Earths covers the range of densities 5.5-7.5 g/cm3. The expression makes use only of orbital period T (days), one of the two main observational parameters (together with the radius), extracted from the light curves. In this expression, as the orbital period increases, density tends to decrease, and vice versa. This is normal and correlates to other naturally inversely proportional ratios (ρ/r and m/r).
b) Exoplanets in the Fulton Gap (1.5-2.0 Earth radii)
The expression we use to calculate the densities for exoplanets inside the Fulton Gap makes use of both the radius rexo (Earth radii) and the orbital period T (days). It covers the range 6.0-8.5 g/cm3.
c) Exoplanets above the Fulton gap (2.0-3.0 Earth radii)
The expression for the exoplanets of this sub-category makes use of orbital period, T (days) and the radius rexo (Earth radii). It covers the range 2.9-5.5 g/cm3.
The diagram below shows a comparison between the measured densities for 89 exoplanets with known masses (with 30% maximum uncertainty) and the results of our formulas. For 62% of those planets the formulas give results with a deviation less than 30% (with data from exoplanet.eu).
ACKNOWLEDGEMENTS
The author expresses his gratitude to his friend Anastasia, especially, for all the encouragement to transform this idea into a work, as well as for her support during this effort; his brother Harry, also for being supportive; Dr. Angelos Tsiaras for his interest on this work, and the frequent communication with the author.
How to cite: Mantanikas, Y.: On an Empirical Mathematical Approach to the Densities of Small Transiting Exoplanets , Europlanet Science Congress 2020, online, 21 Sep–9 Oct 2020, EPSC2020-537, https://doi.org/10.5194/epsc2020-537, 2020.
Planetary sciences is an exciting part of astronomy, and even though space missions are nowadays providing high-quality data from remote and in-situ measurements of the planets, asteroids and comets, ground-based observations are still yielding exciting results by providing crucial data sets for a better understanding of the diverse bodies in the Solar System. The discovery of thousands of exoplanetary systems during the last few decades further enhances the need for ground-based observations, collaboration between small telescope facilities and for strengthening the contribution of amateur astronomers to planetary sciences.
Access to the Europlanet Telescope Network
As part of the recently launched Europlanet 2024 Research Infrastructure (EPN 2024 RI; https://bit.ly/2Z1XA8u), a new collaboration between telescopes around the world has been started for providing coordinated observations and rapid responses in support of space missions and in following-up of new events. The so-called Europlanet Telescope Network (https://bit.ly/37SCiyj) will thereby provide professional scientists and amateur astronomers with access to an initial set of 16 telescope facilities (see Fig. 1) up to 2 m in diameter. While the network plans to draw in additional facilities and to build new collaborations, particularly in regions that are currently under-represented in planetary sciences, scientists and amateurs can now apply to visit those facilities that are already participating in the network and have their expenses reimbursed for the time needed to make their observations. This also comprises the possibility of remote observations since the network includes some robotic or remotely operated facilities. The Call for Observations (see website: https://bit.ly/2Br5LDt) runs from June 2020 until the end of 2023, and is coordinated through EPN 2024 RI, which is funded by the European Commission’s Horizon 2020 program.
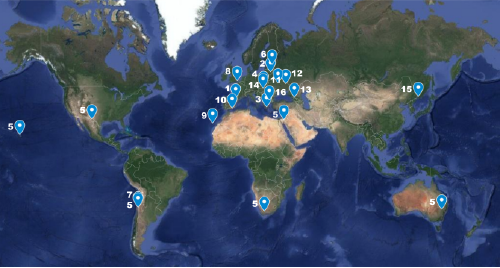
Fig. 1: The Europlanet Telescope Network (see also Section The Telescopes).
Supporting Amateur Astronomers
Besides fostering collaboration and providing access to small telescope facilities, the Europlanet Telescope Network also plans to support the integration of amateur astronomers into planetary sciences, since their observations can be of crucial importance for several scientific areas. Planetary atmospheres, for instance, is a field that benefits intensively from amateur astronomers. Their regular observations at high-spatial resolution are used by researchers to perform detailed studies of the atmosphere dynamics of Jupiter and Saturn and surveys of atmospheric activity on Neptune. They also provide excellent coverage of dust storms on Mars and complementary observations of Venus to space missions that observe over different viewing geometries. The accumulated observing time provided by amateurs makes it likely that unexpected events (such as convective storms on Jupiter and Saturn; impacts on Jupiter) are discovered by amateurs faster than by orbiting spacecraft or regular ground-based observation programs. Many amateurs supply their data to public data repositories that cover multiple planets like ALPO-Japan (http://alpo-j.sakura.ne.jp) or PVOL (http://pvol2.ehu.es/pvol2) on a daily basis, resulting in extremely fast follow-ups of interesting events. Space missions like NASA’s Juno keep excellent interactions with amateur astronomers that provide a large amount of observations to the mission through a dedicated website (https://www.missionjuno.swri.edu/junocam) used by Juno’s scientists to target some of their high-resolution observations.
Advanced asteroid studies by using the GaiaGOSA web service (gaiagosa.eu) is another important example on how amateur observers can help planetary scientists. The photometric observations of asteroids provided by amateurs are essential for the determination of rotation periods. Data gathered from a few oppositions allow to determine detailed physical parameters that are crucial for determining the nature of these particular objects such as spin axis orientation, shape, and size, but also for verifying our understanding of the history of the Solar System. Recently, the data gathered by amateur observers helped to determine more precise shapes and volumes of 13 asteroids (Podlewska-Gaca et al., 2020, A&A, id.A11; see also Fig. 2) and to reveal the true nature of asteroid (10) Hygiea, which turned out to be a perfect candidate for a dwarf planet rather than an asteroid (Vernazza et al., 2020, Nature Astr., 136-141).
Fig. 2: The shape of (68) Leto asteroid determined with help of GaiaGOSA observers.
The Telescopes (Fig. 1):
Further information available at https://bit.ly/2Br5LDt.
Acknowledgements:
Europlanet 2024 RI has received funding from the European Union’s Horizon 2020 research and innovation programme under grant agreement No 871149.
How to cite: Scherf, M., Snodgrass, C., Hueso, R., Tautvaisiene, G., Podlewska-Gaca, E., Colas, F., Sanchez-Lavega, A., Garate-Lopez, I., Dudziński, G., Bartczak, P., and Kargl, G.: The Europlanet Telescope Network: A global collaboration in support of planetary sciences, Europlanet Science Congress 2020, online, 21 Sep–9 Oct 2020, EPSC2020-313, https://doi.org/10.5194/epsc2020-313, 2020.
The Pro-Am Collaborative Astronomy (PACA) Project 1.0, evolved from the successful NASA observational campaign CIOC to characterize Oort-cloud comet C/2012 S1(ISON) in 2013 on its initial passage through the inner solar system. With no spacecraft en route to comet ISON, many of NASA assets were utilised to characterize the comet. With the inclusion of amateur astronomers, educators, students, outreach coordinators and astronomy journalists; adaptation of various social media platforms and components of emerging field of citizen science, four phases for a successful pro-am collaboration were identified: (1) identification of a scientific knowledge gap; (2) integration of the pro-am communities; (3) adopt emerging technology and (4) stay in the limelight with results of the campaign. Several important results that emerged from the successful campaigns are: (i) establishment of a global network of astronomers that can be galvanized into action on short notice; (ii) provide an alert mechanism to all observers; (iii) immediate outreach and dissemination of results via our media/blogger members; (iv) provide a forum for discussions between the communities to help strategize the observing campaign for maximum benefit and (v) identify potential challenges on the data archival and its crowdsourcing. We will illustrate these concepts in detail for the first comet campaign, PACA_CIOC. We will also share some strategies for building successful pro-am campaigns, with examples from various PACA- and non-PACA campaigns, including NASA/CIOC campaigns; ESA/Rosetta mission to comet 67P; 2017 and 2019 Total Solar Eclipses (TSE) polarization experiments with citizen scientists; planetary oppositions of Jupiter, Saturn and Mars in 2018 and other observing modes of polarization and spectroscopy now available to the amateur community. The evolution of Citizen Science in astronomy is intimately tied to professional-amateur collaboration (pro-am) observing campaigns. We will provide a framework from the set-up of the pro-am observing campaign to identifying challenges (such as data archival and its crowdsourcing) unique to each campaign. We will identify future opportunities for small aperture pro-am campaigns to include elements of citizen science (i) for engaging various audiences; and (ii) to include scientists and educators to provide guidance for the project and post-activity analysis of the data collected. The inclusion of educators from the start in defining such activities is vital for their success. Yet many scientists do not include educators till later in campaign. While some of this is mitigated by preparing a parallel outreach/citizen science program, the lack of scientists is highlighted by the lack of useable research results. Citizen science has evolved from a simple sort of data by engaging the public to iteratively cycling through the dimensions of a pro-am campaign (listed above). The PACA Observer comprises of a global network consisting of professional observers, individual amateur observers (solar, planetary, cometary), remote telescope networks and portable, mobile telescope networks. We will share the various products delivered via the PACA Project and highlight several new PACA campaigns that will be instituted soon, including the return of comet 67P/C-G (target of the ESA/NASA Rosetta mission). The deliverables of the observational campaigns include long data sets of various planetary atmospheres (Jupiter, Saturn and Mars); upcoming total and annular solar eclipses; involvement of students and data scientists in all phases of data acquisition and analysis. All amateur observers are invited to join the new campaigns and participate in the upcoming PACA campaigns and the evolution of the next generation of citizen science projects with new tools like correlative analysis and virtual/augmented reality.
How to cite: Yanamandra-Fisher, P., Angel, A., Clark, W., Feliciano, C., and Usher, H.: The Synergy of Scientific Research and Citizen Science , Europlanet Science Congress 2020, online, 21 Sep–9 Oct 2020, EPSC2020-1002, https://doi.org/10.5194/epsc2020-1002, 2020.
Please decide on your access
Please use the buttons below to download the presentation materials or to visit the external website where the presentation is linked. Regarding the external link, please note that Copernicus Meetings cannot accept any liability for the content and the website you will visit.
Forward to presentation link
You are going to open an external link to the presentation as indicated by the authors. Copernicus Meetings cannot accept any liability for the content and the website you will visit.
We are sorry, but presentations are only available for users who registered for the conference. Thank you.

