Oral presentations and abstracts
The EPSC symposium "Open Lunar Science & Innovation” will address:
- Celebrating the legacy of Apollo and Luna programmes after 50 years
- Recent lunar results: geochemistry, geophysics in the context of open planetary science and exploration
- Synthesis of results from Clementine, Prospector, SMART-1, Kaguya, Chang’e 1, 2 and 3, Chandrayaan-1, LCROSS, LADEE, Lunar Reconnaissance Orbiter, Artemis and GRAIL
- First results from Chang'E 4, Chandrayaan2,
- Goals and Status of missions under preparation: orbiters, Luna25-27, SLIM, , Commercial landers, Chang'E 5 and Lunar sample return missions, Future cargo landers,
- Precursor missions, instruments and investigations for landers, rovers, sample return, and human cis-lunar activities and human lunar surface sorties (Artemis and others)
- Preparation for International Lunar Decade: databases, instruments, missions, terrestrial field campaigns, support studies
- ILEWG and Global Exploration roadmaps towards a global robotic/human Moon village
- Strategic Knowledge Gaps, and key science Goals relevant to Lunar Global Exploration
- The Moon Village with the goal of a sustainable human and robotic presence on the lunar surface as an ensemble where multiple users can carry out multiple activities.
- The Moon for planetary science, life sciences, astronomy, fundamental research, resources utilisation, human spaceflight, peaceful cooperation, economical development, inspiration, training and capacity building.
- How a laboratory on the Moon should be equipped to be useful for a variety of disciplines, including geology, biology, and chemistry
- How can the Moon Village serve as a stepping stone for exploration of Mars and planetary bodies even further away?
- Historical, societal, humanistic aspects of lunar exploration
Lunar science and exploration are developing further with new and exciting missions being developed by China, the US, Japan, India, Russia, Korea and Europe, and with new stakeholders.
Session assets
The Apollo 15 & 16 missions were the first to explore the Lunar surface chemistry by investigating about 10 percent of the Lunar surface using a remote sensing X-ray fluorescence spectrometer experiment. The data obtained has been extensively used to study Lunar formation history and geological evolution. In this work a re-evaluation of the Apollo 15 & 16 X-ray fluorescence experiment is conducted with the aim to obtain up-to-date empirical values for aluminum (Al) and magnesium (Mg) concentrations relative to silicon (Si) of the upper Lunar surface. An up-to-date orbit reconstruction, updated instrument response, and improved intensity ratio calculations are used to obtain new intensity ratio maps.
How to cite: Kuulkers, E. and Gloudemans, A.: Re-evaluation of Lunar X-ray observations by Apollo 15 & 16, Europlanet Science Congress 2020, online, 21 Sep–9 Oct 2020, EPSC2020-210, https://doi.org/10.5194/epsc2020-210, 2020.
The Mercury Radiometer and Thermal Infrared Spectrometer (MERTIS) is part of the ESA BepiColombo Mercury Planetary Orbiter (MPO) payload and consists of a push-broom IR-spectrometer (-TIS) and a radiometer (-TIR) [1].
During the long cruise to Mercury, and before its arrival on December 5th 2025, BepiColombo will perform 9 flybys: among them, the Earth/Moon flyby on April 10th 2020. Due to the flight configuration, not all the instruments onboard BepiColombo are able to operate during cruise and flybys. Among the instruments that can operate is MERTIS, providing the first hyperspectral observation of the Moon in the thermal infrared (TIR) wavelength range from space.
At the Planetary Spectroscopy Laboratory (PSL) of DLR in Berlin, a spectral library for lunar analog rocks in the TIR spectral range, measured under simulated Moon surface conditions, has been built to help the interpretation of MERTIS’ Moon spectra.
Shortly after launch, MERTIS underwent a Near-Earth Commissioning Phase on Nov. 13-14 2018 during which the instrument was turned on for the first time in space. MERTIS was found to be fully operational [4], and the radiometer showed an excellent correspondence of the 2013 preflight sensitivity measurements and the 2018 in-flight measurements.
Although most instruments on the BepiColombo MPO are blocked by the Mercury Transfer Module (MTM) during cruise and flyby operations, MERTIS is able to acquire data through its space baffle. We adapted the MERTIS operations software to allow for this unique opportunity. Especially the Earth/Moon fly-by is of interest, as the surface composition of the Moon and Mercury have been frequently compared in the literature [5-10]. Observing the Apollo and Luna landing sites with MERTIS, in combination with laboratory studies, provides extremely valuable ground truth for our MERTIS measurements.
The time allocated for MERTIS pointing to the Moon was 4 hours and started 1 day before closest approach. During this slot the Moon was in the FoV of MERTIS. The 4 hours visibility slot was divided in 4 segments of 1 hour approximately connected by short slews. The attitude in each segment was quasi inertial (no tracking, keeping the Sun within illumination constraints) with the Moon slowly drifting in the FoV such that it is aligned with the boresight right in the middle of the segment. Within the 4 hours allocated for observations the Moon was nearly fully illuminated.
In the last decades orbital spectroscopic observations of the lunar surface have greatly advanced our understanding of the global distribution of different rock types and their chemical compositions. This vast dataset is complemented by the first in situ reflectance spectra from the lunar surface obtained by the recent Chang’E 3 and current Chang’E 4 missions, which provide more detailed information about the mineralogy of local surface materials and the geological context of the landing sites [11].
A reliable quantification of mineral modal abundances from measured reflectance spectra requires the availability of laboratory spectra of comparable samples. Current spectral databases primarily contain spectra measured on powder samples, lacking spectra of coarse grained rock samples. Reflectance spectra are sensitive to grain size and surface roughness [12], the available powder spectra might not be sufficient for a quantitative interpretation of measured rock spectra.
Rock samples obtained during the Apollo missions indicate that lunar anorthosites are typically coarse grained and can reach grain sizes of more than 1 cm. Hence, the global abundance of anorthosite as the dominant rock type of the lunar surface suggests that such coarse grained rocks are ubiquitous.
Therefore the extension of the current spectral databases by new spectral data of whole rock samples is crucial for the interpretation of current remote and in-situ measurements.
The Planetary Spectroscopy Laboratory (PSL) of DLR in Berlin is a spectroscopy facility providing spectral measurements of planetary analogues from the visible to the far-infrared range for comparison with remote sensing spacecraft/telescopic measurements of extraterrestrial surfaces [13-17]. External simulation chambers are attached to the FTIR spectrometer to measure the emissivity of solid samples.
The samples selected for this work includes: - slabs and stone chunks of plagioclases bearing rocks such as anorthosite, diorite, monzodiorite, gabbro and diabas; several basalts, rhyolite, olivine, granite, andesite, labradorite, obsidian.
Samples are heated in vacuum slowly and gradually up to 400° C. Measurements were taken at 100° C, 200° C, 300° C and 400° C in the MIR and FIR spectral ranges.
Thermally processed samples are measured in hemispherical and bi-directional reflectance in the full spectral range from UV to FIR.
A sample of graphite measured in emissivity at increasing T, adopting the same configuration and procedure used for the samples was used as blackbody for emissivity calibration.
MERTIS on ESA BepiColombo will be the first instrument to obtain hyperspectral measurements of the Moon in the TIR spectral range from space. Here we present the first results combined with a spectral library of emissivity for lunar analog rocks measured under simulated Moon conditions.
How to cite: Maturilli, A., Helbert, J., Hiesinger, H., Alemanno, G., Schwinger, S., and D'Amore, M.: MERTIS seeing the Moon in the TIR: results from the first Bepicolombo flyby, Europlanet Science Congress 2020, online, 21 Sep–9 Oct 2020, EPSC2020-271, https://doi.org/10.5194/epsc2020-271, 2020.
We present a thermophysical model (TPM) of the Moon which matches the observed, global, disk-integrated thermal flux densities of the Moon in the mid-infrared wavelength range for a phase angle range from -90° to +90°.
The model was tested and verified against serendipitous multi-channel HIRS measurements of the Moon obtained by different meteorological satellites (NOAA-11, NOAA-14, NOAA-15, NOAA-17, NOAA-18, NOAA-19, MetOp-A, MetOp-B). The sporadic intrusions of the Moon in the deep space view of these instruments have been extracted in cases where the entire Moon was within the instruments' field of view. The HIRS long-wavelengths channels 1-12 cover the range from 6.5 to 15 μm, the short-wavelengths channels 13-19 are in the 3.7 to 4.6 μm range.
The model is based on an asteroid TPM concept (Lagerros 1996, 1997, 1998; Müller & Lagerros 1998, 2002), using the known global properties of the Moon (like size, shape, spin properties, geometric albedo, thermal inertia, surface roughness, see Keihm 1984; Racca 1995; Rozitis & Green 2011; Hayne et al. 2017), combined with a model for the spectral hemispherical emissivity which varies between 0.6 and 1.0 in the HIRS wavelength range (Shaw 1998; ECOSTRESS data base: https://ecostress.jpl.nasa.gov/). The spectral emissivity as well as characteristics of the surface roughness are crucial to explain the well-calibrated measurements.
Our Moon model fits the flux densities for the currently available 22 epochs (each time up to 19 channels) with an absolute accuracy of 5-10%. The phase curves at the different wavelengths are well explained. The spectral energy distributions are very sensitive to emissivity and roughness properties. Here, we see minor variations in the model fits, depending on the origin (phase and aspect angle related) of the thermal emission. We also investigated the influence of reflected sunlight at short wavelengths.
Our TPM of the Moon has a wide range of applications: (i) for Earth-observing weather satellites in the context of field of view and photometric calibration (e.g., Burgdorf et al. 2020); (ii) for interplanetary space missions (e.g., Hayabusa2, OSIRIS-REx or BepiColombo) with infrared instruments on board for an in-space characterization of instrument properites (e.g., Okada et al. 2018); (iii) to shed light on the thermal mid-infrared properties of the lunar surface on a global scale; and, (iv) to benchmark thermophysical model techniques for asteroids in the regime below 10 μm (e.g., observed by WISE in the W1 and W2 bands at 3.4 and 4.6 μm, by Spitzer-IRAC at 3.55 and 4.49 μm or from ground in M band at around 5 μm).
References:
Burgdorf M., et al. 2020, Remote Sens. 12, 1488; Hayne, P. et al. 2017, JGRE 122, 237; Keihm, S.J. 1984, Icarus 60, 568; Lagerros 1996, A&A 310, 1011; Lagerros 1997, A&A 325, 1226; Lagerros 1998, A&A 332, 1123; Müller & Lagerros 1998, A&A 338, 340; Müller & Lagerros 2002, A&A 381, 324; Okada T. et al. 2018, P&SS 158, 46; Racca G. 1995, P&SS 43, 835; Rozitis & Green 2011, MNRAS 415, 2042.
How to cite: Müller, T. G., Burgdorf, M. J., Buehler, S. A., and Prange, M.: Thermophysical model of the Moon from 3.7 to 15 μm, Europlanet Science Congress 2020, online, 21 Sep–9 Oct 2020, EPSC2020-586, https://doi.org/10.5194/epsc2020-586, 2020.
1. Introduction
One of the Moon’s most surprising characteristics is its crustal asymmetry; the farside hemisphere, dominated by ancient highlands and covered with a few mare deposits, has a different volcanic history than the (sampled) nearside [1]. Surface dating of the lunar mare basalts revealed that the volcanism on the Moon lasted between ~3.9-4.0 and ~1.2 Ga, with a peak in the volcanic activity ~3.6-3.8 Ga ago [2]. A recent study further demonstrated that the mineralogy of the nearside mare basalts reveals a late stage volcanism with high titanium and olivine contents [3]. More recent spectroscopic analyses focused on the farside’s crustal rocks composition (e.g. [4] for South Pole-Aitken [SPA] basin), but no comprehensive study of the farside mare compositions has been conducted up to now.
2. Data and methods
In this work, we used spectroscopic data of the Moon Mineralogy Mapper (M3) onboard Chandrayaan-1 to survey the mineralogy of all mare deposits in the VNIR domain (0.4-3 μm). Each mare unit was mosaicked separately and processed using the method of [5]: an IDL routine automatically computes and removes the continuum of each spectrum, and determines its spectral parameters (e.g. band centers, band areas, band depths, spectral slope). To compare with the mineralogy of the nearside [3], we also mosaicked three selected mare regions, each representative of one spectral unit. Finally, we applied statistics on spectral parameters of interest to survey the variation in mineral signatures and compositions of farside maria.
3. Preliminary results
We found that spectra of mare basalts are dominated by pyroxene signatures (Figure 1).
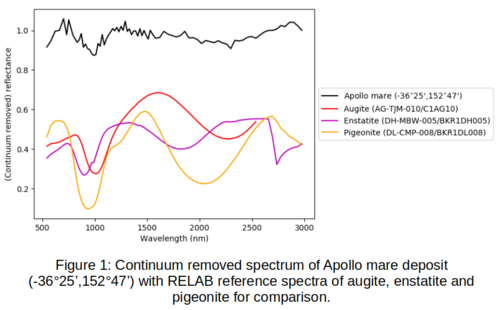
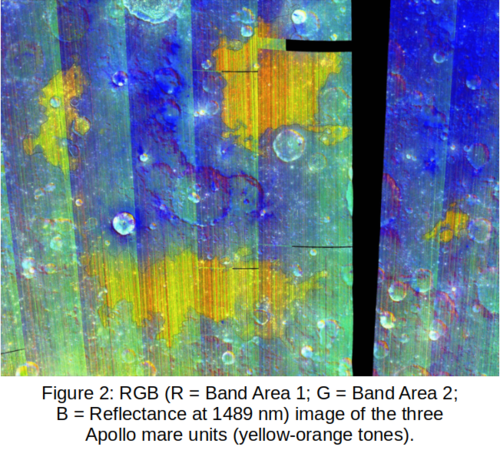
However, some mare units (e.g. Apollo, see Figure 2) showed considerable differences in band characteristics in which cases we computed statistics on each mare subunits.
Major differences were also observed in SPA mare units when they were compared to Mare Australe deposits and other maria outside of the SPA basin (Figure 3).
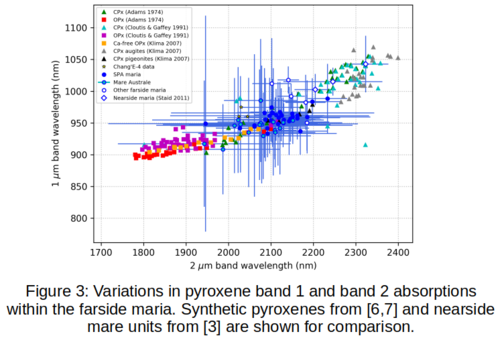
This suggests different pyroxene compositions within SPA. Moreover, the nearside mare units we defined based on [3] are clearly distinct from all farside mare deposits since they are the richest in clinopyroxenes (Figure 3).
4. Conclusion and perspectives
The results we have so far indicate slightly different mineralogies of mare basalts between the nearside and the farside of the Moon and, if confirmed by looking at the other spectral parameters, could mirror its crustal dichotomy. We plan to investigate possible evidence of olivine and possible correlations with age and location, as well as intra-SPA diversity with our spectral parameters set.
Acknowledgements
The authors want to thank Jan Hendrik Pasckert and Harald Hiesinger for having kindly shared with us their shapefiles of SPA mare deposits [8]. Fundings from the CNRS Momentum, LUE Future Leader and CNES APR are much appreciated.
References
[1] Head III, J. W., and Wilson, L.: Lunar mare volcanism: Stratigraphy, eruption conditions, and the evolution of secondary crusts, Geochimica et Cosmochimica Acta, Vol. 56, 1992.
[2] Hiesinger, H., et al.: Ages of mare basalts on the lunar nearside, Journal of Geophysical Research, Vol. 105, 2000.
[3] Staid, M. I., et al.: The mineralogy of late stage lunar volcanism as observed by the Moon Mineralogy Mapper on Chandrayaan-1, Journal of Geophysical Research, Vol. 116, 2011.
[4] Moriarty, D. P., and Pieters, C. M.: The Character of South Pole-Aitken Basin: Patterns of Surface and Subsurface Composition, Journal of Geophysical Research, Vol. 123, 2018.
[5] Martinot, M., et al.: Mineralogical Diversity and Geology of Humboldt Crater Derived Using Moon Mineralogy Mapper Data, Journal of Geophysical Research, Vol. 123, 2018.
[6] Klima, R. L., et al.: Spectroscopy of synthetic Mg-Fe pyroxenes I: Spin-allowed and spin-forbidden crystal field bands in the visible and near-infrared, Meteoritics & Planetary Science, Vol. 42, 2007.
[7] Adams, J. B.: Visible and near-infrared diffuse reflectance spectra of pyroxenes as applied to remote sensing of solid objects in the solar system, Journal of Geophysical Research, Vol. 79, 1974.
[8] Pasckert, J. H., Hiesinger, H., Van der Bogert, C. H.: Lunar farside volcanism in and around the South Pole-Aitken basin, Icarus, Vol. 299, 2018.
How to cite: Bott, N., Flahaut, J., Martinot, M., and Ito, G.: Unveiling the mineralogical composition of lunar farside mare basalts, Europlanet Science Congress 2020, online, 21 Sep–9 Oct 2020, EPSC2020-561, https://doi.org/10.5194/epsc2020-561, 2020.
Introduction: The ability to discriminate between different mineral phases in lunar materials is critical in reconstructing the origin and evolution of the moon and understanding its relationship to Earth. Resource identification is also critical to develop a viable long-term lunar exploration program enabling a continued human presence. Mineral-bound metals are important resource targets in regolith and mare basalts [1]. Minerals in lunar basalts and regolith such as ilmenite and pyroxene are known hosts of metals like Cr, Ni, Co, and Mn, and ilmenite in particular has been considered for Fe and O2 extraction [2][3].
Raman spectroscopy non-destructively provides structural information to identify trace compounds and minerals in a matter of seconds. Raman spectroscopy has been used for decades to measure the composition of returned lunar samples and analog materials ([4][5][6] and references therein). Raman measurements can be undertaken with multiple excitation wavelengths, (UV ~244nm, VIS ~532nm, NIR ~785nm, and IR ~1064nm), with advantages to using one excitation wavelength over another. The 532 nm wavelength provides high-energy excitation with good sensitivity and low noise for most materials covering a wide spectral range (~0 – 4000 cm-1). This wide range is essential for the identification of volatiles, in which spectral shift for functional groups like OH occur within ~3000 - 3700 cm-1, and minerals with peak shifts ~100-200 cm-1, such as sulfides, feldspars, and quartz polymorphs. NIR Raman has been shown to exhibit better signal-to-noise, particularly for opaque minerals, like sulfides and oxides, and is the typical wavelength utilized in portable Raman instruments for terrestrial resource prospecting ([7][8]). The two wavelengths used together ensure near-comprehensive identification and accurate characterization of lunar materials suitable for resource extraction.
Materials and Methods: This study looks at a suite of lunar analog mineral samples (olivine, plagioclase, pyroxene, ilmenite, apatite) and relevant terrestrial analog rocks using portable and benchtop VIS (532nm) and NIR (780nm) Raman spectroscopy and Fourier transform infrared spectroscopy for comprehensive characterization of composition. Samples were probed either in tact or as powders at room temperature. A subset of powdered samples was heated (T= 298K, 325K, and 373K) and characterized using NIR Raman to study temperature dependence of Raman spectra.
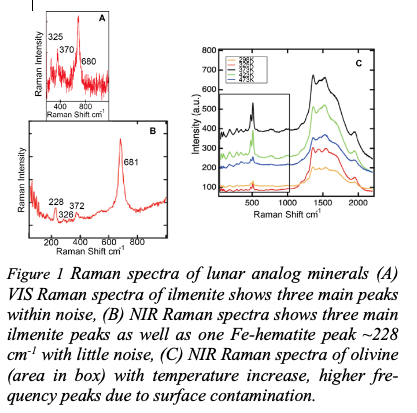
Initial Results: The mineral samples included in the study were all identifiable using both VIS and NIR Raman spectroscopy, and in some cases the portable instruments performed better than the high-resolution benchtop systems. Basalt and ilmenite samples were better characterized under NIR excitation, while the silicate minerals had a better response under VIS excitation (Fig. 1). FTIR measurements of the silicate minerals were informative, but the opaque nature of ilmenite results in low reflectance under higher wavelengths. For both Raman and FTIR measurements, better results were achieved with the pure minerals in comparison to the rocks composed of multiple minerals. The NIR Raman temperature experiments showed an enhancement of spectral peak intensity for minerals like plagioclase as the temperature increased up to 373K.
Ongoing and Future Work: We have demonstrated that Raman excitation under both VIS and NIR provides useful information to identify lunar minerals of interest to the lunar science community as well as for in situ resource identification, with some advantages for one or the other depending on the target sample. IR (2-16 mm) reflectance spectroscopy is useful for silicates, but opaque minerals like ilmenite require lower wavelengths for identification. Our lab is currently exploring VIS-SWIR reflectance (~0.5 – 2.5 mm as a viable alternative, and further work exploring temperature effects on Raman spectra relevant to the lunar surface is also being done.
Acknowledgements: M. Peterson, M. Howard and P. Misra would like to acknowledge the financial support received from the REU Site in Physics at Howard University (NSF Award # PHY 1659224). D. Bower, S. Li, T. Hewagama, S. Aslam, J. Kolasinski, N. Gorius, T. Livengood, and A. McAdam would like to acknowledge the support of the Internal Research and Development and Fundamental Laboratory Research Programs at Goddard Space Flight Center.
References: [1] Taylor, G. J. and Martel, L. M. V. (2003) Adv. In Sp. Res., 31, 2403-2412. [2] James, O. B. (1973) XX. [3] Papike J., Taylor L., and Simon S. (1991) in Lunar Sourcebook, pg. 121. [4] Wang, A. et al. (2001) American Mineralogist, 86, 790-806. [5] Jolliff, B. et al. (2006) American Mineralogist, 91, 1583-1595. [6] Ling, Z.C. et al. (2011) Icarus, 211,101-113. [7] Jehlicka and Vandenabeele (2015) Journal of Raman Spectroscopy, 46, 927-932. [8] Ando and Garzanti (2014) Geological Society of London Spec. Pub, 386, 395-412.
How to cite: Bower, D., Misra, P., Peterson, M., Howard, M., Hewagama, T., Gorius, N., Li, S., Aslam, S., Livengood, T., McAdam, A., and Kolasinski, J.: Comparative VIS and NIR Raman and FTIR Spectroscopy of Lunar Analog Samples, Europlanet Science Congress 2020, online, 21 Sep–9 Oct 2020, EPSC2020-427, https://doi.org/10.5194/epsc2020-427, 2020.
Abstract
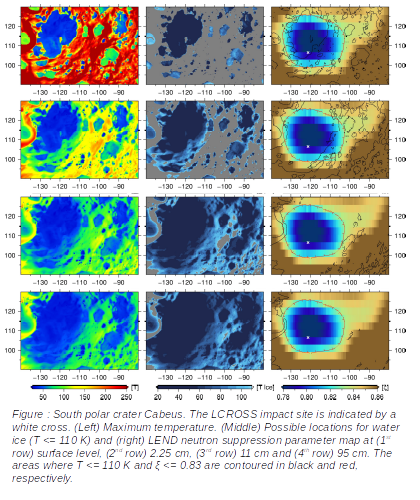
We modeled (sub-)surface temperatures for the upper two-meter regolith layer near the lunar poles. The temperature maps are compared to the observed hydrogen signal from the Lunar Enhanced Neutron Detector (LEND). We focused our study on six Neutron Suppression Regions (NSRs).
Introduction
The lunar poles offer a thermal environment with surface temperatures allowing for water ice to accumulate, especially in Permanently Shadowed Regions (PSRs) commonly found at crater floors [1]. Extensive remote sensing and modeling techniques were applied from a series of missions to detect and quantify potential deposits (e.g. [2][3]). Although plausible evidence was found from orbiting spacecrafts, alternative explanations are still possible, e.g. roughness, fresh surface material, hydroxyl (OH) bearing minerals etc. However, the Lunar Crater Observation and Sensing Satellite (LCROSS) found direct evidence of water through impacting within the PSR of Cabeus crater. LEND [4] observations revealed several NSRs [5], i.e. hydrogen-rich areas which are typically found within PSRs. However, some NSRs are occasionally in sunlight creating surface temperatures at which water ice cannot be stable. At specific thermal conditions, i.e. maximum and average temperatures are 120 K and 105 K respectively, an ice pumping mechanism into the sub-surface is activated [6].
We investigate to which extent temperatures correlate with LEND’s hydrogen signal and whether or not ice pumping can explain the existence of some of the NSRs.
Data and Method
Our study is based on polar 650x650 km Lunar Orbiter Laser Altimeter (LOLA) Digital Terrain Models (DTMs) [7][8].
Lunar (sub-)surface temperatures are modeled by solving the 1D heat equation [9]. We treat the Sun as an extended source considering the limb-darkening effect. Heat conduction is modeled within the upper two meters of regolith and temperatures are derived for 30 layers. Multiple scattering and re-radiation of VIS and IR is evaluated at each pixel from a 50x50 km window. Earth-shine (VIS and IR) and a constant radiogenic heat source of 0.016 W/m² are also incorporated in the model.
The DTMs were synthetically illuminated [10] in 12-h time steps for a 19-year period, 01-01-1991 to 01-01-2010. Since similar illumination conditions occur at the start and end time we could iterate the process until temperatures converged. After 5 iterations (i.e. 95 years) we found an equilibrated solution from which we derived results presented in this study.
Our investigated NSRs are: areas near Whipple, Fibiger and Peary at the north pole and areas inside Shoemaker, Haworth and Cabeus crater at the south pole. For each NSR we derived minimum, average and maximum temperature maps. Additionally, maps of suppression parameter ξ were prepared. The suppression parameter represents the ratio between the average neutron counting within LEND’s field-of-view to the average neutron counting of a hydrogen-poor reference area [5].
3. Results
To determine whether or not temperature and suppression parameter maps correlate we needed to set thresholds. For instance, the threshold for temperature below which we assume water ice to be stable is 110 K [11]. The threshold for the suppression parameter ξ was set to 0.83. We found this threshold by evaluating the observed ξ around the LCROSS impact site for which we know that water ice is present.
At each depth layer we compared the overlap of the two emerging areas of potential water ice, one determined by temperature and the other determined by ξ (see Fig. 1). We also derived growth rates (%/cm) indicating whether significant increase in overlap (%) is achieved by comparing ξ to temperature layers in greater depth (cm). For the south polar NSRs we find that both areas overlap > 95% and ice appears to be present within the upper 19 cm of regolith. The north polar NSRs show an overlap of ~50-70% and ice seems to be buried to greater depths, e.g. 65 cm. In fact, we found that maximum and average temperatures create ideal conditions for ice pumping into the sub-surface.
4. Discussion
Our south polar NSRs reside in PSRs, i.e. the coldest areas on the Moon. They follow the classical view on how water ice deposits at the poles: water molecules hop over the lunar surface and eventually get trapped and accumulate in PSRs. Our selected north polar NSRs, however, reside in non-PSR areas which are occasionally in sunlight and are generally too warm for water ice to be stable. Ice pumping seems to be the explanation for those locations. We could show that NSRs and modeled temperatures do correlate, either at surface or sub-surface level.
Acknowledgements
P. Gläser was funded by a Grant of the German Research Foundation (GL 865/2-1). We gratefully acknowledge the support of NVIDIA Corporation with the donation of a Quadro P6000 GPU used for this research. Last, we wish to thank the LRO Science Teams for releasing such wonderful data products.
References
[1] Watson, K. et al. 1961, Journal of Geophysical Research 66, 1598–1600
[2] Nozette, S. et al. 1996, Science 274, 1495–1498
[3] Paige, D.A. et al. 2010, Science 330, 479
[4] Mitrofanov, I.G. et al. 2010, Science 330, 483
[5] Sanin, A.B. et al. 2017, Icarus 283, 20–30
[6] Schorghofer, N. et al. 2010, The Astrophysical Journal 788, 169
[7] Gläser, P. et al. 2018, Planetary and Space Science 162, 170–178
[8] Gläser, P. et al. 2013, Planetary and Space Science 89, 111–117
[9] Gläser, P. et al. 2019, Astronomy & Astrophysics 627, A129
[10] Gläser, P. et al. 2014, Icarus 243, 78–90
[11] Vasavada, A.R. et al. 1999, Icarus 141, 179–193
How to cite: Gläser, P., Sanin, A., Williams, J.-P., Mitrofanov, I., and Oberst, J.: Comparison of LEND's hydrogen signal with modeled (sub-)surface temperatures in the lunar polar regions, Europlanet Science Congress 2020, online, 21 Sep–9 Oct 2020, EPSC2020-530, https://doi.org/10.5194/epsc2020-530, 2020.
The EuroMoonMars Programme started in 2009 by ILEWG, ESA ESTEC, NASA, VU Amsterdam and supported by various space agencies, universities and academic or industrial partners has to bring together : space science and astronomy, Earth and planetary sciences and biology, technology, field work campaigns in extreme environments, resource utilisation and economy, human factors, international cooperation. Space and society, bridging to Arts and social sciences through the ArtMoonMars initiative.
We shall describe how EuroMoonMars can contribute to European astronomy and space science: public and political engagement education in areas of education, research, innovation, culture, youth and sport policies, and industry, digital single market, space and safety, policies .
The International Lunar Exploration Working Group (ILEWG) is a public forum sponsored by the world's space agencies to support "international cooperation towards a world strategy for the exploration and utilization of the Moon - our natural satellite" (International Lunar Workshop, Beatenberg (CH), June 1994). ILEWG was founded by several space agencies: ASA, ASI, BNSC, CNES, DARA, ESA, ISAS, NASA, NASDA, RSA. ILEWG has been organising since 1994 the ICEUM International Conferences on Exploration & Utilisation of the Moon with published proceedings, and where community declarations have been prepared and endorsed by community participants. ILEWG has co-organised and co-sponsored lunar sessions at EGU, COSPAR, EPSC. Declarations from ICEUM conferences cover all aspects of science, technology, cooperation, industry, society and inspiration. ICEUM13 took place together with COSPAR in Pasadena in 2018, and ICEUM14 with EPSC-DPS in Geneva in 2019. Next ICEUM15 is to take place with COSPAR B/PEX symposia (co-chairs: C. Pieters, B. Foing, G. Schmidt, C. Heinicke), in Sydney in January 2021.
ILEWG founded in 2009 the EuroMoonMars initiative, which comprises field campaigns in Moon-Mars analogue environments.The EuroMoonMars field campaigns have been organised in specific locations of technical, scientific and exploration interest. The campaigns started with EuroGeoMars2009 (Utah MDRS, 24 Jan-1 Mar 2009) with ILEWG, ESA ESTEC, NASA Ames, VU Amsterdam and GWU and continued yearly at MDRS and other extreme field sites on Earth.
The EuroMoonMars campaigns consist of research activities for data analysis, instruments tests and development, field tests in Moon-Mars analogues, pilot projects, training and hands-on workshops and outreach activities.
In 2019 ILEWG contributed to IgLuna first ESA Lab inter-University demonstrator project, hosted by the Swiss Space Centre (SSC) with the vision to create an analogue habitat inside lunar ice caps. The campaigns were held from 17–30 June 2019 and involved 18 student teams from 9 countries across Europe. The students developed modular demonstrators and tested them during a field test conducted inside the moon-like extreme environment of the Glacier Palace inside the Zermatt Matterhorn glacier.
Currently, ILEWG is collaborating with the International Moonbase Alliance (IMA)] and the Hawaii Space Exploration Analog and Simulation (HI-SEAS) on a series of EuroMoonMars, IMA and HI-SEAS (EMMIHS) campaigns, at the HI-SEAS analogue facilities in Hawaii.
ArtMoonMars, Moon Village & ITACCUS (IAF ITACCUS Committee on Socio Cultural Utilisation of Space) activities were performed, with emphasis on events and workshops. The Moon Village is an open concept proposed with the goal of a sustainable human and robotic presence on the lunar surface as an ensemble where multiple users can carry out multiple activities. We want to involve everybody including Socio cultural and Artistic aspects. Why ArtMoonMars? Artists can convey multiple messages of the community including planetary science, life sciences, astronomy, fundamental research, resources utilisation, human spaceflight, peaceful cooperation, economical development, inspiration, training & capacity building.
References
https://en.wikipedia.org/wiki/International_Lunar_Exploration_Working_Group
How to cite: Foing, B. and the ILEWG EuroMoonMars Core Team 2018-2020: ILEWG EuroMoonMars Highlights 2018-2020, Europlanet Science Congress 2020, online, 21 Sep–9 Oct 2020, EPSC2020-14, https://doi.org/10.5194/epsc2020-14, 2020.
Introduction:
Simulated missions to the Moon and Mars have been taking place at the analog research station HI-SEAS (Hawaii - Space Exploration Analog and Simulation) since 2013. The so-called Martian and lunar habitat, HI-SEAS, is located in Hawaii and its research projects are run by the International Moonbase Alliance (IMA) [1]. Numerous aspects of space missions are simulated in order to make them be as realistic as possible, including time delays in communication, emergency procedures and performing relevant research.
In 2019, the EuroMoonMars campaign was launched at HI-SEAS, bringing together researchers from the European Space Agency (ESA), IMA, the International Lunar Exploration Working Group (ILEWG), VU Amsterdam and many other international organizations [2,3]. The campaign aims to increase awareness about the research and technology testing that can be performed in analog environments, in order to help humans become multi-planetary species. Furthermore, the research and technological experiments conducted at HI-SEAS are going to be used to help build a Moon base in Hawaii, and ultimately to create an actual Moonbase on the Moon, as part of IMA’s primary goals [3,4,5].
The EMMIHS II mission research:
EMMIHS-II was the second campaign organized by the EuroMoonMars group, taking place from December 8th-22nd, 2019. When the crew left the HI-SEAS habitat, they wore analog space-suits and went through full extravehicular activity (EVA) protocols to perform their research in the simulated lunar terrain. The crew was supported by a Mission Control Center (MCC) based in Hawaii and a Remote Support team based at EuroMoonMars ESA/ESTEC in the Netherlands [2,3,4,5]. The main research themes of the EMMIHS-II campaign were as follows:
Engineering research: Crew engineers are responsible for numerous tasks to ensure nominal operations and the maintenance of the EVA and habitat equipment. They prepare a daily Engineering Report for the MCC, which includes the status of the equipment, recommendations for improvements and any requests for support. They are also responsible for supporting other crew members’ research projects if needed. At least two crewmembers should serve as crew engineers with strong analytical, troubleshooting and hands-on technical skills.
Lava tubes as habitats: Detailed investigations were performed of the lava tubes in the vicinity of the HI-SEAS habitat [Figure 1]. They were subsequently compared to lava tubes on the Moon, with the intension of creating an environmental guideline for the architectural lunar habitat development in lava tubes.
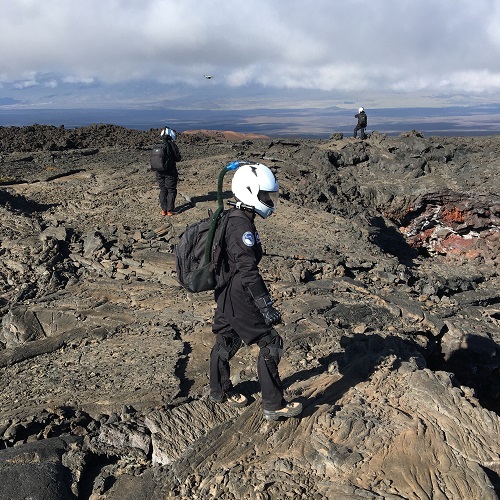
Figure 1. EMMIHS-II crew exploring lava tubes with drone in-field recognition.
Nutrition for astronauts: Dietary needs and the health of each crew member was monitored and the crew followed a pre-prepared personal menu based on their intolerances and daily activities. Various digestive problems were identified. In order to avoid this on future missions, the dietary intake of vegetable fiber for each individual could be estimated before the mission start in order to adapt the fruit and vegetable rations individually. It was found that freeze-dried food did not contribute to the emotional well-being of the astronauts.
Growing fresh food using analog lunar soil: The fast-growing garden cress was sown in analog lunar soil collected by the HI-SEAS habitat. Coarse soil mixed with a small amount of compost is sufficient for germination and plant growth in the first stage of plant development. In the future, such crops could be grown more extensively in greenhouses on Mars or the Moon as sources of nutrients and oxygen for the crew, as well as to reduce compost and fertilizer payloads.
3D additive manufacturing: Dual extrusion 3D printing technologies were used to assess how additive manufacturing can improve livability in a space habitat. For instance, personal items for the analog astronauts’ leisure time activities and engineering tools were printed. Their effects on the crew were evaluated in a comparative survey.
Privacy and color during space missions: Comparative daily surveys were undertaken by the crew to evaluate the effects of different types of privacy and color deprivation situations. The findings will serve as a basis for future architectural design concepts in extra-terrestrial habitats.
Emergency medical simulation: A casualty evacuation (CASEVAC) exercise was performed to execute a mock injury while 1) maintaining simulation conditions as if on an EVA, or 2) “breaking simulation” to allow the crew to train for a real world situation. The in-simulation injury scenario was executed in the spirit of a robust approach to understanding the unexpected problems which may arise during space exploration [Figure 2].
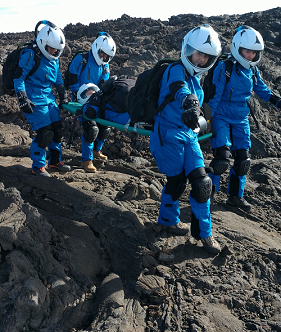
Figure 2. EMMIHS-II crewmembers are performing a CASEVAC (Casualty Evacuation) drill during an EVA.
Outreach: Outreach and educational activities were performed in order to reach out to and inspire as many young people as possible to be interested in STEM subjects. Some of these projects involved installing a Moon gallery at the HI-SEAS habitat, creating videos for school children during the missions, and performing research experiments designed by students all around the world.
Future plans:
Future missions at HI-SEAS include more EuroMoonMars IMA HI-SEAS (EMMIHS) missions, collaborative missions with ESA, NASA, universities worldwide and with companies. These missions will continue to contribute to the development of technologies to lay a foundation for creating a sustainable settlement on the Moon.
Acknowledgments:
First, we would like to thank the EMMIHS II crew (M. Musilova, S Kerber, A Wanske, J D’Angelo, A P Castro de Paula Nunes, C R Pouwels), the Mission Control from HI-SEAS (Andrew Cox et al.), ILEWG’s EuroMoonMars Manager B. Foing, and the Remote Control team (A. Jageli, J. Preusterink, A. Beniest, A. Sitnikova, et al.). We would also like to thank our sponsors and their generous support: Ruag Space, Capable BV, Kurtz Ersa, dB Matik AG, Tridonic GmbH CoKG, and the Brazilian Space Agency (AEB)
References:
[1] https://hi-seas.org
[2] Musilova M, Rogers H, Foing B, Sirikan N. et al. (2019), EMM IMA HI-SEAS campaign February 2019, EPSC-DPS2019-1152
[3] Sirikan, N., Foing, B., Musilova, M., et al. (2019). EuroMoonMars IMA HI-SEAS 2019 Campaign: An Engineering Perspective on a Moon Base, IAC, 21-25 October 2019. Washington DC, USA.
[4] Musilova, Michaela, Henk Rogers, and Bernard Foing. “Analogue research performed at the HI-SEAS research station in Hawaii.” Geophysical Research Abstracts. Vol. 21. 2019.
[5] https://moonbasealliance.com/
How to cite: Musilova, M., Nunes, A., Kerber, S., Pouwels, C., Wanske, A., D'Angelo, J., Foing, B., and Rogers, H.: The Second EuroMoonMars IMA at HI-SEA Field Campaign: An Overview of The EMMIHS-II Analog Mission to the Moon , Europlanet Science Congress 2020, online, 21 Sep–9 Oct 2020, EPSC2020-1020, https://doi.org/10.5194/epsc2020-1020, 2020.
The Astromaterials Data System (AstroMat) is a comprehensive data system for laboratory analytical data generated on astromaterials. The system will host all data generated on samples from the Astromaterials Collections curated at NASA's Johnson Space Center. AstroMat has been under development since late 2018 with funding from NASA and has been releasing versions of system components that can be used for searching content in AstroMat and for publishing astromaterials data. We will provide an update on the status of the AstroMat software ecosystems and its data content in this presentation.
AstroMat is designed as an ecosystem of interconnected web applications that provide human- and machine-readable interfaces to the data gathered and managed in the AstroMat data store. is a synthesis of all past, present, and future laboratory analytical data for the Lunar, Antarctic Meteorite, Cosmic Dust, Genesis, Hayabusa, Stardust, and Microparticle Impact collections that is being compiled from the literature and other data sources together with a wide range of information pertaining to the provenance of the analytical measurements (e.g., analytical instrumentation, laboratory, sample preparation procedures, instrument calibration, data reduction) and to the quality of the data. AstroDB includes all lab analytical data for Apollo samples that had previously been compiled in the MoonDB synthesis. Data from more than 800 references pertaining to samples from the Apollo Missions and lunar meteorites were already compiled as part of the MoonDB project and have been migrated to the new AstroDB.The serves as a trusted repository, where researchers can publish and archive lab analytical data for any astromaterials, not only those for NASA collections.
AstroMat features graphical interfaces for users to search, access, explore, visualize, analyze, and contribute data (AstroSearch, AstroRef, AstroPlot, AstroDesk, AstroRepo) and machine-actionable interfaces that connect the databases to internal and external software tools (AstroAPIs, RepoAPIs). We encourage the community to advise and inform us on the usability and functionality of the interfaces in order for AstroMat to meet its goals of furthering planetary science research.
How to cite: Lehnert, K., Ji, P., Mays, J., Figueroa, J. D., Johansson, A., Profeta, L., Song, L., and Morrison, S.: The Astromaterials Data System: Advancing Access to Past, Present, and Future Lab Analytical Data of NASA's Astromaterials Collections, Europlanet Science Congress 2020, online, 21 Sep–9 Oct 2020, EPSC2020-918, https://doi.org/10.5194/epsc2020-918, 2020.
Lunar impact flashes: analysis methods
Munaibari(1), R. Larson(2), C. Avdellidou(1), M. Delbo(1), J. Vaubaillon(3), P. Hayne(2), D. Sheward(4), A. Cook(4)
(1)Laboratoire Lagrange, Observatoire de la Côte d’Azur, UCA, France
(2)University of Colorado, USA
(3)IMCCE, Observatoire de Paris, France
(4)Aberystwyth University, UK
contact: chrysa.avdellidou@oca.eu
Abstract
We present our complete method to analyse lunar impact flashes; from the identification of the selenographic coordinates to the estimation of masses and sizes of the meteoroids. For this work we used archival data from the ESA-funded NELIOTA survey and we report an updated catalogue of the impact coordinates and link to meteoroid streams. This project is in the framework of our project Flash!, which aims to detect impacts in real time during the observations, identify the lunar coordinates and attempt the discovery of the fresh craters using LRO data. The scientific problem is to establish a link between the diameter of the meteoroid impactor and the diameter of the impact crater quantifying this scaling with live impact observations.
Selenographic coordinates and link to meteor streams
In this work, we exploit the publicly available datafrom NELIOTA (1,2), an ESA-funded survey at the National Observatory ofAthens (NOA). The first step is to identify the impact coordinates on the Moon. Using the method described by Larson et al. EPSC 2019 we have discovered that several impact locations given by the NELIOTA team are inaccurate and in some cases are off by 10s of degrees.
The importance ofaccurately locating the position of an impact flashcomes for the fact that it is needed to perform theprocess of linking the impactor to its source and this is crucial to identify the originof the impactor. In this work we evolve from our previous studies (3) and we investigate also the possibility an impactor to originate from the sporadic population and not only from meteoroid streams.
Masses and Sizes of the meteoroids
According to previous studies (2,3), an impact flashis treated as a black body whose spectral energy distribution is described by Planck’s law. Using the flash magnitudes in R and I bands we estimate temperature values as described with details in (3).
The mass of an impactor can be derived from its kinetic energy (KE). To calculate the impact KE it is necessary to measure the luminous energy ELum from the telescopic observations, which is just asmall fraction, η, of the KE.
In order to be able to estimate the kinetic energyof an impactor, it is essential to know the velocityat which it impacted onto the lunar surface. Thisvelocity is obtained by linking the impactor to its source, either a known meteoroid stream or the sporadic background population. In the case of streams, the velocity of their meteoroids is known.Once the link is established, the velocity of an impactor is easily computed by finding the differencebetween the velocity of the meteor shower’s particles and that of the Moon at the time of the impact.
Assuming a spherical shape for the impactors andwith the estimation of their masses we can now estimate their sizes. In this work, we utilised th e bulk densities that have been reported (4) for the fragments of some ofthe shower streams by assigning impactors with thebulk density of the meteor showers we found to betheir plausible sources. Finally, we construct the size frequency distribution with a slope of -2.48 as shown in Fig.1 and is comparable with the NASA survey (5).
Acknowledgements
This work was supported by the ProgrammeNational de Planetologie (PNP), France of CNRS/INSU, co-funded by CNES, France and bythe program "Flash!" supported by Crédits Scientifiques Incitatifs (CSI), France of the UniversitéNice Sophia Antipolis. This work has made use ofdata from the European Space Agency (ESA) NELIOTA project. We thank the EUR Spectrum for supporting Mr. Munaibari with a 3-month UCA Master Scholarship to perform this masterthesis.
References
[1] E. Xirouris, et al. A&A,619, A141 (2018).
[2] A. Z. Bonanos, et al. A&A, 612 (2018)
[3] C. Avdellidou & J. Vaubaillon. MNRAS, 484(4):5212–5222 (2019).
[4] P. B. Babadzhanov & G. I. Kokhirova., A&A, 495:353–358(2009).
[5] R. Suggs et al. Icarus, 238, 23 (2014).
How to cite: Munaibari, E., Larson, R., Avdellidou, C., Delbo, M., Vaubaillon, J., Hayne, P., Sheward, D., and Cook, T.: Lunar impact flashes: analysis methods, Europlanet Science Congress 2020, online, 21 Sep–9 Oct 2020, EPSC2020-728, https://doi.org/10.5194/epsc2020-728, 2020.
The lunar surface and the regolith that covers it are weathered by solar wind ions, which sputter atoms and molecules, participate to the creation of optically opaque particles, alter the regolith composition and create amorphous rims on regolith grains by displacing atoms inside the material. As protons and alpha particles dominate the density of solar wind ions, these two species may be the main contributors to ion weathering. However, the importance of solar wind minor ions heavier than alpha particles for the ion-induced alteration of airless body surfaces is an open debate. The fundamental question at stake is whether the variety of different minor ion species, their high masses, and their high charge states may overcome their low densities in the solar wind to enable them to significantly contribute to ion weathering processes.
In this presentation, long-term effects which develop on geological time scales are investigated. To do so, the long-term averaged energy spectrum of thermal, suprathermal, and energetic solar wind ions is estimated by compiling and contrasting ion measurements gathered by the ACE, Wind, STEREO, ARTEMIS, and MAVEN missions. The long-term ion environment to which the lunar surface is exposed to in the solar wind is then convolved with Stopping and Range of Ions in Matter (SRIM) simulations. Combining these data and ion effect models, we find that solar wind minor ions significantly alter the lunar surface and airless body surfaces in general, as they contribute to 12% to 22% of the total sputtering and create 20% to 50% of atomic displacements at depths greater than 100 nanometers. This new approach therefore confirms that solar wind minor ions play an important role in ion weathering of airless surfaces throughout the Solar System.
How to cite: Nénon, Q. and Poppe, A. R.: On the long-term weathering of the lunar surface by the heavy minor ions of the solar wind: inputs from ion observations and SRIM simulations, Europlanet Science Congress 2020, online, 21 Sep–9 Oct 2020, EPSC2020-470, https://doi.org/10.5194/epsc2020-470, 2020.
Introduction
In almost every planetary surface investigation, the characterization from a camera is a common initial step [1]. Mission Control is developing a science autonomy system called Autonomous Soil Assessment System: Contextualizing Rocks, Anomalies and Terrains in Exploratory Robotic Science (ASAS-CRATERS). It can enable automated surface characterization on planetary missions, which can benefit a wide range of science investigations and rover navigation alike. It can perform terrain classification and novelty detection using convolutional neural networks, and data aggregation to produce relevant data products for supporting science operations. Built on cutting-edge algorithms and off-the-shelf computing components, it offers low-cost ways to speed up tactical decision-making in next-generation commercial lunar missions.
Background and Motivation
Autonomy in Science Operations
Several factors are increasingly driving the need for autonomy in science operations. In traditional Mars rover operations, visual surface characterization and subsequent analysis and decision-making takes place in day-long tactical cycles [2]. Upcoming commercial lunar rover missions will have reduced latency, short lifetimes, and constrained bandwidth shared across several payloads. This will result in a need for rapid tactical decision-making processes with limited data, leaving little time for analysis, target identification, and making decisions. Payload operators may not receive data in a timely fashion, or worse, may not receive some data at all. Autonomous onboard terrain classification offers a way to downlink light-weight data products and reduce the bottleneck in scientific terrain assessment. Autonomous classification and novelty detection increase the chances of detecting novel/sparse features (e.g., lunar outcrop or pyroclasts) that may otherwise be missed or not downlinked when driving and other mission needs are prioritized.
Application to Lunar Geology
While dedicated science instruments that reveal mineralogical and elemental composition improve our understanding of geological processes, a rover’s navigation sensors can document the morphology, morphometry, and composition of surface materials, regardless of primary investigation goals. High-resolution colour images and 3D data from stereo cameras provide information such as the size-frequency distribution and physical characteristics of craters and rocks, and regolith properties. All this offers valuable insight into the geologic setting. To provide a practical output as a science support tool for several types of missions, a classification scheme is being developed that segments a surface image into geological features that are visually distinct based on morphology, tone, and texture. This will be adapted for specific missions. See Figure 1 for a hand-labelled example.
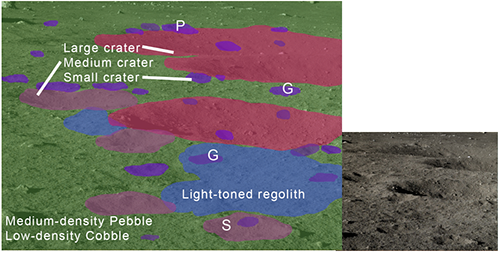
Figure 1: Hand-labelled lunar terrain classification example. Letters indicate crater degradation; P: Pristine; S: Semi-Degraded; G: Ghost. Right: original Yutu-1 image. Credit: CNSA.
Technology
Algorithms and Software
ASAS-CRATERS comprises three algorithms. First, the terrain classifier consists of a deep-learning encoder-decoder style network which classifies each image pixel into semantic terrain labels. Second, the novelty detector uses a semi-supervised convolutional neural network architecture with an autoencoder module and a binary classifier that work in series. Third, a data aggregator will combine the outputs on map tiles that are useable by onboard algorithms, lightweight for more efficient downlink, and enables faster backroom analysis and integration into GIS tools. See Figure 2 for a conceptual illustration of how ASAS-CRATERS outputs would be aggregated onto map tiles.
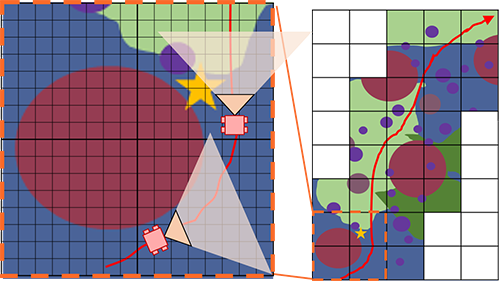
Figure 2: Hand-made illustration of aggregating terrain classifier data on orthorectified map tiles.
In the near future, additional algorithms will be developed to extend the capabilities of this autonomy system. This primarily includes an autonomous instrument targeting capability so that lunar science instruments, on rovers in particular, can use ASAS-CRATERS to identify and select features for targeting.
Sensors and Computing Hardware
ASAS-CRATERS will be embedded on the Q8S, a high-performance, low-power Xilinx Zynq UltraScale+ System-on-Chip FPGA designed by Xiphos Technologies, which will fly in 2020. The Q8S consumes 3W at minimum and measures 90g and 80x80x22.3mm. Embedded on a flight-ready COTS system, ASAS-CRATERS can be rapidly integrated onto payload suites, rovers, and landers, offering low-cost advanced computing capabilities.
Concept of Operations
Prior to deployment on a mission, ASAS-CRATERS’ machine learning algorithms will require training using relevant expert-labelled images from lunar and analogue datasets. Once a mission begins, the algorithms will be updated with images collected in situ. ASAS-CRATERS can then be used to classify terrain and detect features during nominal rover operations. The science team can integrate ASAS-CRATERS data products into their terrain analysis and make decisions on whether specific features merit deeper investigation using onboard instruments.
Use Cases and Benefits
ASAS-CRATERS can benefit science missions in several ways. First, it can support science operations in tactical cycles. Novelty detection can aid scientists that may miss features or spend valuable time in looking for them. The terrain classifier data products are low-dimensional representations which optimizes downlink. The classification itself can speed up scientific analysis in rapid tactical cycles and this becomes increasingly more useful in complex scenes diverse in mineralogy and lithology. Second, for high-priority features, onboard algorithms can perform instrument targeting and data triage for downlink prioritization. Third, as a semantically useful terrain representation, it can be used by advanced robotics algorithms to enable autonomous and intelligent navigation. Fourth, in human exploration architectures, ASAS-CRATERS can be embedded with crewed systems to provide autonomous capabilities that can support astronauts in geological field excursions.
Field Tests and Demonstrations
The terrain classifier was first developed by Mission Control under the Autonomous Soil Assessment System project [3]. In 2019, it was used to classify eight Mars-relevant terrain types in real-time at ~15 FPS (see Figure 3 for an example). This was a part of tests in Iceland under SAND-E (Semi-Autonomous Navigation for Detrital Environments), a NASA PSTAR funded project led by Dr. Ryan Ewing at Texas A&M University.
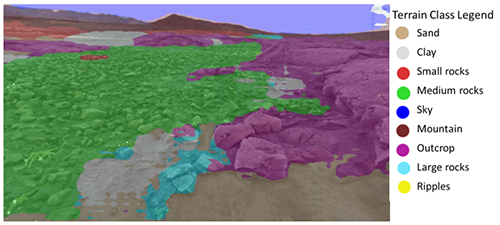
Figure 3: Classifier output overlaid on one camera image during a SAND-E traverse in Iceland field tests.
While ASAS-CRATERS is a multi-mission payload, near-term demonstrations are targeted for upcoming lunar missions in 2022 and 2023.
Acknowledgements
The authors would like to thank the Canadian Space Agency (CSA) for funding the development of ASAS-CRATERS and previous technology developments.
References
[1] Francis R. et al. (2014) SpaceOps. DOI: 10.2514/6.2014-1798. [2] Gaines D. et al. (2016) PlanRob, 115-125. [3] Faragalli M. et al. (2018) i-SAIRAS.
How to cite: Raimalwala, K., Faragalli, M., Battler, M., Smal, E., Reid, E., Cloutis, E., Osinski, G., Ewing, R., Skonieczny, K., and McIsaac, K.: Onboard Science Autonomy for Lunar Missions: Deep-Learning Based Terrain Classification and Novelty Detection, Europlanet Science Congress 2020, online, 21 Sep–9 Oct 2020, EPSC2020-405, https://doi.org/10.5194/epsc2020-405, 2020.
Since the discovery of the first planets orbiting other stars in the 1990’s, the field of exoplanetary study has come to understand that Earth-like planets, i.e. rocky planets in the habitable zone, are more common than previously thought. Astronomical spectropolarimetry will hold the key in characterizing these exoplanets, including deriving their atmospheric and surface properties from linearly polarized light, such as the presence of oxygen, liquid water, continents, oceans, clouds, vegetation, ice, deserts; and even their circularly polarized biomarkers – signs of homochiral extraterrestrial life. But, in order to recognize life in the Universe, we ought to first use life on Earth as an observational benchmark.
We present a novel spectropolarimetric instrument design: LOUPE, the Lunar Observatory for Unresolved Polarimetry of the Earth (Klindžić+, submitted), which aims to observe the Earth from the Moon as if it were an exoplanet and perform spectropolarimetric measurements spanning the full range of phase angles. Various reasons make observing the Earth from the Moon or from a Lunar orbit, rather than a low Earth orbit, crucial to the experiment:
LOUPE’s science requirements include:
- Perform near-instantaneous (snapshot) spectropolarimetry of the entire Earth.
- Detect the presence of liquid water oceans and clouds.
- Derive and monitor atmospheric properties, e.g. via Rayleigh scattering, for potential climate research applications.
- Detect the O₂A band in flux and polarization and its variance with cloud cover, altitude and phase angle.
- Detect the Chlorophyll Green Bump and Vegetation Red Edge, the spectroscopic signature of plant life.
- Derive a map of continents from the disk-integrated signal and identify notable features, such as rainforests, deserts and ice caps.
LOUPE shall perform its science goals by recording and demodulating the disk-integrated Stokes vector of sunlight reflected from the Earth. The leading instrument design principle adopted for LOUPE is to create a compact, low-mass, low-volume, space-ready hyperspectropolarimeter with no moving parts. These constraints require creative solutions from the cutting edge of hyperspectral and polarimetric instrument design, where polarimeters traditionally used active rotating optics (temporal modulation) or beam-splitting (spatial modulation).
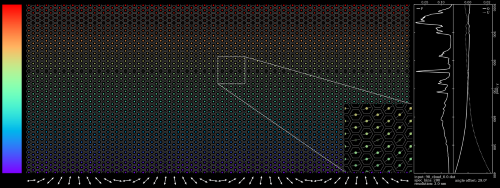
The latest LOUPE concept (Fig. 1.) utilizes Patterned Liquid Crystal (PLC) plates for encoding polarization information as a modulation orthogonal to the spectral flux measurement, enabling the linear-Stokes vector of a target to be recorded in one single “snapshot”, as shown in Fig. 2. Unlike a traditional rotating-retarder polarimeter, polarization is modulated in the cross-spectral direction, meaning polarimetry can be performed at full spectral resolution, which is not possible in the case of channeled spectropolarimetry with spectral modulation. This pioneering use of Patterned Liquid Crystals makes it possible to forgo the use of moving elements, resulting in a compact, space-ready instrument with versatile options of installation on a range of landing, roving and orbiting missions.
Fig 1: Tentative design of LOUPE.
.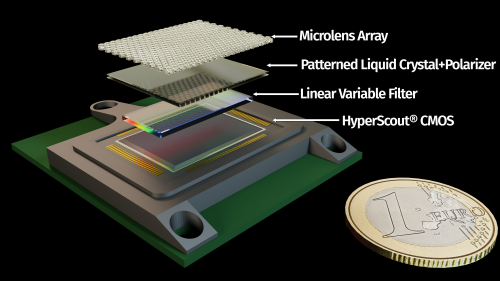
Figure 2: Simulated LOUPE measurement. Wavelength filtering is applied in the y-direction, and polarization modulation in the x-direction. Each dot represents an unresolved image of the Earth.
How to cite: Klindžić, D., Stam, D., Snik, F., Pallichadath, V., van Dijk, C., and Esposito, M.: LOUPE: Spectropolarimetry in the Search for (Extra)Terrestrial Life, Europlanet Science Congress 2020, online, 21 Sep–9 Oct 2020, EPSC2020-887, https://doi.org/10.5194/epsc2020-887, 2020.
Introduction: With multiple human missions to nearby planetary bodies planned for the incoming years, humankind will become an interplanetary species. Future human missions to the Moon, Mars and other planetary bodies will mandatory need to raise plants for feeding astronauts in order to avoid the increase of weight from Earth [1, 2].
How plants will grow on the Moon where gravity is six times lower than Earth´s gravity? That simple question was the origin of Green Moon Project (hereafter GMP) early in 2016. Since then, the GMP team has been working in a very intense way to provide a scientific, technical and consistent answer. Gravity on Earth is 9,807 m/s^2 while on the Moon is 1,622 m/s^2. Therefore, the team was expecting to have a faster plant stem growth on the Moon than on Earth because of the gravity difference at the same time interval. GMP objective is to determine how the germination of a seed and subsequent growth of the plant stem under the effects of lunar gravity would be, providing a consistent response in astrobiological and
spatial topics with the capability of developing its own scientific instrument. The project importance is that it can provide knowledge on the plants growth and the plant physiological consequences under the effects of lunar gravity. It will help to achieve important goals like oxygen production, carbon dioxide removal, food production in future human bases on the Moon (as proposed by the Moon Village concept established by the European Space Agency) and on Mars [1, 3, 4].
The GMP is developed by using different facilities in United Kingdom (Wrexham Glyndwr University), China (laboratories of the Center of Space Exploration at the University of Chongqing) and Spain. In this latter country, we are using the laboratories of the Instituto de Geociencias of Spain (IGEO) located in Madrid and Lanzarote (Canary Islands). In fact, the tests in Lanzarote are very important due to the recognized relevance of the archipielago as lunar and Mars analogue [5, 6] Among other geological features, the basaltic composition, the good preservation of Lanzarote and the lava tubes are extremely important aspects to be considered with regards to the future experiments. ()
Instrument: The GMP prototype (Figure 1) has O2, CO2, temperature and humidity sensors together with a camera (which is designed to take pictures every 8 hours to help plant growth measurements) and a LED illumination system with blue, red and far red which are the colours from the light spectrum that allow the photosynthesis without having natural sun light (avoiding to depend on Lunar daylight). A seed release system is also developed.

Figure 1. Original GMP capsule.
Plant sprouts on an extraterrestrial body for first time ever on January 3rd 2019 thanks to the Lunar Micro Ecosystem mini self-sustaining biosphere experiment aboard China’s Chang’e-4 lander (the first ever biological laboratory to land on the Moon) [1, 2]. The experiment was composed of air, water, nutrients, potatoes, Arabidopsis plant seeds, and silkworm eggs. The intention was that the silkworms would hatch and produce carbon dioxide which the potatoes and Arabidopsis seeds would absorb, emitting oxygen that would then help the silkworms. But intense cold quickly killed the organisms [1]. The Chinese capsule, an insulated aluminum container, has a diameter of 173 mm and height of 198,3 mm. The weight is 2,608 kg. It has a water bump system, seedbed and a live-streamed camera inside, and its own energy supply on the far side of the Moon. It is pressurized to sea level Earth pressure with a standard Earth atmospheric composition.
Due to similarities between this latter instrument and GMP capsule, both teams started a collaboration to joint efforts and resources. After the agreement achieved, both GMP and chinese teams collaborate to improve a joint instrument. Besides the systems from the original GMP capsule, the Spanish team will also include technical knowledge related to: plant growth measurement system, capsule temperature control system (to achieve an average temperature to allow the plant life avoiding the -233ºC to +123ºC difference temperature on the Moon) radiation measurement system and image taken system together with mirrors to achieve a wider perspective of the capsule interior. On the geological side, Earth soil and simulant of Lunar regolith as well as some field and IGEO lab experimentations at Lanzarote and Chinijo Islands UNESCO global geopark and Corona lava tube. On the biological side, Polycarpaea Robusta together with many other recommendations are provided [6].
Summary: it will be possible to obtain scientific knowledge related to how Lunar gravity affects plant growth as well as cosmic radiation does too. This will head to understand in more detail how to naturally protect from cosmic radiation and how to grow plants on the Moon or Mars for crops (food), O2 production and CO2 removal. This will support the Moon Village concept and future human missions to Mars. Aknowledgements: The GMP counts with the Cabildo of Lanzarote and Lanzarote UNESCO Geopark supports.
References:
[1] Tibbetts, J. H. (2019). Gardening of the Future—From Outer to Urban Space. BioScience, 69(12), 962-968.
[2] D. Castelvecchi, M. Tatalović, “Plant sprouts on the Moon for first time ever”, Nature, January 2019.
[3] J. Woerner, B. Foing, Moon Village International Support Group, “The Moon Village concept and initiative”, ESA ESTEC, 2016.
[4] E. Sánchez-Rodríguez, “Scientific Report for ‘Green Moon Project’: Possible Physiological Effects on Plant Generation and Growth Under Lunar Conditions”, InnoPlant, March 2017.
[5] J.A. RodríguezLosada, S. Hernández-Fernández, J. Martínez-Frías, L.E. Hernández, R. Lunar Hernández, “Study of Lunar Soil From Terrestrial Models (Canary Islands, Spain)”, ISRM-IWVE-2010-041, 2010.
[6] E. Mateo, J. Martínez-Frías, J. Vegas, “Lanzarote and Chinijo Islands Geopark: From Earth to Space”, 978-3-030-13129-6, 2019.
How to cite: Ortega-Hernandez, J. M., Martinez-Frias, J., Pla-Garcia, J., and Sanchez-Rodriguez, E.: Green Moon Project: encapsulated and pressurized habitat for plants on space, Europlanet Science Congress 2020, online, 21 Sep–9 Oct 2020, EPSC2020-22, https://doi.org/10.5194/epsc2020-22, 2020.
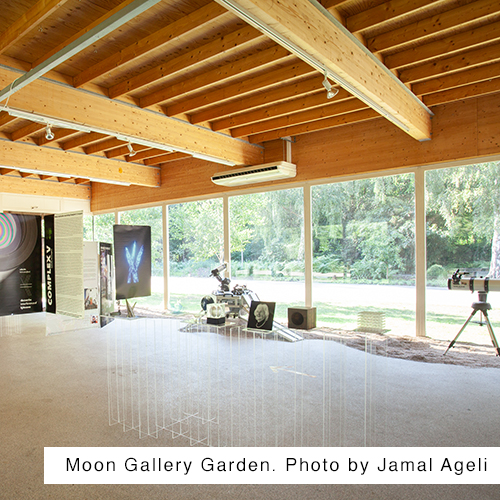
Moon Gallery Garden
We will give a report on Moon Gallery Garden exhibition 6 June to 12 July, 2020, Amsterdam and give an update on recent Moon Gallery activities and steps towards the implementation of establishing the first gallery of art, artefacts and science on the Moon.
A lunar lander with rovers and telescopes settled at Zone2Source in the Glass House, Amsterdam along with a selection of artworks and prototypes designed to be sent to the Moon by the end of the year 2022. The exhibition also included astronaut performances while wearing spacesuits to ensure safety and avoid contamination.
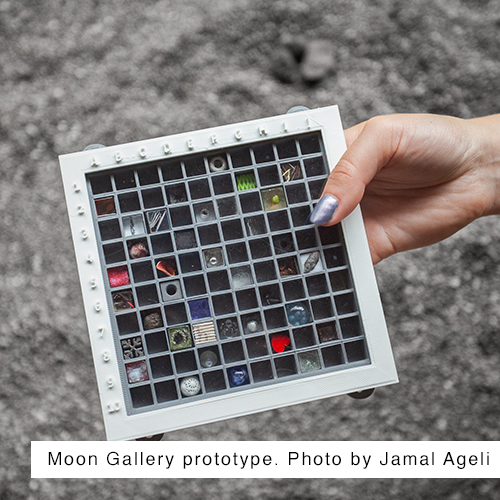
About Moon Gallery:
Moon Gallery aims to set up the first permanent gallery on the Moon. Moon Gallery intends to launch 100 artefacts to the Moon within the compact format of 10 x 10 x 1cm plate on a lunar lander exterior panelling as early as 2022. In this Petri-dish-like gallery, we are developing a culture for future interplanetary society. What are the ideas we want to promote into the future? What are the ideas we want to leave behind?
Moon Gallery as a pilot platform within the framework of the Moon Village, ITACCUS & ILEWG aims to instigate inspiration for the global space exploration and demonstrate how the challenges along this journey drive innovative design thinking and interdisciplinary collaborations. ILEWG Art Moon Mars collective leads this project, coordinates events and develops content through a series of open calls.
Relevance/Significance:
Size is one of the biggest challenges of space exploration and the disparity between big ideas and resources for their realisation often stands in the way of many experiments. We ask our participants to think big but small - each idea has to fit within just 1 cubic cm. Creativity is defined as the production of ideas or solutions that are novel and useful (Amabile,1988, 1996). Constraints can give creativity a purpose, a perspective, a starting point. Constraints make us feel challenged and in particular, this statement is accurate for the subject of space.
The most challenging and full of constraints environment – Moon – should bring us to the most creative culture and society we believe. At the moment the human presence beyond the Earth is only a matter of survival, but how to make the first step towards making it habitable?
We suggest bringing this collection of ideas as the seeds of a new culture. We believe that culture makes a distinction between mere survival and life. Moon Gallery is a symbolic gesture that has a real influence – a way to reboot culture, rethink our values for better living on Earth planet.
Moon Gallery is a Manifestation. Neither a place nor an object. Paradoxically a tiny gallery too small for Earth is designed to last on the Moon as a monumental heritage site for thousands of years. Building an everlasting monument, say a pyramid on Earth took a joint effort of a great nation, launching a rocket takes a multinational effort.
Mission Statement:
We hope to bring the best of humanity to the Moon and to bring the benefits of the Moon to all people on Earth through a sustainable exploration process. Our initiatives connect Art, Moon, Mars and beyond. This includes the organisation of meetings, workshops, art-science-space classes and projects at various universities, sessions at international conferences, art exhibitions, musical and visual performances, and art-science-space platform – Moon Gallery Foundation.
Moon Gallery Objectives:
– promoting cooperation: bridging innovation, science and art, crossover with space research, developing a space art experiment;
– stimulating research: a collective reflection on artistic heritage, analysis – how to design for space (1/6th gravity, extreme environment);
– promoting artistic quality: offering artists follow up opportunities involving space science expertise;
– reinforcing international position of artistic practice: "International cooperation towards a world strategy for the exploration and utilization of the Moon - our natural satellite" (International Lunar Workshop, Beatenberg (CH), June 1994).
Acknowledgements:
We acknowledge Hans Broymans and Alice Smits (Zone2Source) for the support of the Moon Gallery Garden in 2020; Moon Gallery Garden Participating artists: Eva Petric, Aneta Zeleznikova, Lakshmi Mohanbabu, Jamal Ageli, Ronald Vles, Ilaria Cinelli, Isabella Douzoglou, Eduardo Kac, Mai Wada, Andy Gracie, Oded Ben-Horin, Priyanka Das Rajkakati, Hady Milani, Sophie Hooghiemstra, Max Baraitser Smith, Sofia Chin, Zuza Banasinska, Renato Japi, Tobias Schalm & Alban Muret, Minna Philips, Maria Polushkina, Johan Recen Larsson, Hans Brooymans, Mary Kuiper, Alexandra Arshanskaya, Badriah Hamelink, Thomas Heidtmann, Anastasia Izotova, Jorick De Quaasteniet, Arina Livadari, Daria Kozhina, Daria Akhrameika, Maria Beaumaster & Sarah Bovelett, Studio Samira Boon, Dana Lamonda, Mark IJzerman, Martin Sjardijn, Guy Livingston, Alexandra Ljadova, Lisa Van Casand, Studio Furthermore, Gabriele Lorusso, Emmanuele Villani. We thank Cesare Barbieri for hosting Moon Gallery lecture at Rotary Club, Università di Padova; EuroMoonMars analog astronauts and colleagues who deployed and tested the gallery prototype at various analogue campaigns: EMMIHS Hawaii, Igluna Zermatt and EMM Iceland. We thank ILEWG and IAF ITACCUS for endorsing the project. We acknowledge Alexander Zaklynsky contribution to the project in 2018.
How to cite: Glukhova, E., Sitnikova, A., Foing, B., Ageli, J., and Kuiper, M.: Moon Gallery Garden: Moon Gallery update 2020, Europlanet Science Congress 2020, online, 21 Sep–9 Oct 2020, EPSC2020-703, https://doi.org/10.5194/epsc2020-703, 2020.
Please decide on your access
Please use the buttons below to download the presentation materials or to visit the external website where the presentation is linked. Regarding the external link, please note that Copernicus Meetings cannot accept any liability for the content and the website you will visit.
Forward to presentation link
You are going to open an external link to the presentation as indicated by the authors. Copernicus Meetings cannot accept any liability for the content and the website you will visit.
We are sorry, but presentations are only available for users who registered for the conference. Thank you.