Poster presentations and abstracts
The EPSC symposium "Open Lunar Science & Innovation” will address:
- Celebrating the legacy of Apollo and Luna programmes after 50 years
- Recent lunar results: geochemistry, geophysics in the context of open planetary science and exploration
- Synthesis of results from Clementine, Prospector, SMART-1, Kaguya, Chang’e 1, 2 and 3, Chandrayaan-1, LCROSS, LADEE, Lunar Reconnaissance Orbiter, Artemis and GRAIL
- First results from Chang'E 4, Chandrayaan2,
- Goals and Status of missions under preparation: orbiters, Luna25-27, SLIM, , Commercial landers, Chang'E 5 and Lunar sample return missions, Future cargo landers,
- Precursor missions, instruments and investigations for landers, rovers, sample return, and human cis-lunar activities and human lunar surface sorties (Artemis and others)
- Preparation for International Lunar Decade: databases, instruments, missions, terrestrial field campaigns, support studies
- ILEWG and Global Exploration roadmaps towards a global robotic/human Moon village
- Strategic Knowledge Gaps, and key science Goals relevant to Lunar Global Exploration
- The Moon Village with the goal of a sustainable human and robotic presence on the lunar surface as an ensemble where multiple users can carry out multiple activities.
- The Moon for planetary science, life sciences, astronomy, fundamental research, resources utilisation, human spaceflight, peaceful cooperation, economical development, inspiration, training and capacity building.
- How a laboratory on the Moon should be equipped to be useful for a variety of disciplines, including geology, biology, and chemistry
- How can the Moon Village serve as a stepping stone for exploration of Mars and planetary bodies even further away?
- Historical, societal, humanistic aspects of lunar exploration
Lunar science and exploration are developing further with new and exciting missions being developed by China, the US, Japan, India, Russia, Korea and Europe, and with new stakeholders.
Session assets
The Lunar Laser Ranging (LLR) investigations have provided time high-precision measurements of geodesy, dynamics and distance of the Earth-Moon system, and inferences about lunar interior and gravitational physics. LLR studies are supported by a total of five passive Laser Retro-Reflectors (LRR) placed on the Moon surface by the past missions Apollo-11, -14, -15 and Luna-17 and -21. The detection of their positions is decisive to improve the measurement accuracy and the data from alternative instrumentations contributed to their analysis. The Lunar Reconnaissance Orbiter Camera (LROC) operated by using the Standardized Lunar Coordinate System as reference system has acquired images of the Moon surface that represent data applicable to LLR planning and research. Several LROC images present nominal lighting conditions and solar glints reflected off of an LRR. Glints represent specular reflections of light that define higher-precision measurement of LRR position. In this way, their detection plays an important role in LRR analysis. The identification of candidate images with solar glints through time allows researchers to record these measurements. NASA and INFN-LNF (National Lab of Frascati) have collaboratively developed an LLR tool to support glint identification. The tool can be accessed using the Moon Trek (https://trek.nasa.gov/moon) which is one of the web based interactive visualization and analysis portals provided by the NASA’s Solar System Trek (https://trek.nasa.gov) project. The tool facilitates current ranging studies as well as planning of future missions that involve ranging activities such as future retroreflector deployments. Glint identification has been performed by using the LLR tool that allows us to investigate the image data, and to compute geometric calculations and LLR analyses. The tool with SPICE computations is provided to search for nominal conditions to catch a solar glint off of a retroreflector, to search for time intervals in which a reflector can be seen from a ground station on Earth, and to search in PDS database for images with these conditions. Moon Trek’s LLR tool allows us to find time intervals when spacecraft positioning was able to catch a solar glint reflected off of a retroreflector by setting the maximum incidence and phase angles. This analysis is accompanied by the search for LROC images available in Planetary Data System (PDS) that have solar glint off the LRR. Using the Moon Trek, it is possible to identify LROC images with solar glint off the LRR and to recognize optimal LROC candidates. This research allows us to identify good examples of LROC images that present solar glints. More than six candidate images over a period of 10 years of LROC data were recognized. In this contribution, we present the recognized LROC candidates and we show their detection in the image data, by avoiding the bias of the surface high albedo and the morphological pattern that can interfere with the analysis. The identification of solar glints off LRR will allow us to find previous observation that might be incorrect and to measure the LRR position in the Standardized Lunar Coordinate System of LROC images. These measures will be then compared with the ephemeris calculations obtained from LLR data.
How to cite: Rossi, C., Gallegos, N., Filomena, L., Malhotra, S., Law, E., Porcelli, L., Dell'Agnello, S., and Day, B.: LROC candidate images with solar glints off Lunar Laser Retroreflectors: A dedicated tool of NASA's Moon Trek, Europlanet Science Congress 2020, online, 21 Sep–9 Oct 2020, EPSC2020-614, https://doi.org/10.5194/epsc2020-614, 2020.
1. Abstract
This presentation will outline the development status of the PROSPECT payload for Lun27 and highlight the science goals and some of the work on-going to ensure that these goals can be met.
2. Introduction
The Package for Resource Observation and in-Situ Prospecting for Exploration, Commercial exploitation and Transportation (PROSPECT) is a payload in development by ESA for use at the lunar surface. Current development is for flight on the Russian-led Luna-Resource Lander (Luna 27) mission, which will target the south polar region of the Moon. PROSPECT will perform an assessment of volatile inventory in near surface regolith (down to ~ 1 m), and analyses to determine the abundance and origin of any volatiles discovered. Lunar polar volatiles present compelling science and exploration objectives for PROSPECT, but solar wind-implanted volatiles and oxygen in lunar minerals (extracted via ISRU techniques) constitute potential science return anywhere on the Moon, independently of a polar landing site. PROSPECT is comprised of the ProSEED drill module and the ProSPA analytical laboratory plus the Solids Inlet System (SIS), a carousel of sealable ovens (for evolving volatiles from regolith).
In ensemble, PROSPECT has a number of sensors and instruments (including ion-trap and magnetic sector mass spectrometers, imagers, and sensors for temperature, pressure, and permittivity) that form the basis for a range of science investigations that are (almost all) led by the PROSPECT Science Team:
- Imaging, Surface Modelling and Spectral Analysis
- Drilling, Geotechnics and Sample Handling
- ProSPA ISRU Precursor Experiments
- ProSPA ISRU Prospecting
- ProSPA Light Elements & Isotopes
- ProSPA Noble Gases
- Thermal Environment and Volatile Preservation
- Permittivity (ESA-led)
3. Development status and current activities
PROSPECT Phase C, ‘detailed definition’, began in December 2019. A plan of research activities is in progress to gain from and guide on-going development, build strategic scientific knowledge, and to prepare for operation of the payload.
Drill Testing. Testing of the ProSEED Development Model was carried out in December 2019 as part of the final Phase B activities. Test procedures were formulated to demonstrate drilling and sampling functionality in ambient, cold and thermal vacuum (TV) laboratory conditions (at CISAS, University of Padova). Tests included drilling into, and sampling from, well-characterized NU-LHT-2M simulant mixed with anorthosite inclusions of various sizes, according to a layered scheme that describe depth-density profile and distribution of inclusions and a range of plausible water ice contents.
ProSPA Bench Development Model (BDM). The BDM of the ProSPA analytical lab at the Open University has been tested to demonstrate science performance against measurement requirements. Dedicated efforts in 2019 focused on verification of evolved gas analysis (EGA) via measurement of meteorite standards, constraint of oxygen yield via demonstration of ISRU capabilities, improving understanding of sensitivity of science requirements to regolith volatile abundance and possible contamination, and understanding the performance of oven seal materials.
4. Volatile preservation
Particular efforts since 2018 have focused on understanding the capability of PROSPECT to sufficiently preserve volatile content in regolith throughout the sampling-analysis chain: from drilling to sealing of the ovens, until measurement of evolved gases in ProSPA’s ion-trap and magnetic sector mass spectrometers. PROSPECT’s ability to meet science requirements must persist for the range of possible volatile contents expected in near-surface regolith at landing sites in the lunar south polar region.
How to cite: Heather, D., Sefton-Nash, E., Fisackerly, R., Trautner, R., Barber, S., Reiss, P., Martin, D., and Houdou, B.: The ESA PROSPECT Payload for Luna27: Development Status, Europlanet Science Congress 2020, online, 21 Sep–9 Oct 2020, EPSC2020-672, https://doi.org/10.5194/epsc2020-672, 2020.
Lunar impact flashes: first detection from the Observatory of Nice
Avdellidou(1),M. Delbo(1), E. Munaibari(1), R. Larson(2), J. Vaubaillon(3), P. Hayne(2), D. Sheward(3), A. Cook(3)
- (1)Laboratoire Lagrange, Observatoire de la Côte d’Azur, UCA, France
- (2)University of Colorado, USA
- (3)IMCCE, Observatoire de Paris, France
- (4)Aberystwyth University, UK
contact: chrysa.avdellidou@oca.eu
Abstract
We report the first lunar flash due to meteoroid impact observed by our team at Observatoire de la Côte d’Azur (OCA) in south France.
Introduction
Meteoroids impacting onto the lunar surface can produce very short bursts of light–commonly calledimpact flashes. Such flashes have been the subject of several lunar monitoring surveys over the last 20 years (1,2,3) for the purpose of determining the size frequency distribution of near-Earth objects in the cm–dm size range. The goal of our international team is to build a network of moderate telescopes that will survey the lunar surface for impact flashes and subsequently locate the produced impact craters. We have developed all the necessary algorithms in order to detect the flash events in real time during the observations, identify the selenographic coordinates, link the meteoroid to a parent meteoroid stream, measure the mass and size of the meteoroid (4) and discover the potential fresh lunar crater. Updates on the methodology is presented by the accompanying EPSC 2020 abstract of Munaibari & Larson et al. The description of the crater identification is presented by the accompanying EPSC 2020 abstract of Sheward et al.
First confirmed impact flash from OCA
On the night of May 27th, 2020 at 20:48:49.420 UTC, we detected our first impact flash from the Observatoire de la Côte d’Azur (site of Mt. Gros). This is the first live impact observed for the project "Flash!", the first from the Observatoire de la Côte d’Azur and the first from all France by professional sites. The telescope used is a 16" MEADE coupled with a CMOS ASI ZWO 183mono camera. The frame rate was 20 fps and the frame integration time was 0.05 sec. The telescope was guiding on the lunar crescent using the lunar autoguider that we developed in the framework of the master course of MAUCA (University of Côte d’Azur).
Acknowledgements
This work was supported by the ProgrammeNational de Planetologie (PNP), France ofCNRS/INSU, co-funded by CNES, France and bythe program "Flash!" supported by Crédits Scientifiques Incitatifs (CSI), France of the UniversitéNice Sophia Antipolis. This work has made use ofdata from the European Space Agency (ESA) NELIOTA project. We thank the EUR Spectrum for supporting Mr. Munaibari with a 3-monthUCA Master Scholarship to perform this masterthesis.
References
[1] J. L. Ortiz, et al.A&A,343: L57–L60, (1999).
[2] J. L. Ortiz, et al. Nature, 405:921–923, (2000).
[3] R. M. Suggs, et al.Icarus,238:23–36, (2014).
[4] C. Avdellidou & J. Vaubaillon.MNRAS, 484(4):5212–5222, (2019).
How to cite: Avdellidou, C., Delbo, M., Munaibari, E., Larson, R., Vaubaillon, J., Hayne, P., Sheward, D., and Cook, T.: Lunar impact flashes: first detection from the Observatory of Nice, Europlanet Science Congress 2020, online, 21 Sep–9 Oct 2020, EPSC2020-744, https://doi.org/10.5194/epsc2020-744, 2020.
Performing radio astronomy observations from the Earth’s surface is plagued with interference issues. The Earth and its surrounding atmosphere, particularly our ionosphere, are massive sources of natural interference. There are also human sources of interference. There have been several studies attempting to solve the issues surrounding radio observations. One such solution is to find radio-quiet zones, such as the far side of the Moon. In his article "Farside explorer: unique science from a mission to the farside of the moon" David Mimoun states that the Moon is "the most radio-quiet environment in near-Earth space." [1] The far side of the Moon is insulated from Earth's various interference sources. This certainly makes it a great candidate for radio astronomy. [2][3]
Due to the rotation and orbiting speed of the Moon, the same side of the Moon is always facing Earth. However, the building of a radio antenna array on the Moon and operating it would be costly. Therefore, tests must be prepared on Earth in advance. These tests are performed with the EuroMoonMars project. Using the Radio Jove receiver with dipole antennae, Solar and Jovian observations will be performed. These observations can be compared with data from other radio telescopes and arrays. This would allow radio astronomy to be tested both as a concept and as a prediction tool for solar weather. Even though the Earth is protected by our atmosphere, the Earth is affected by solar weather. [4] The near side of the Moon will be affected by solar weather and this could be predicted and diagnosed by radio instruments.
During the COVID-19 pandemic and lockdown, observations have been carried out in Bray, Ireland and at The European Space Technology and Research Centre (ESTEC) and Leiden in the Netherlands. These locations are all at similar latitudes. Further observations are planned in Iceland. The EuroMoonMars is launching the CHILL-ICE campaign in 2021 and radio observations will be an integral research topic. Experiments will be carried out to determine the angular response and efficiency of the apparatus in a volcanic region. The rest of the EuroMoonMars CHILL-ICE team deserve thanks for their support of these experiments.
The Earth-based apparatus contains a single dipole, the Radio Jove receiver and a laptop to receiver processed data. The experimental methods can be defined as follows:

Graph 1: Data recorded in Radio Skypipe software, taken on the 15th June 2020, during reported solar prominences.
References:
How to cite: Laffan Downes, E. and Foing, B.: Radio Astronomy from a Lunar Environment Precursor Tests , Europlanet Science Congress 2020, online, 21 Sep–9 Oct 2020, EPSC2020-799, https://doi.org/10.5194/epsc2020-799, 2020.
Abstract
During the 2019-01-21 lunar eclipse a lunar impact flash was observed by more than 20 observing sites, and two published estimates were made as to the location of the impact flash. In this work we present the preliminary results from the utilising PyNAPLE (Python NAC Automatic Pair Lunar Evaluator) with these coordinates in the search for the resultant impact crater. In total, 97 surface changes were detected, two of which being definite impact craters; however evidence suggests that they were formed during separate events to the 2019-01-21 impact.
Introduction
Lunar impact flashes been observed at least 600 times across both professional and amateur observation campaigns[1,2,3]. Despite this large amount of data, there are still unknowns when examining the relationship between the impact flash and the resultant impact crater. The most important unknown being the luminous efficiency, which determines the ratio of incoming kinetic energy converted to light, currently taken as between 10-2 and 10-4 [4]. Another unknown is to do with accuracy of crater scaling laws, which estimate the size of the formed impact crater but are derived from high energy impact tests, which become inaccurate for smaller impacts such as the most common lunar impacts [5].
In order to obtain ground truth data for refining of scaling laws, and further examination of luminous efficiency, PyNAPLE [6] is utilised to locate the resultant crater from hundreds of observed lunar impact flashes. The results discussed here are from a single search performed on the 2019-01-21 lunar impact flash, which coincided with the lunar eclipse and therefore had a number of analyses and location estimates performed [7,8].
Methods
Using images from the Lunar Reconnaissance Orbiter Narrow Angle Camera (LRO NAC), a temporal pair (a pair of 'before' and 'after' images) can be divided highlighting changes between the two images. This process requires a number of constraints to be met, such as illumination angles being within 10o of each other, and being nadir pointing. This limit the number of pairs that can be formed for any location, especially as the events become more recent having less potential 'after' images.
Using PyNAPLE, an exhaustive search can be performed forming each temporal pair in an area around the event location. This allows the identification of new surface features formed between the temporal pair images, which with adequate coverage locates the crater formed during the impact.
The search for the 2019-01-21 crater was performed using literature values, and values calculated by AUGUR [9] (Table 1). Due to the lack of overlap between the coordinate estimates, a search area encompassing the coordinate ranges was used.
| Latitude | Err | Longitude | Err | |
| AUGUR | -30.03 | ±0.00013 | -68.20 | ±0.02 |
| Madiedo et al | -29.20 | ±0.30 | -67.50 | ±0.40 |
| Zuluaga et al | -29.43 |
+0.30 -0.21 |
-67.89 |
+0.07 -0.09 |
Table 1: Locations of the 2019-01-21 impact determined from observations of the impact flash.
Results and Intepretation
During PyNAPLEs ~350 computing hours search, 235 images were evaluated. After eliminating unsuitable images, this left 100 before and 30 after images. In total 108 temporal pairs were formed, and 97 confirmed surface changes identified (Fig. 1). The majority of these changes were small 'splodges' of darkened regolith due to impacts below the resolvable size for the LRO NAC, or ejecta deposits from nearby impacts. Two of the identified changes were clearly identifiable as impact craters (Fig. 2).

Figure 1: The locations of identified changes for the 2019-01-21 impact flash compared to coordinates in literature.
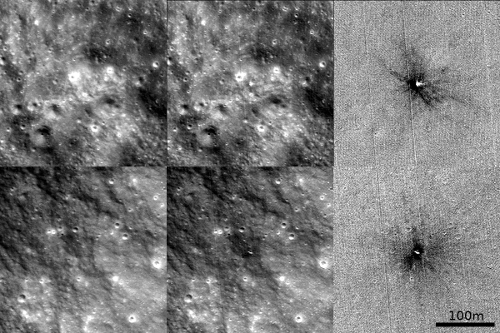
Figure 2: 400x400px 0.7m/px Top: Centred on φ=-28.276, λ=-67.073. Left: 'Before', M1165266223L Centre: 'After', M1315829707L Right: Division of 'After' by 'Before'.
Bottom: Centred on φ=-28.178, λ=-67.234. Left: 'Before' , M1165266223R Centre: 'After', M1315829707R Right: Division of 'After' by 'Before'.
While two confirmed impact craters were formed in the general area the impact flash was observed, it is suspected that these impacts are unconnected to the 2019-01-21 impact flash. This conclusion is drawn from a number of reasons; the main disqualifying factor is that the impacts are >6 standard deviations outside the coordinate ranges given by all three sources, and are outside the extent visual extent of the flash. For either of these to be the resultant crater, this would indicate that the impact flash originated above the lunar surface, for which there is no known mechanism that could sufficiently explain an elevated flash origin.
Another factor implying no link is the fact that a large gap exists between the latest before images (2015-10-27) and earliest after images (2019-09-25), leaving a 1429 day uncertainty on when these craters were formed, the majority being before the 2019-01-21 event, indicating that they had likely already formed.
The third factor is that, as seen between Figures 1 & 3, the distribution of detected impacts does not cover the entire search area. This is due to a lack of temporal pairs that could be formed, with the majority of temporal pairs overlapping one another. This led to coverage of only 30.5% of the search area, and is therefore P≈69.5 that the true primary impact resides within the unsearched area. Until further images are released from LRO NAC providing further temporal pair coverage, locating the primary crater is impossible.
There are no known impact flashes, other than the 2019-01-21 event, in publicly available observations for the 2015-10-27 to 2019-09-25 period which could feasibly be the source of these craters.
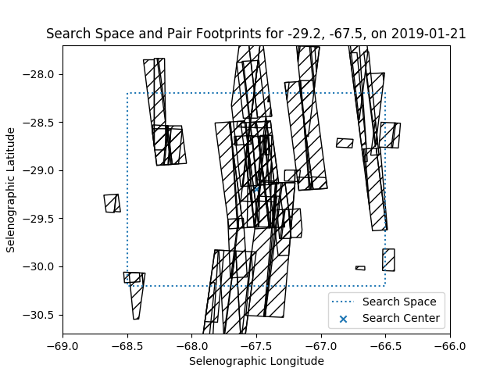
Figure 3: The footprints of searched temporal pairs for the 2019-01-21 impact.
Future Work
The method of temporal pair formation by PyNAPLE for impact flash events is being applied to both the publicly available NELIOTA impact flashes, and impact flashes detected by lunar monitoring at Aberystwyth University, UK, and Université Côte d'Azur, France. Further to this, as new images are released from LRO NAC, events such as the 2019-01-21 impact flash can be assessed for new coverage.
References
[1] Moser, D.E., et al (2015) NASA/TM 218213
[2] Liakos, A., et al (2019) arXiv e-prints
[3] Madiedo, J.M., et al (2015) Planet. Space Sci, 111, 105-115
[4] Ortiz, J.L., et al (2015) MNRAS, 454, 1, 334-352
[5] Horedt, G.P., Neukum, G. (1984) Earth, Moon, and Planets, 31, 265-269
[6] Sheward, D., et al (2019) EPSC-DPS 2019 Abstract 1032-1
[7] Madiedo, J.M., et al (2019) MNRAS, 486(3), 3380-3387
[8] Zuluaga, J., et al (2019) MNRAS
[9] Larson, R., et al (2019) EPSC-DPS 2019, Abstract 1193-3
How to cite: Sheward, D., Cook, A., and Avdellidou, C.: Preliminary Results from Lunar Surface Change Detection with PyNAPLE: The 2019-01-21 Lunar Impact Flash, Europlanet Science Congress 2020, online, 21 Sep–9 Oct 2020, EPSC2020-862, https://doi.org/10.5194/epsc2020-862, 2020.
Among several other projects, to enable a manned space mission to the Moon or Mars, the rovers that will be sent there, as precursors, need to have 3D environment mapping tools. Thanks to them, we will be able to choose the ideal location to build a viable habitat for the future missions. To perform a mapping, there are several techniques. These must be able to work in extreme conditions, like on the Moon in space, where there is no atmosphere or in more mild conditions like Martian atmosphere (7 mbar). In addition, they must not generate heavy digital data to be transmitted to Earth for analysis. Our choice fell on two known techniques, which are relatively quick to use and which comply with the recommendations listed above: LiDAR (Light Detection And Ranging) and 3D stereophotogrammetry. The objective of our thesis was to compare these two 3D tools and to find a suitable mobile platform. This comparison was made by following a protocol that evaluated its techniques on their precision, their resolution and distance measurement compared to the same scene captured under the same initial conditions.
First of all, the equipment used for the rover are quite simple but will provide a basic platform:
- Caterpillar type transmission.
- 2 DC Motors.
- 3,000 mAh battery.
- Microcontroller: Raspberry Pi3.
- Board extension for the actuators.
- Pan tilt.
- Camera sensor.
There are three main programs for the rover’s control.
- VNC Viewer for the remote control of the SBC.
- Python for the control of the actuator.
- Motion for the display of the video sensor.
Then, we are going to explain what equipment we used to perform the tests. In order to create a LiDAR 3D scanner, we used:
- Sensor: TFmini from Benewake.
- 2 Servomotors (azimuth/elevation): type SG 90.
- Pan tilt.
- Microcontroller: Raspberry Pi 3B.
- Power supply: 20,000 mAh.
- Python: to create an algorithm.
- Software: Matlab (academic version), Meshlab (open source) and VNC viewer for remote control.
Its resolution is 0.5° in azimuth and elevation. Once the mapping of the rover’s surroundings is complete, the scanner saves a csv file with x, y, z coordinates with which we can generate a point cloud in Matlab (Fig.1) or Meshlab.
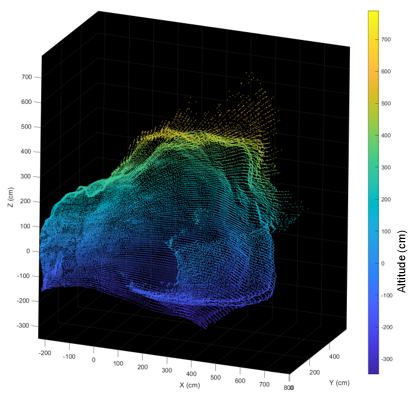
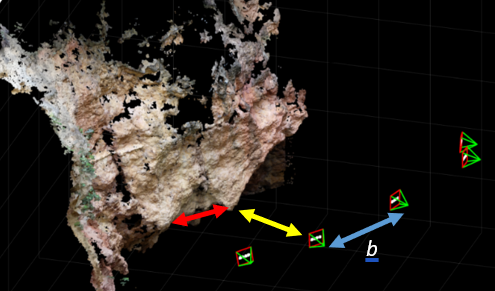
Fig.1: A cave mapped by a lidar 3D scanner. Fig.2: A cave 3D reconstructed using stereophotogrammetry with MicMac software.
For stereophotogrammetry, we used:
- Sensor: camera Fujifilm X-M1 (resolution 4896x3264, FoV: 83°, f=16mm) and webcam Logitech C920 HD Pro (resolution 1920x1080, FoV: 60°).
- Checkboard: needed for calibration, it is not mandatory but highly recommended for the accuracy.
- Software: Micmac (open source provided by French National Geographic Institute) or Matlab (academic version).
Pictures (from 2 to 5) were taken with a random basis b (Fig.2). Furthermore, we needed to know the distance between the camera and a known point in the scene (yellow arrow Fig.2) and a distance between two known points on the scene (red arrow Fig.2) to make the comparison. We did the same protocol with the lidar 3D scanner.
In order to have good results, we need to follow a protocol to obtain exploitable images for stereophotogrammetry. This protocol breaks down into different parts:
- Lighting: the light must be sufficient, constant, and uniform, that’s why the use of flash is prohibited
- Camera settings: pictures must be made with constant parameters, allowing their sharpness, correct exposure, and sufficient definition.
- Lens: focal length must remain the same throughout the acquisition.
- White balance: fixed for all picture in the series.
- Sensitivity: as a rule, avoid going up in ISO.
- Aperture: choose an opening small enough for the entire object to be clear.
- Shutter speed: it should be adjusted to allow proper exposure.
- Save images: in RAW or JPEG (maximum quality) and disable automatic image rotation.
- Image processing: all images must be developed with the same parameters. Check the images before putting them on the platform and always delete those that are blurred. Never crop an image, sometimes this manipulation deletes exif data.
In stereophotogrammetry, we faced one problem, only with the webcam that we used. The software needed some exif data about an image like the focal length used to capture it or the equivalent focal length assuming a 35mm film camera and the webcam did not put any information in the exif. We were able to solve this problem by making a calibration via Matlab software using a checkboard that provide us the intrinsic and extrinsic webcam parameters.
Our progress led us to the following conclusions. First, the stereophotogrammetry is faster than LiDAR even including post processing. Without latency, you can obtain pictures very quickly while LiDAR needs at least 25 minutes with our algorithm to map the rover surroundings. The second point is that LiDAR can map more space from just one position while with stereophotogrammetry you need to move the rover in several points to improve the resolution and accuracy of your 3D reconstruction. That is an important issue because the rover’s movements could be restricted.
However, for best results we can merge the two point clouds from lidar and stereophotogrammetry to obtain the accuracy of lidar and the realism of stereophotogrammetry.
The point of view of the rover camera is distorted by the lack of references of sizes and distances. One simple way to reduce this is to place a pattern in the visual field of the camera. That way the teleoperator will know if the rover can access difficult areas because he will see the future footprint of his rover. A more active way is to measure the range of targets by using Lidar. The restricted point of view of the operator can be compensate by multiple mobile cameras. In fact, multiple cameras can enhance greatly the comfort of the user. Larger field of vision of the user means less stress. Specific cameras can be used for operations (night vision, 360° recording). Installing multiple cameras is not limited to the user comfort, it can also be used by stereophotogrammetry. Indeed, we can add a camera with well-known parameters that will be able to map the field in real-time if we accept reduced information.
How to cite: Aymeric, T., Cesari, U., and Foing, B.: Robotics, stereo vision and lidar for lunar exploration, Europlanet Science Congress 2020, online, 21 Sep–9 Oct 2020, EPSC2020-897, https://doi.org/10.5194/epsc2020-897, 2020.
Introduction:
Since 2002, we develop a freeware to help Moon observing, to improve interest for Moon in general public, and to provide a basic tool for aggregating informations on the Moon for professionals.
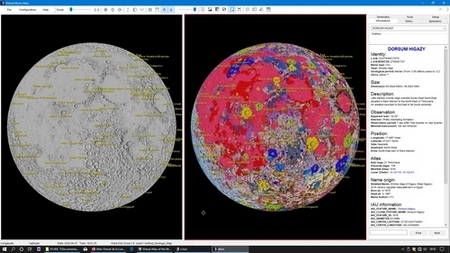
Double windows with "Kaguya / LRO Shaded relief" and "Unified geologic 2020" textures
Presentation :
VMA uses datas coming from NASA, USGS, JPL, LPI and from Dr Robinson, Binder, Gaddis, Zuber, Salamuniccar and Robbins teams, and from Kaguya, Chandrayann 1 and Chang‘é missions.
The software includes management of a complete database (Near 1 400 000 entries) of named, satellite, anonymous or human features on the Moon.
Pictures libraries presenting each named formations from LPI resources and best amateurs shootings are associated and contain more than 8 000 pictures.
VMA 7.0 is only available for Windows 7/8/10.
VMA software has been reviewed in main amateur astronomy magazines (Sky & Telecope, Astronomy , Ciel & Espace, L’Astronomie…) and downloaded more than 1 800 000 times worldwide since 2002.
French, English complete translations and others languages (GE / ES / IT / NL / …) partial translations are included.
VMA software is used by several professional organizations such as IAP Paris, Kitt Peak Observatory, National Japan Observatory, University College London, BBC Sky at night, several astronomy magazines and astronomy writers (P. Harrington, G Cannat…). Recommended by ESA (B. Foing) during SMART 1 mission, registered as educational software by French ministry for education, it has also yet been presented to professionals at 2006 & 2007 LPSC, PCC2 in 2011 and EPSC 2015 in Nantes (France) and to amateurs at 2012, and 2018 "Rencontres du Ciel et de l'Espace" in Paris. Also used in NELIOTA program by ESA / Athens Observ. and for SCHIAMACHY survey on ENVISAT DLR / ESA
Manual :
A 200 pages complete PDF and an online manual are provided.
VMA 7 Software features :
- « Map » window with tabs « Information », « Ephemeresis », « Notes», « Tools », « Setup», …
- Complete rotating Moon globe with coordinates grid and scales
- Second window opening permitting comparisons
- Map and thumbnails display on separate monitors
- Real time or choosen phase and librations display
- Orientation of the lunar disk with powerful zoom
- Formations search function starting from name
- Formations names display according to zoom power
- Orbital viewing simulation
- Integrated notepad for personal notes on formations
- Size and distance measurement tool on maps
- Context menu on right mouse click
- Maps and databases printing with captions setup
- Eyepieces and CCD cameras field simulation
- Full screen display for public videoprojections
- 3D profile of choosen formation when available
Databases :
Included databases contains more than 1 300 000 formations:
- Named formations
- Satellites formations
- Anonymous craters (From S. Robbins & G. Salamuniccar databases teams)
- Human exploration sites (Historical)
- Lisa Gaddis team pyroclastic deposits
- ALPO domes databases
- NELIOTA meteoritic impacts database
For each formation, included informations about :
- Formation geology (except historical)
- Formation localization on lunar disk
- Formation detailed description
- Detailed formation name origin
- Official IAU 2012 datas
All these databases include the “LUN / Lunar Universal Number” conceived by us and permitting quick “naming” and localization of any lunar formation more than 100 m wide (Example : AA2741S114220 > Crater located at 02,741° South and 114,220° East
Datlun : a specific database manager using menus or SQL requests for sortings and extractions on every word of all the databases (600 Mo datas).
Mapping textures :
- JPL airbrush relief with (1500 m per pixel) and without albedo (1000 m per pixel)
- Clementine and Clementine negative (200 m per pixel)
- LRO WAC (60 m per pixel)
- USGS Lunar Orbiter (60 m per pixel)
- CNSA Chang’é 2 (60 m per pixel)
- LOLA-Kaguya-Shaded (60 m per pixel)
- USGS Unified geologic 2020 (500 m per pixel)
Historical textures :
Permitting easy comparisons of pioneers works with present datas :
-Langrenus 1645
- Rheita 1645
- Hevelius 1647
- Divini 1647
- Riccioli 1651
- Cassini 1679
- Tobias Mayer 1791
- Beer & Maädler 1841
- Fauth 1936
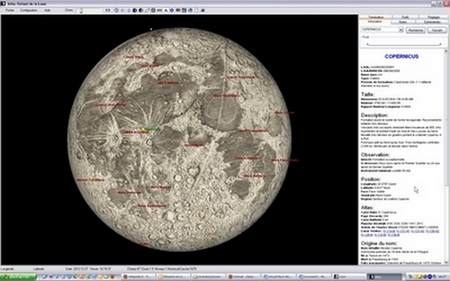
Cassini 1679 historical texture
44 scientific overlays :
Gravity, temperature, altimetric, geologic, various elements as thorium, iron, several neutrons varieties… overlays can be applied on each texture. Double window feature permits comparisons between 2 overlays
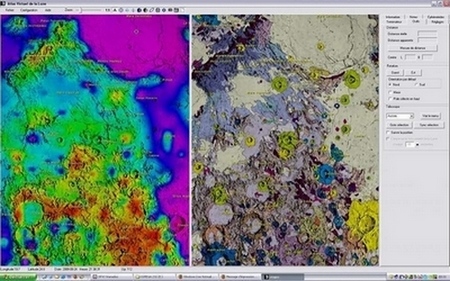
Double window with altitude & geology overlay for correlation search
Pictures libraries :
VMA includes lunar pictures libraries (Near 8 500 pictures) from :
- Lunar Orbiter Photographic Atlas of Moon
- Various lunar probes (Ranger / Luna / LO...)
- Apollo missions mapping and 70 mm Hasselblad
- Consolidated Lunar Atlas
- Lunar Astronautical Charts (LAC) and Lunar Maps (LM) from LPI
- Best amateur lunar imagers (Peach / Cathala / Wirths / Higgins / Dauvergne...)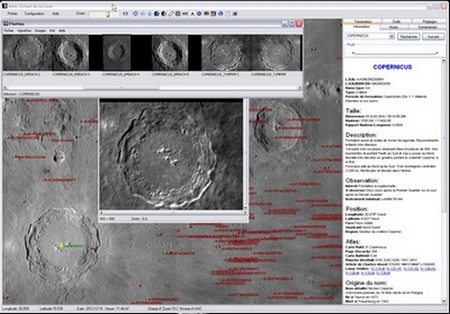
Photlun : specific pictures manager with editing possibilities permitting basic processing included.
Internet connection : 
Weblun module using a special lunar Internet sites database permits connection and interactivity while using VMA.
Distribution :
VMA Pro 7 version and all add-ons collection are freeware and downloadable free from our Web site http://www.ap-i.net/avl/en/start
A SD card complete version can also be ordered on our Web site.
We maintain a discussion forum and we encourage other languages translations.
We also listen continuously to our users requests, (including professionals), trying to update the software with new useful functionalities.
Thanks :
We thank a lot all the amateur and professional persons that support the development of VMA with the permission of using datas, maps or pictures they produce. VMA wouldn't exist without them.
How to cite: Legrand, C. and Chevalley, P.: New Virtual Moon Atlas freeware version 7, Europlanet Science Congress 2020, online, 21 Sep–9 Oct 2020, EPSC2020-942, https://doi.org/10.5194/epsc2020-942, 2020.
Please decide on your access
Please use the buttons below to download the presentation materials or to visit the external website where the presentation is linked. Regarding the external link, please note that Copernicus Meetings cannot accept any liability for the content and the website you will visit.
Forward to presentation link
You are going to open an external link to the presentation as indicated by the authors. Copernicus Meetings cannot accept any liability for the content and the website you will visit.
We are sorry, but presentations are only available for users who registered for the conference. Thank you.