Abstracts with displays | SB
SB1 | Asteroid observations and modelling: properties and evolution of individual objects, families, and populations
Outer main belt asteroid (223) Rosa has been proposed as potential ESA JUICE mission flyby target of opportunity on its way to Jupiter (Avdellidou et al. 2021, Agostini et al. 2022). Rosa is a very dark (p < 0.05) object, with an effective diameter D of about 83 km. The very low albedo and the featureless red spectra indicate a P-type asteroid in the Tholen taxonomy, though the yet known bulk density estimates (2.0 ± 1.1 g cm−3 and 3.1 g cm−3; derived from masses by Fienga et al. 2019 and Park et al. 2021; see also Avdellidou et al. 2021) did not match very well this classification.
Aim of this work was to derive new estimates for the mass and for the bulk density for (223) Rosa. From the gravitational deflection on two small 'test' asteroids during close encounters with the perturber, namely (35525) 1998 FV64 on 2010-12-31.87 and (315162) 2007 FL24 on 2016-07-04.05, the mass of Rosa was derived as M = (3.62 ± 1.25) × 1017 kg (weighted mean of both results). This yields to a bulk density ρ = 1.2 ± 0.5 g cm−3, when adopting an effective diameter of D = 83 ± 8 km, as average of the available literature values. This density agrees well with typical densities for P-type asteroids like (87) Sylvia and (107) Camilla (ρ ≈ 1.3 g cm−3 ; see e.g. Carry et al. (2021), Vernazza et al. (2021)).
References
Agostini, L., Lucchetti, A., Pajola, M., et al. 2022, Planetary and Space Science, 216, 105476
Avdellidou, C., Pajola, M., Lucchetti, A., et al. 2021, A&A, 656, L18
Fienga, A., Deram, P., Viswanathan, V., et al. 2019, Notes Scientifiques et Techniques de l’Institut de Mecanique Celeste, 109
Carry, B., Vernazza, P., Vachier, F., et al. 2021, A&A, 650, A129
Park, R. S., Folkner, W. M., Williams, J. G., & Boggs, D. H. 2021, AJ, 161, 105
Vernazza, P., Ferrais, M., Jorda, L., et al. 2021, A&A, 654, A56
How to cite: Kretlow, M.: An astrometric mass estimate for asteroid (223) Rosa, Europlanet Science Congress 2022, Granada, Spain, 18–23 Sep 2022, EPSC2022-42, https://doi.org/10.5194/epsc2022-42, 2022.
The Gaia mission of the European Space Agency (ESA) was launched in December 2013 and began it scientific operations in July 2014. Gaia is essentially devoted to the measurement of positions, parallaxes, proper motions, brightnesses, and colours of stars. However, Gaia has also obtained astrometric, photometric, and spectroscopic measurements for several hundreds of thousands of asteroids.
The Gaia Data Release 3 (DR3) is the first to contain low resolution reflectance spectra of 60,518 solar system small bodies, the large majority of which are asteroids of the main belt (Gaia collaboration, Galluccio, Delbo et al. 2022). The global survey properties, the methods of data production and validation are detailed in the aforementioned paper published by the journal Astronomy and Astrophysics, which accompanies the DR3, and also summarised in the presentation of Galluccio et al. (2022) at this conference (EPSC 2022).
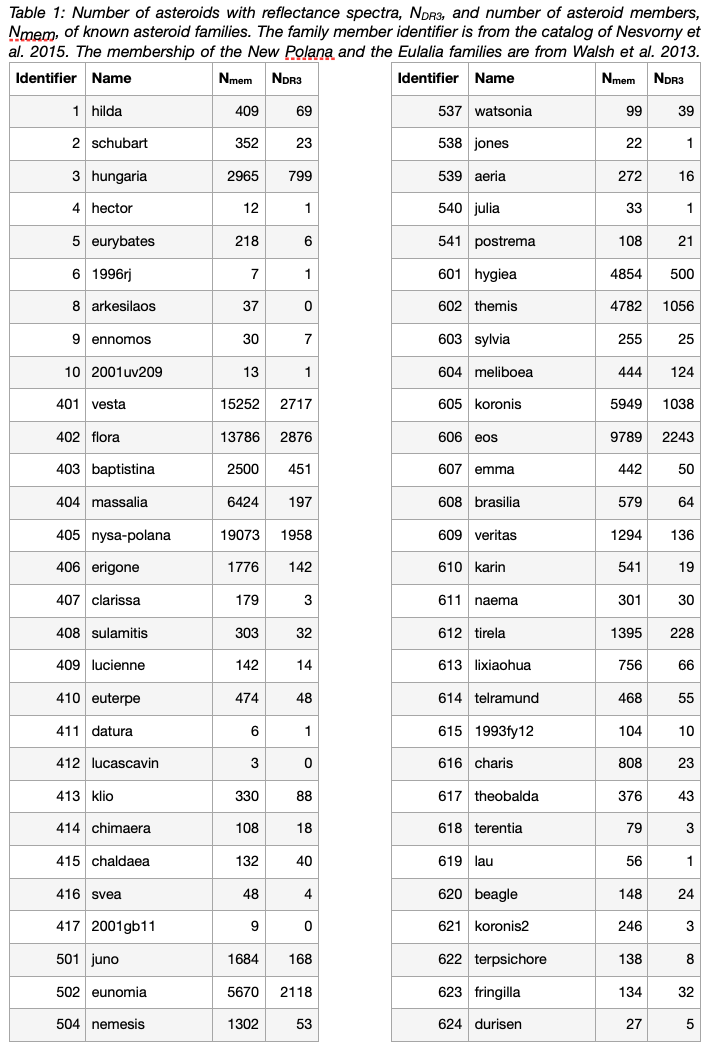
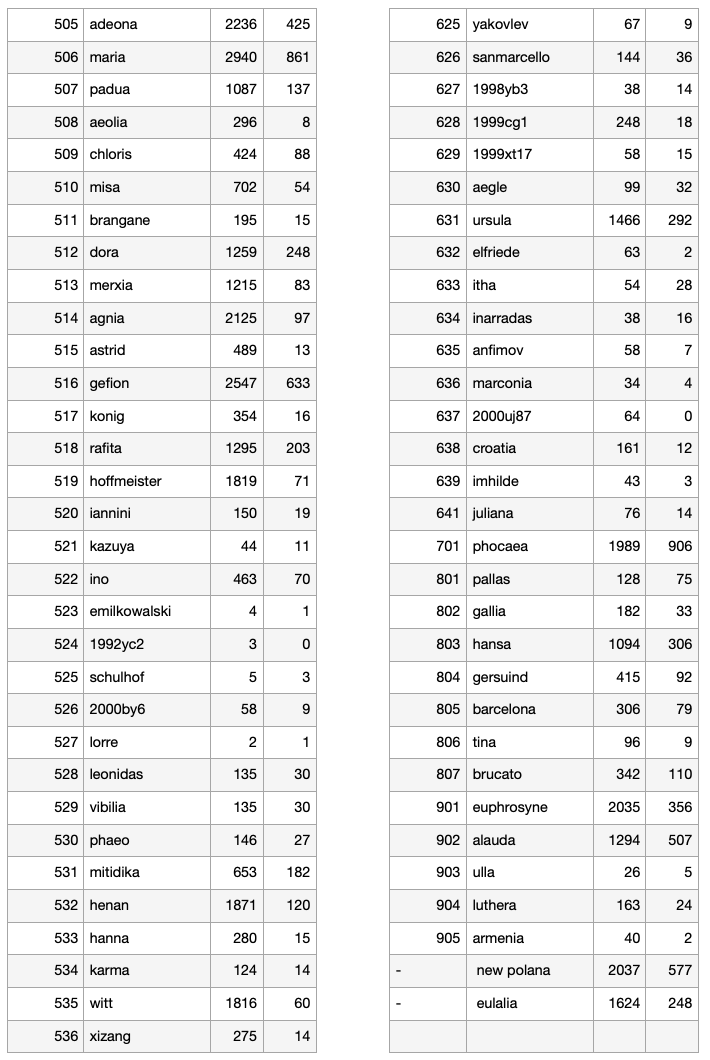
Here we present preliminary results about the Gaia view of asteroid collisional families. We identified asteroids belonging to families during the validation of Gaia asteroid spectra. Based on the family identification of Nesvorny et al. (2015), with the addition of the New Polana and the Eulalia families from Walsh et al. (2013), we found that in the Gaia DR3 there are 25,088 asteroids that belong to 116 collisional asteroid families of the 121 listed in Tab.1. This table also reports the number of family members and the number of members with a Gaia DR3 reflectance spectrum. However, the family identification of current catalogues is conservative by construction in order to keep good separation between the families. Hence, it is very likely that (i) some of the known families are more extended than what is available in current catalogues, namely, that catalogues based on dynamical criteria do not capture the whole extent of a family, and (ii) some unknown families are yet to be identified. This implies that the aforementioned number of asteroid family members with Gaia DR3 reflectance spectra is likely an estimation lower than the true number.
We will present some important features that Gaia observed in families. One of these is the correlation between some spectral parameters, such as the slope and the depth of the 1-micron absorption band of the reflectance spectrum, and the age of members of asteroid families belonging to the so called spectroscopic S-complex (DeMeo et al. 2009). These correlations can be explained in terms of a space weathering process that reddens and reduces the 1-band depth as a function of time on S-complex asteroids.
For the brightest asteroids, the extension of Gaia reflectance spectra at wavelengths shorter than 0.45 micron is very useful for distinguishing the composition of primitive, carbonaceous asteroid families, which are difficult to be discriminated with the ground based spectroscopic data currently present in the literature.
References:
- DeMeo, F. E., Binzel, R. P., Slivan, S.~M., Bus, S. J. 2009. Icarus 202, 160–180.
- Gaia collaboration, Galluccio, Delbo et al. 2022. A&A under review.
- Nesvorný, D., Brož, M., & Carruba, V. 2015. in Asteroids IV (P. Michel, et al. eds.) University of Arizona Press, Tucson.,
- Walsh, K. J., Delbo, M., et al. 2013. Icarus 225, 283–297.
How to cite: Delbo, M., Galluccio, L., De Angeli, F., Pauwels, T., Tanga, P., Miagnard, F., Cellino, A., Brown, A., Muinonen, K., and Penttila, A.: Gaia spectroscopic view of asteroid collisional families: preliminary results, Europlanet Science Congress 2022, Granada, Spain, 18–23 Sep 2022, EPSC2022-237, https://doi.org/10.5194/epsc2022-237, 2022.
1. Introduction
Linear secular resonances occur when there is a commensurability between the frequency of precession of an asteroid perihelion, g, or node, s, and that of a planet. The ν6 involves a relationship between the frequency g of an asteroid and the g6 frequency of Saturn. Since it is a pericenter resonance, it can increase most asteroids’ eccentricities to planet-crossing levels. It can, therefore, destabilize most of the bodies that interact with it, and it is a major source of NEAs through Yarkovsky effect [2]. Despite this fact, stable orbital configurations exist inside the ν6 resonance. In such configurations, the resonant angle σ = ϖ −ϖ6, with ϖ the longitude of pericenter of the asteroid and ϖ6 that of Saturn, can oscillate around either 0◦ or 180◦. In the first case, we have an “aligned libration”, since the pericenters of both Saturn and the asteroid are pointing in the same direction. For the second case, we have an “anti-aligned libration”.
[4] identified the first case of an asteroid family completely made of asteroids in anti-aligned libration states, that of 1222 Tina. [6] extended this analysis to the whole main-belt, and found the first seven asteroids in aligned states of the same resonance. Here, we extended the previous analysis using the largest database of asteroid proper yet obtained.
2. Identification of the resonant population using large databases
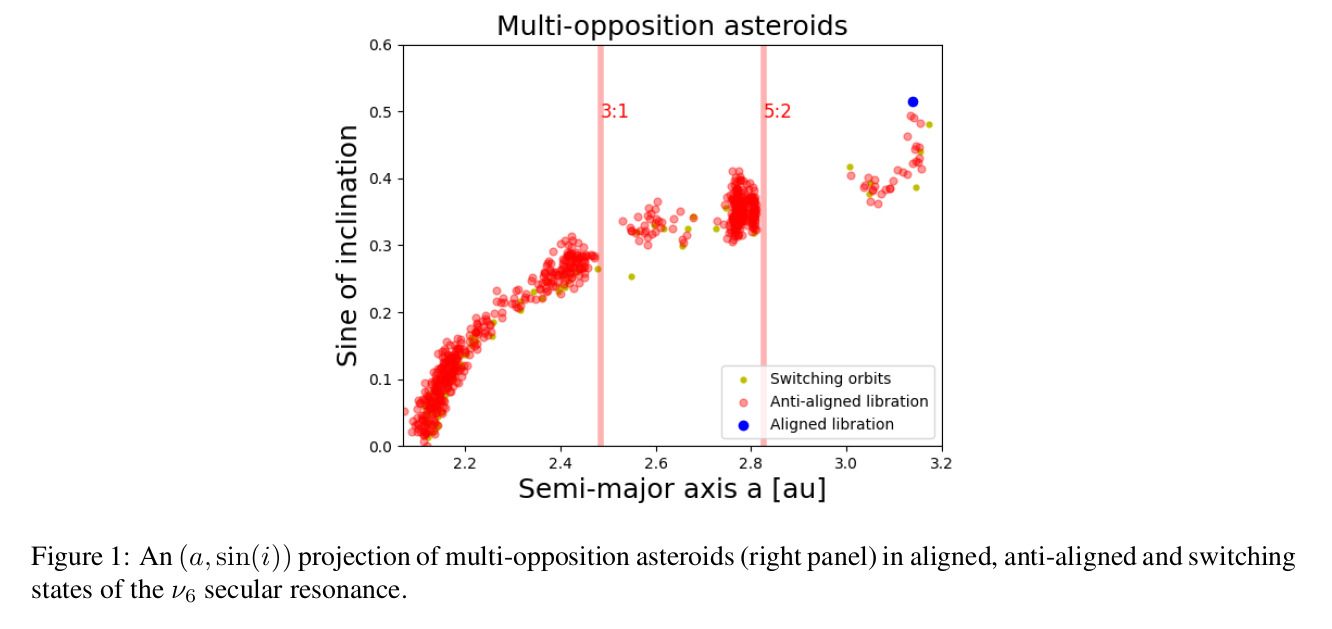
To identify the population of ν6 resonators, first, we need to select the asteroids most likely to be affected by this resonance. For this purpose, we use the criterion described in [6] and the approach outlined in [3]. We identified 15 asteroids on aligned orbital configurations, and 1713 on anti-aligned ones (see figure (1)). We then proceeded searching for asteroid groups among the newly identified anti-aligned population using the Hierarchical Clustering Method (HCM) [1]. Our results are shown in figures (2). We identify a new group around the asteroid 12988 Tiffanykapler.

3. 12988 Tiffanykapler: the first young family in the ν6 secular resonance
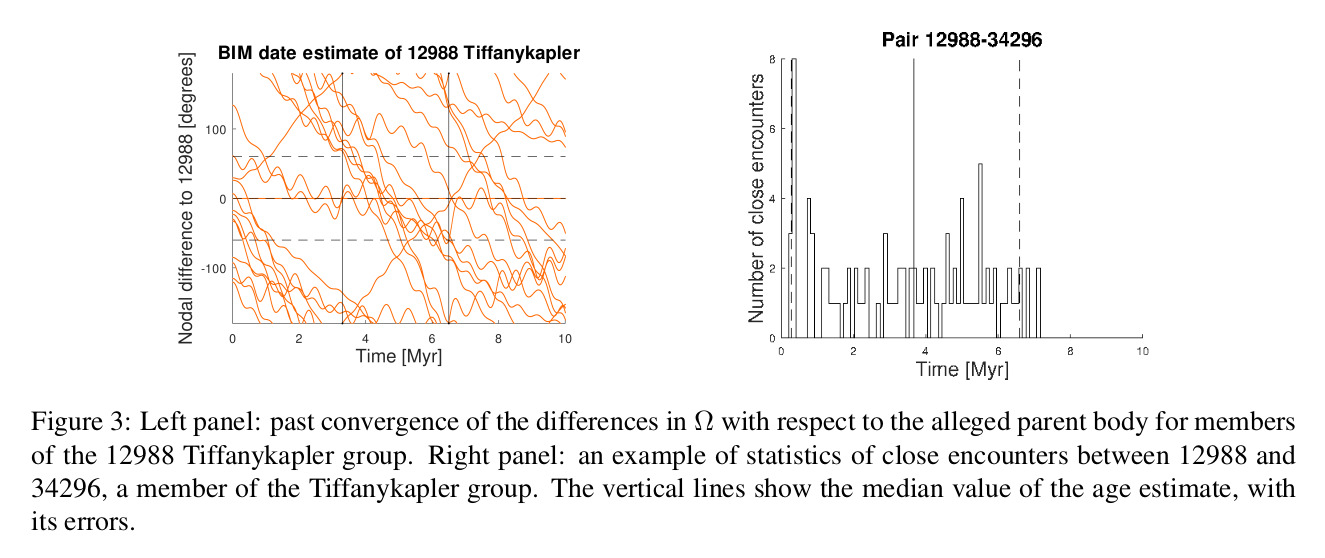
Young asteroid families can be dated using methods based on numerical integrations of family members in the past, like the Backward Integration Method (BIM, [7]) and the Close Encounters Method (CEM, [5]). In the BIM method, from time-reversal numerical simulations, past discrepancies in the longitudes of node Ω of family members with regard to those of the claimed parent body are obtained. These differences should converge to values approaching zero at the time of family formation. The CEM approach works by integrating into the past multiple clones of the parent body and of the other family members. Close encounters that occur at low relative distances and speeds between two clones are recorded, and the median value of these times is used to estimate the asteroid pair’s age. The results of both methods are shown in figure (3). The BIM method suggests a possible solution for the 12988 group in the time range from 3.3 to 6.5 Myr. The weighted average of the age determination of all asteroid pairs in the family, one example of which is shown in the right panel of figure (3), provides an age estimate for the family of 3.05 ± 1.15 Myr.
As discussed in [4], at the simplest level of perturbation theory the quantity:![]()
is preserved for asteroids in the ν6 resonance in the conservative case. The preservation of the original values of K2' permits to estimate the initial ejection velocity field with a method not generally available for non-resonant families. Our analysis yields a value of the ejection velocity parameter VEJ = 15+6-3 m/s.
4. Summary and Conclusions
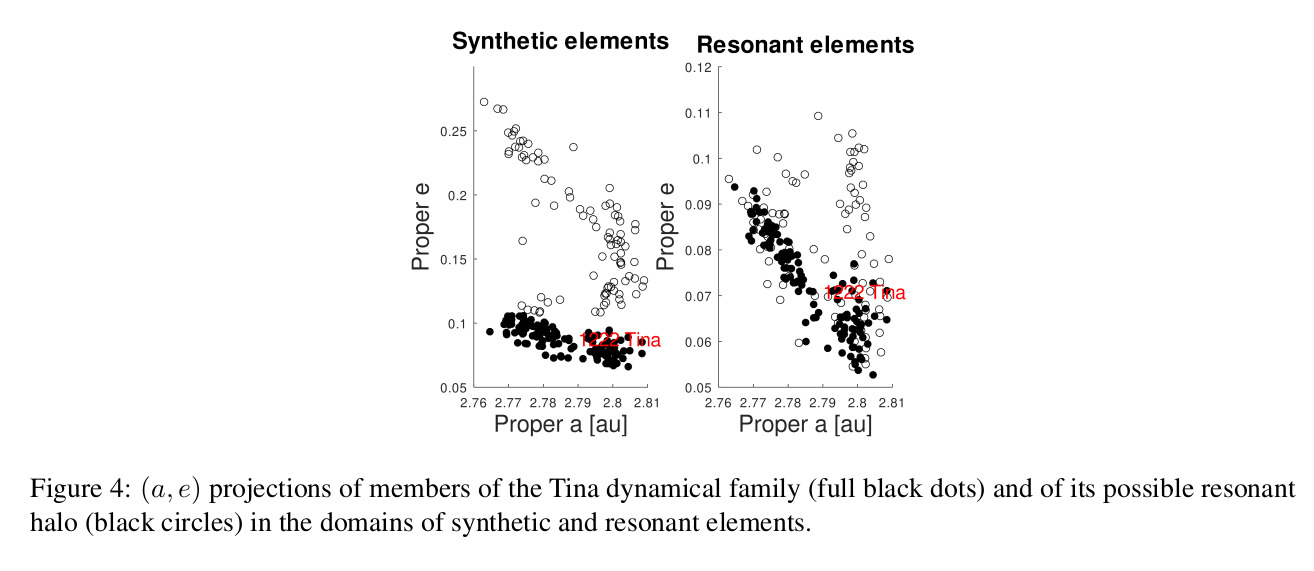
In this work, we were able to obtain a sample of 15 asteroids on aligned orbits and 1669 asteroids on anti-aligned orbits, the largest database so far for this asteroidal population. Two new asteroid groups were identified for the first time in this work: those of Tiffanykapler in the inner main-belt and 138605 QW177 in the outer belt. Tiffanykapler is the first young asteroid family in a linear resonant configuration ever to be found. Combining methods based on backward numerical simulations and constraints from resonant dynamics, we found that the family has an age of 3.05 ± 1.15 Myr and an ejection velocity field parameter of VEJ = 15+6-3 m/s. Finally, using resonant proper elements ([4]), we also identified a highly eccentric population of asteroids near the Tina family, that are likely to be part of its halo. It is the first example of a “resonant halo”.
Acknowledgements
We thank the Brazilian National Research Council (CNPq, grant 301577/2017-0), and the Foundation for Research Support of São Paulo state
(FAPESP, grant 2016/024561-0). More information on this work is available on Carruba et al. 2022, MNRAS, under review, available on ArXiv: 2203.15763.
References
[1] BENDJOYA, P., AND ZAPPALÀ, V. Asteroid Family Identification. In Asteroids III. Arizona Univ. Press, 2002, pp. 613–618.
[2] BOTTKE, W. F., JEDICKE, R., MORBIDELLI, A., PETIT, J.-M., AND GLADMAN, B. Understanding the Distribution of Near-Earth Asteroids. Science 288, 5474 (June 2000), 2190–2194.
[3] CARRUBA, V., A LJBAAE, S., DOMINGOS, R. C., AND BARLETTA, W. Artificial neural network classification of asteroids in the M1:2 mean-motion resonance with Mars. MNRAS 504, 1 (June 2021), 692–700.
[4] CARRUBA, V., AND MORBIDELLI, A. On the first ν6 anti-aligned librating asteroid family of Tina. MNRAS 412, 3 (Apr. 2011), 2040–2051.
[5] CARRUBA, V., S POTO, F., BARLETTA, W., ALJBAAE, S., FAZENDA, Á. L., AND MARTINS, B. The population of rotational fission clusters inside asteroid collisional families. Nature Astronomy 4 (Jan. 2020), 83–88.
[6] HUAMAN, M., ROIG, F., CARRUBA, V., DOMINGOS, R. C., AND ALJBAAE, S. The resonant population of asteroids in librating states of the ν6 linear secular resonance. MNRAS 481, 2 (Dec. 2018), 1707–1717.
[7] NESVORNÝ, D., BOTTKE, WILLIAM F., J., DONES, L., AND L EVISON, H. F. The recent breakup of an asteroid in the main-belt region. Nature 417, 6890 (June 2002), 720–771.
How to cite: Carruba, V., Aljbaae, S., Domingos, R. C., Huaman, M., and Martins, B.: Identifying the population of stable ν6 resonant asteroids using large databases, Europlanet Science Congress 2022, Granada, Spain, 18–23 Sep 2022, EPSC2022-238, https://doi.org/10.5194/epsc2022-238, 2022.
1. Introduction
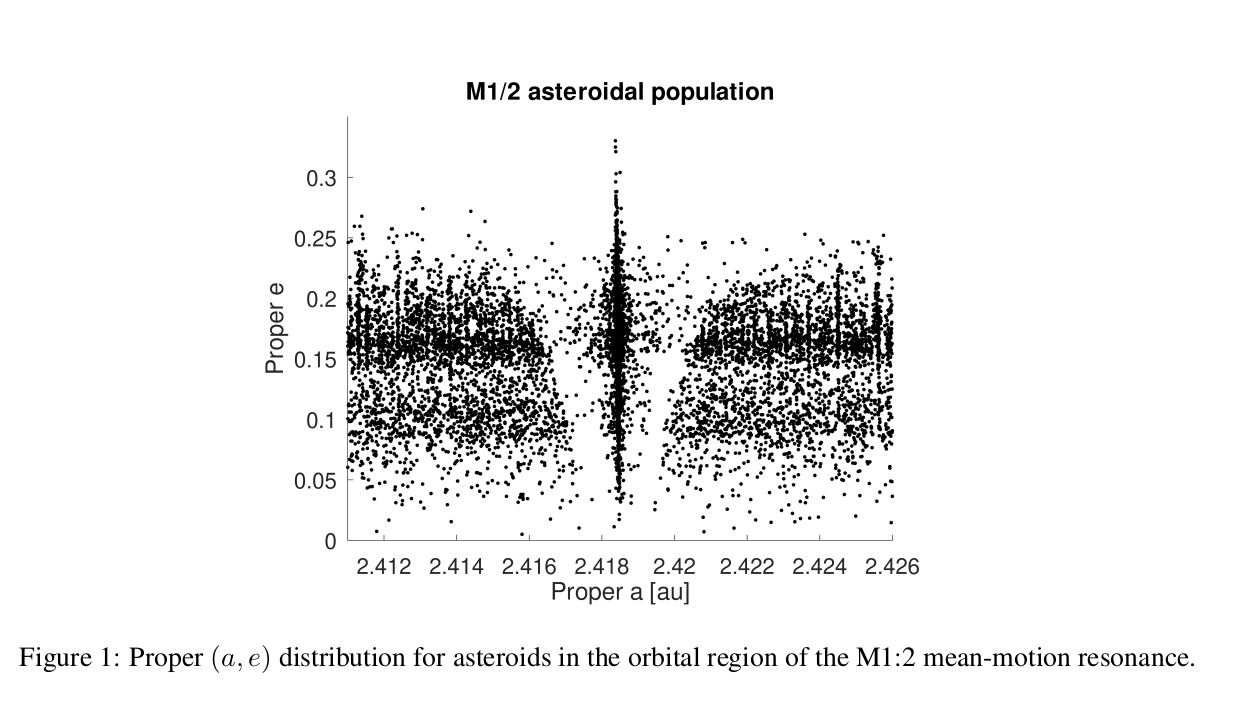
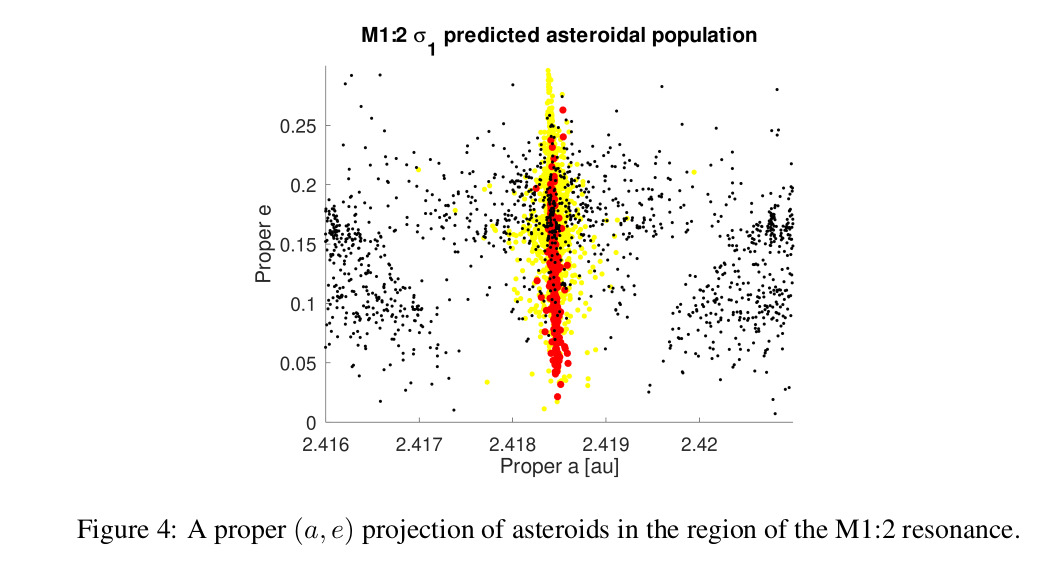
During the last five years, machine learning and deep learning have been used more commonly in the field of asteroid dynamics. Artificial neural networks have been recently used for identifying members of asteroid families [6]. This is the first attempt to use deep learning for the automatic classification of images of asteroids resonant arguments. The population of asteroids inside the M1:2 mean motion resonance with Mars was studied by [4]. The V-shaped region at the resonance center in the proper (a, e) plane (see figure (1)) is associated with the M1:2 resonance. [4] defines two main resonant arguments. σ is given by:
![]()
where λ = M + Ω + ω is the mean longitude, ϖ = Ω + ω, with Ω the longitude of the node, ω the argument of pericenter, and where the suffix M identifies the planet Mars. σ1 is defined as:
![]()
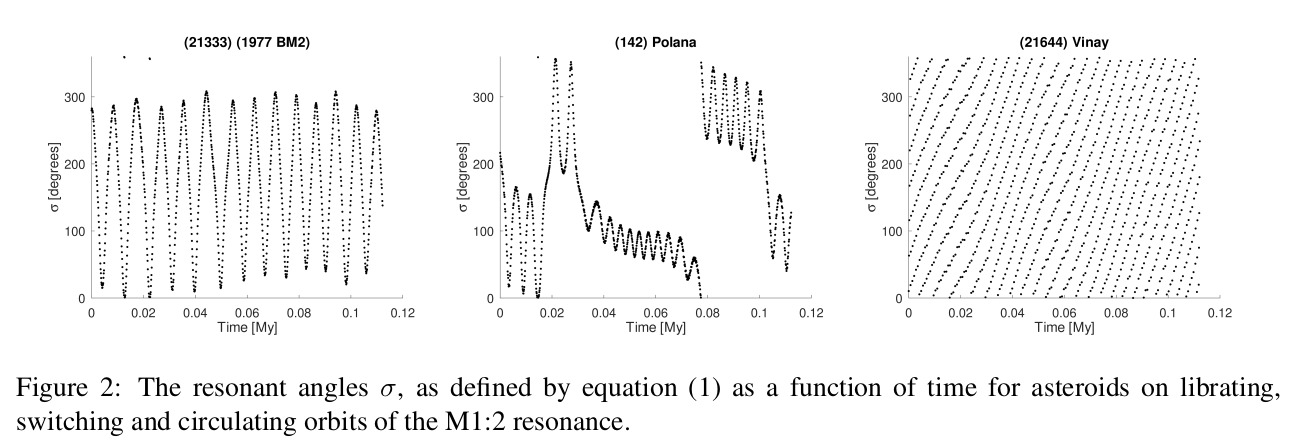
The orbital behavior of asteroids in the affected region can be identified by studying the time dependence of these two angles. Asteroids for which the critical arguments cover the whole range of values, from 0◦ to 360◦, are on circulating orbits. If the argument oscillates around an equilibrium point, we have a librating orbit. Whether the argument alternates phases of libration and circulations we have a switching orbit, as defined in this work. The main equilibrium point for the σ1 argument is near 0◦. Pure σ librators tend to be much rarer than pure σ1 ones. Since in this work we are interested in treating a multi-class problem we focus our study on the case of the σ1 resonant argument.
2. Artificial Neural Networks (ANN)
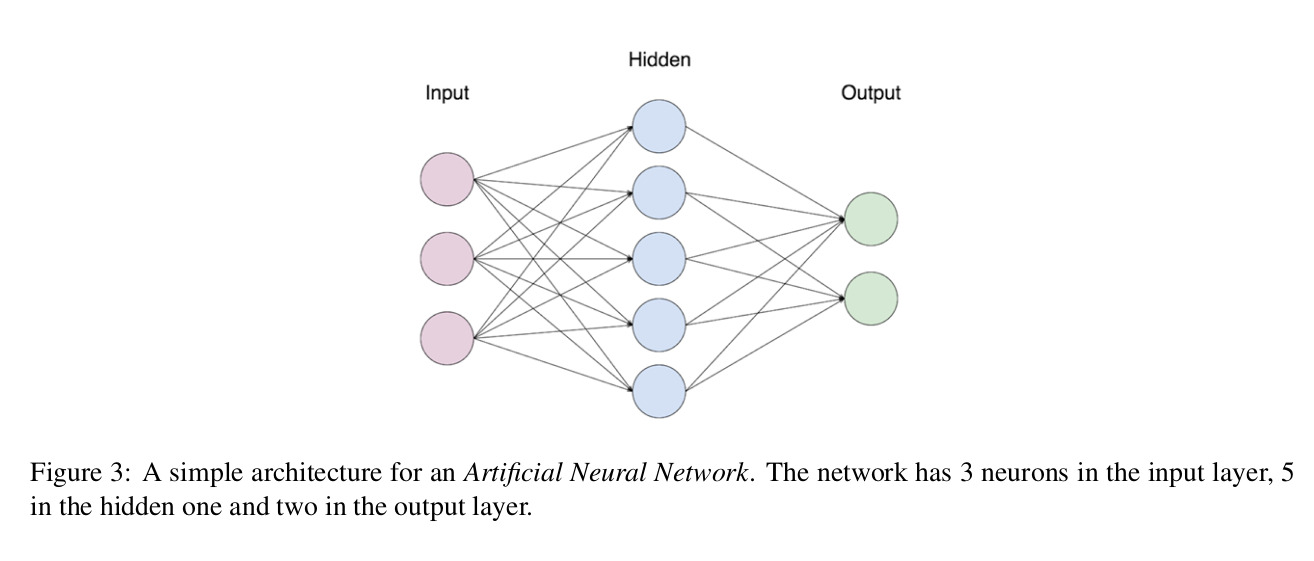
Artificial neuron networks mimic the neuron's web in a biological brain. Each artificial neuron can transmit a signal to other neurons. This signal can be processed, and the signal coming out of each neuron is computed as a non-linear function of the inputs. A basic architecture for ANN consists of an input and an output layers, with the possible presence of one or more hidden layers between them to improve the model precision. Each neuron will perform a weighted sum, WS, given by:

where n is the number of input to process, Xi are the signals from other neurons, and wi are the weights. ANN will optimize the values of the weights during the learning process. On the weighted sum WS, ANN will apply an activation function. For images classifications, one of the most used activation function is the “relu”, defined as:
![]()
which will produce as an outcome the weighted sum itself WS, if that is a positive number, or 0, if WS has a negative value. As a next step, the loss function must be applied to all the weights in the network through a back-propagation algorithm. A loss function is usually calculated by computing the differences between the predicted and real output values. Interested readers can find more information in the Keras documentation (https://keras.io/, [5]).
3 Applications of ANN to M1:2
Here, we used the Keras implementation of ANN, which is based on the Tensorflow Python software package [2]. The process used in this work is the following:
1. The asteroid orbits are integrated under the gravitational influences of the planets.
2. We compute the resonant arguments.
3. Images of the time dependence of resonant arguments are drawn.
4. The ANN trains on the training label image data.
5. Predictions on the test images are obtained, and images of the test data, with their classification, are produced.
To identify resonant argument images, we created a four-layer model with a flatten, an inner, a hidden, and an output layers. The flatten layer will transform the image matrices into arrays. The inner layer will look for simpler patterns in the arguments images, while the hidden layer will search for more complex features. The output layer, with three nodes, will perform the final classification for the three possible classes. To quantitatively classify the outcome of ANN, it is often useful to compute values of metrics. [3] defines accuracy as:

Our model performs quite well: Accuracy values were all above 0.996.
4. ML identification of resonant groups
Using ANN and ML, we obtained labels for 6440 asteroids in the M1:2 resonance region. We then used the ML Hierarchical Clustering Method (ML-HCM) of [1] to identify asteroid groups among the resonant population of M1:2 resonators. Our analysis produced seven possible groups, all associated with the Massalia, Nysa, and Vesta families. This confirms the analysis of [4].
5. Summary and Conclusions
The use of ANN allowed us to classify the orbital type of all numbered asteroids affected by the M1:2 resonance. The identification of clusters in the population of asteroids in librating and switching orbits suggested that three asteroid families, those of Massalia, Nysa, and Vesta, are the most dynamically affected by this resonance.
Acknowledgements
We would like to thank the Brazilian National Research Council (CNPq, grant 301577/2017-0). More information on this work can be obtained from Carruba et al. (2021), MNRAS, 504, 692.
References
[1] CARRUBA, V., ALJBAAE, S., AND LUCCHINI, A. Machine-learning identification of asteroid groups. MNRAS 488, 1 (Sept. 2019), 1377–1386.
[2] CHOLLET, F., AND OTHERS. Keras: The Python Deep Learning library, (June 2018).
[3] FAWCETT, T. An introduction to ROC analysis. Pattern Recognition Letters 27, 8 (Jun. 2006), 861 –874.
[4] GALLARDO, T., VENTURINI, J., ROIG, F., AND GIL-HUTTON, R. Origin and sustainability of the population of asteroids captured in the exterior resonance 1:2 with Mars. Icarus 214, 2 (Aug. 2011), 632–644.
[5] LECUN, Y., BENGIO, Y., AND HINTON, G. Deep learning. Nature 521, 7553 (May 2015), 436–444.
[6] VUJIČIĆ, D., PAVLOVIĆ, D., D., M., Ð ORÐEVIĆ, S., S., R., AND D., S. Classification of asteroid families with artificial neural networks. Serb. Astron. J. 200 (Dec. 2020), 1–8.
How to cite: Carruba, V., Aljbaae, S., Domingos, R. C., and Barletta, W.: Artificial Neural Network classification of asteroids in the M1:2 mean-motion resonance with Mars., Europlanet Science Congress 2022, Granada, Spain, 18–23 Sep 2022, EPSC2022-245, https://doi.org/10.5194/epsc2022-245, 2022.
Introduction
The main belt asteroid 4429 Debussy belongs to a unique group among binary asteroids in the Solar System which are known as synchronous binary, the systems with two bodies having comparable sizes and with the same rotational and orbital period. Photometric observations of these objects are still the main source of their physical properties. Lightcurves for synchronous binary systems are not quasi-sinusoidal as for most asteroids, but have very characteristic U-V shape due to the rotation of nonspherical bodies and caused by mutual eclipses. The collection of data from apparitions over several years (evenly distributed along the ecliptic longitudes), allows to determine key parameters of such binary systems (such as a non-convex shape solution and the object's spin-axis orientation) (Bartczak et al., 2014, Bartczak et al., 2017, Kryszczyńska et al., 2008).
The ultimate goal of this kind of sophisticated spin-shape modeling is to determine the asteroid's density. It is indicative of the internal structure of the body and also puts constraints on its composition. However, the estimation of density is based on mass and volume. The determination of the volume of an asteroid requires a detailed shape solution, and information about the absolute size. Our main goal of modelling Debussy is calculating a new non-convex model with its uncertainties, which are crucial in further analysis (like radiometric studies) and for the estimation of other parameters (like thermal surface properties or bulk density).
4492 Debussy
The binary nature of Debussy was discovered in 2002 (Behrend et al., 2004), when photometric observations showed a lightcurve with typical features for eclipsing binaries - the amplitude of light changes (of about 0.5 mag) corresponding to the rotation of two nonspherical bodies, and two minima (about 0.6 mag deep) due to their mutual eclipses. Further observations showed that the rotation period is P = 26.5811 ± 0.0002 h (Polińska et al., 2008). Since 2002 Debussy has been observed at almost all ecliptic longitudes evenly distributed along the orbit. All gathered data present lightcurves with deep minima caused by mutual eclipses. This means that the edge of the orbit of the binary system always points towards the observer.
Modelling
The spin-shape model of the Debussy system is calculated in the same way as for 90 Antiope (Bartczak et al., 2014) and 809 Lundia (Bartczak et al., 2017, Kryszczyńska et al., 2008), using the genetic-algorithm-based modelling method SAGE (Shaping Asteroids with Genetic Evolution). The SAGE method is based on photometric observations from several apparitions. The modelling process works best for observations obtained with different and evenly distributed ecliptic longitudes. It allows to create non-convex shape, spin axis orientation and rotational period of synchronous binary asteroids. With the new model we would like to demonstrate the recently developed shape uncertainty method for binary objects in the same way as it was done for single asteroids and described in Bartczak & Dudziński (2019).
4492 Debussy was detected in the AKARI infrared survey and also during the cryogenic phase of WISE (calibrated fluxes were taken from the Database for thermal IR observations of small bodies, see Szakats et al. 2020). In addition, there is a dedicated Spitzer-IRS spectrum available (Marchis et al. 2012). We used the available thermal measurements to determine the size (size of an equal-volume sphere), the geometric albedo and the thermal inertia of Debussy via a well-tested thermophysical model (see e.g., Müller et al. 2017). For the radiometric study, we considered Debussy's derived spin properties, as well as different simple, convex, and non-convex shape solutions.
References
Behrend et al., 2004, IAU Circ., No. 8354
Bartczak et al., 2014, MNRAS, 443, 1802
Bartczak et al., 2017, MNRAS, 471, 1, 941-947
Bartczak P. & Dudziński G., 2019, MNRAS, 485, 2, 2431-2446
Kryszczyńska et al., 2008, A&A 501, 769-776
Marchis et al. 2012, Icarus 221, 1130
Müller et al. 2017, A&A 599, A103
Polińska et al., 2008, ACM paper id. 8134
Szakats et al. 2020, A&A 635, A54
How to cite: Polińska, M., Bartczak, P., and Müller, T. and the SAGE Team: New modeling of 4492 Debussy eclipsing binary asteroid, Europlanet Science Congress 2022, Granada, Spain, 18–23 Sep 2022, EPSC2022-286, https://doi.org/10.5194/epsc2022-286, 2022.
Our understanding of Solar System family asteroids has been significantly widened by space surveys primarily targeted to exoplanet detections. In K2 and TESS fields, many asteroids passed through, being a basis of continuous sateroid photometry covering several basis. This enabled the proof
of the high fraction of slow rotators (period>30 hours) in asteroid families (30%), non-family MB asteroids (35%), the Hilda group (39%) and the Trojan swarms (25%). High ratio of extremely slow rotators (P > 100 hr) in the Hilda group is (18%) is unique in the Solar System.
We found a family-specific amplitude and/or period distribution only in some asteroid families (Hungaria, Maria, Juno, Eos, Eucharis, and Alauda). Older families tend to contain a larger fraction of more spheroidal, low-amplitude asteroids. The rotation period distributions are different in the cores and outskirts of the Flora and Maria families, while the Vesta, Eos, and Eunomia families lack this feature. We also confirm that very fast spinning
asteroids are close to spherical (or spinning top shapes), and minor planets rotating slower than ≈11 h are also more spherical than asteroids in the 4-8 h period range and this group is expected to contain the most elongated bodies.
Despite a previously suggested mixed origin of Hildas from the MB and the Trojan swarms, we revealed no differences in the photometric properties between the taxonomically different R and LR Hildas: the entire Hilda group highly resembles the Trojans for rotational properties.
How to cite: Szabó, G.: Rotational properties of MB family asteroids, Hildas, and Trojans, based on K2 and TESS observations, Europlanet Science Congress 2022, Granada, Spain, 18–23 Sep 2022, EPSC2022-293, https://doi.org/10.5194/epsc2022-293, 2022.
The classification of the minor planets of the Solar System has been revisited regularly since its first outline in the 1970s as dichotomy of carbonaceous and silicaceous asteroids. The reformulations followed insights granted by new data (e.g. surveys such as ECAS, SMASS) or extensions of the observable feature space (e.g. CCD spectroscopy).
Since the last major update of the taxonomy by DeMeo et al. in 2009, we have seen a wealth of new data provided by targeted campaigns, which show that the spectroscopically-defined class boundaries do not align sufficiently with mineralogical and meteoritic population trends. Examples are the continuous trend between B- and C-type objects (Clark et al. 2010, De Leon et al. 2012) and the large subclassing of the continuous S-type asteroids (Vernazza et al. 2014). Furthermore, any compositional interpretation of members of the X-complex is tentative as shown by the diversity of radar albedos, densities, and spectral properties observed among them (Shepard et al. 2010, 2015, Carry 2012, Neeley et al. 2014).
Given the increase of data and insights into the compositional asteroid Main Belt, we derive a new iteration of the asteroid taxonomy, focusing primarily on a methodological improvement. Acknowledging that future survey efforts will contribute asteroid spectra in different wavelength ranges (e.g. Gaia (visible), SPHEREx (NIR), MITHNEOS (visible-NIR)), we evolve the current method into a probabilistic model approach which enables us to classify complete and partially observed spectra in the same scheme. We further re-introduce the visual albedo into the classification space to disentangle the degenerate X-complex.
By means of a clustering analysis of almost 3,000 minor body spectra and albedos, we devise a taxonomic scheme consisting of 17 classes with close resemblance to the Bus-DeMeo and Tholen systems (refer to Fig. 1): A, B, C, Ch, D, E, K, L, M, O, P, Q, R, S, X, V, Z. The two main complexes remain C and S. We resolve the X-complex and replace it by the new M-complex. Subclasses in the Bus-DeMeo system are replaced by a mineralogical interpretation of the continuous distribution of minor bodies in the classification space. The new class Z entails extremely-red objects in the inner Main Belt including the supposed TNO-implants (203) Pompeja and (269) Justitia (Hasegawa et al. 2021).
A python-tool to classify minor body observations in the derived taxonomic scheme is freely accessible to the community (https://classy.readthedocs.io).

Figure 1: Evolution of the asteroid taxonomy from the Tholen- (Tholen 1984) over the Bus-DeMeo- (Bus and Binzel 2002, DeMeo et al. 2009) to the system established in this work.
References
Clark, B. E., Ziffer, J., et al. (2010), Spectroscopy of B-type asteroids: Subgroups and meteorite analogs.
Carry, B. (2012), Density of asteroids.
Bus, S. J. and Binzel, R. P. (2002), Phase II of the Small Main-Belt Asteroid Spectroscopic Survey. A Feature-Based Taxonomy.
DeMeo, F. E., Binzel, R. P., et al. (2009), An extension of the Bus asteroid taxonomy into the near-infrared.
de León, J., Pinilla-Alonso, N., et al. (2012), Near-infrared spectroscopic survey of B-type asteroids: Compositional analysis.
Hasegawa, S., Marsset, M., et al. (2021), Discovery of Two TNO-like Bodies in the Asteroid Belt.
Neeley, JR., Clark, BE., et al. (2014), The composition of M-type asteroids II: Synthesis of spectroscopic and radar observations.
Shepard, M. K., Clark, B. E., et al. (2010), A radar survey of M- and X-class asteroids II. Summary and synthesis.
Shepard, M. K., Taylor, P. A., et al. (2015), A radar survey of M- and X-class asteroids. III. Insights into their composition, hydration state, & structure.
Vernazza, P., Zanda, B., et al. (2014), Multiple and Fast: The Accretion of Ordinary Chondrite Parent Bodies.
How to cite: Mahlke, M., Carry, B., and Mattei, P.-A.: A New Iteration of the Asteroid Taxonomy, Europlanet Science Congress 2022, Granada, Spain, 18–23 Sep 2022, EPSC2022-385, https://doi.org/10.5194/epsc2022-385, 2022.
Asteroids, along with other small bodies, are what is left over of the original planetesimal disk from the planet-formation era. Therefore, these objects are considered the best tracers for the processes that occurred during the earliest history of our Solar System. However, the majority of asteroids are fragments generated by the collisional breakup of the planetesimals, the first ~100-km sized bodies (Morbidelli et al., 2008, Delbo' et al., 2019) that accreted in the protoplanetary disk of our Sun.
Nevertheless, a small fraction of the planetesimal population survived the collisional evolution. In order to study these objects, the first step is to identify these surviving planetesimals among all the other (fragment) asteroids. To do so, we “cleaned” the inner part of the asteroid main belt (2,1 < a < 2,5) from all asteroid collisional family members (using the method of Bolin et al., 2017, Delbo' et al., 2017, 2019), thus revealing those asteroids that are not fragments that formed in the main belt. Thanks to this method, we revealed 64 surviving planetesimals in the inner main belt.
We carried out a spectroscopic survey of these identified IMB planetesimals, in order to constrain their composition and mineralogy. In particular, we performed visible and near-infrared spectroscopy using several telescopes such as the 1.82m Copernico Telescopio (Asiago, Italy) for the visible spectroscopy and the 4.2 Lowell Discovery Telescope (Flagstaff, USA); the 3.2 NASA Infrared Telescope Facility (Hawaii, USA) and the Telescopio Nazionale Galileo (La Palma, Spain) for the near-infrared part. To complete our survey, we also used spectra in the visible and near-infrared published in the literature, as well as size and albedo information that we obtained from the Minor Planet Physical Properties Catalog (https://mp3c.oca.eu/).
We performed the taxonomic classification following the Bus-DeMeo taxonomy (Bus et al., 2002; DeMeo et al., 2009), and using the M4AST tool (http://m4ast.imcce.fr) (Popescu et al., 2012). A visual inspection to identify the presence of absorption bands characteristic of some classes was performed to check the robustness of the automatic taxonomic classification. In addition, we compute for each planetesimal several spectral parameters, such as spectral slopes, and center, depth and area of absorption bands, when these are present. We also performed calculation of their mass, based on the method of (Carry, 2012). Finally, we used the RELAB database (Pieters, 1983), to look for meteorite analogues of each planetesimal.
We found that planetesimals of the Inner Main Belt (IMB) belong mainly to the S-complex (~45%), followed by C-complex (~25%) and X-complex (~17%). Further investigations on S-complex planetesimals showed that, for a majority of them, they are best matched by spectra of ordinary chondrites meteorites. We did not find any correlation with diameters, semimajor axis and the ratio of olivine/pyroxene. Almost 60% of the C-complex planetesimals belong to the Ch/Cgh types, showing spectroscopic features associated with hydrated minerals, and consequently indicating the presence of liquid water in the early formation phases of these objects. We also found that almost 5% of the IMB planetesimals belong to the D/T types with a diameter greater than 25 km. As this taxonomical class, as well as Ch/Cgh types, are likely to have formed in the outer part of the Solar System (at 3-7 au), their presence in the IMB (2,1-2,5 au) can be explained by dynamical models invoking large semimajor axis migration of these objects (e.g., Grand Tack of Walsh et al., 2011; low-mass asteroid belt of Raymond and Izidoro, 2017b for the C-complex and Vokrouhlický et al., 2016 for the D/T types).
Here, we will present the spectroscopic, physical and compositional results of our IMB planetesimals survey as well as the implications for planetary formation models.
Acknowledgements: We acknowledge support from the ANR ORIGINS (ANR-18-CE31-13-0014).
References : Morbidelli A. et al, Physica Scripta, Volume 130, Issue, id 014028 (2008) ; Delbo M. et al., A&A, Volume 624, id. A69 (2019) ; Bolin B. T. et al., Icarus, Volume 282, 2017, Pages 290-312 ; Delbo M. et al., Science, Volume 357, Issue 6355, pages 1026-1029, (2017) ; Bus S. J. et al., Icarus, Volume 158, Issue 1, Pages 146-177 (2002) ; DeMeo F. E. et al., Icarus, Volume 202, Issue 1, Pages 160-180 (2009); Carry, B. Planetary and Space Science, Volume 73, Issue 1, p. 98-118. (2012) ; Popescu M. et al., A&A, Volume 544, id. A130 (2012) ; Pieters, C. M., J. Geophys. Res., Volume 88, pages 9534– 9544 (1983) ; Walsh K. J. et al., Nature, Volume 475, Issue 7355, Pages 206-209 (2011) ; Raymond S. N. et al., Science Advances, Volume 3, Issue 9, Pages e1701138 (2017) ; Vokrouhlický D. et al., The Astronomical Journal, Volume 152, Issue 2, id. 39 (2016).
How to cite: Bourdelle de Micas, J., Fornasier, S., Delbo, M., Avdellidou, C., Van Belle, G., and Ochner, P.: Composition of Inner Main Belt Planetesimals, Europlanet Science Congress 2022, Granada, Spain, 18–23 Sep 2022, EPSC2022-440, https://doi.org/10.5194/epsc2022-440, 2022.
We report an analysis of photometric observations for two potentially hazardous asteroids – (52768) 1998 OR2 and (99942) Apophis. Data for 1998 OR2 was obtained in March – April 2020 and for Apophis in February – March 2021, when both objects experienced their close approaches to Earth. The aim of the observations was mainly to refine the physical characteristics (rotation periods, absolute magnitudes H, slope parameter G, to find out the approximate taxonomy, or even to estimate the heliocentric position of the north pole).
Observations and data reduction
The observations of both PHAs were carried out with the 0.61-m f/4.3 Newton reflector at the Skalnaté Pleso Observatory (Slovakia, IAU code 056) and CCD camera SBIG ST-10XME. We obtained photometric data using broad-band Johnson-Cousins B, V, and R filters, 2×2 binning, and a resolution of 1.07 arcsec/px. The calibration with dark and flatfield frames was applied in the standard way. Next, we used a differential aperture photometry technique to obtain lightcurves.
Results
Asteroid 1998 OR2 was observed for 9 nights. From each night we obtained 3 – 4 hr series in BVR filters, from which we determined the exact synodic rotation periods. Figure 1 shows the composite light curves with periods of 4.11 hours. We divided them into three groups to emphasize the time- and phase-angle-dependent changes in the lightcurve shape.
Data from the V filter we used to determine the absolute magnitude H, which has a value of 15.72 ± 0.02 mag (Fig. 2). We kept the slope parameter G at 0.15 because of the narrow range of phase angles. Next, we calculated the approximate effective diameters of the asteroid using an albedo value of 0.2. These varied only minimally between 2.1 and 2.3 km on each observing night, with a mean value of 2.14 ± 0.06 km.
Color photometry also allowed us to determine an approximate taxonomic class in the Tholen classification. Figure 3 shows the positions of the color indices on each night along with the mean value of the B-V and V-R indices. With high probability, the asteroid surface is dominated by a metallic material, which characterizes the X-class. Our finding is confirmed by Hromakina et al. (2021) [2].
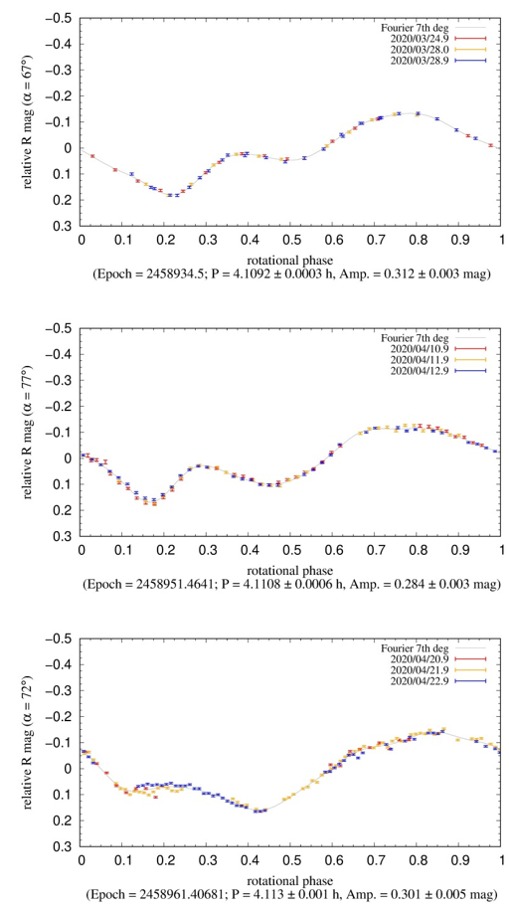
Fig. 1 Three composite lightcurves of asteroid 1998 OR2 obtained from March 24 to April 22 through the R filter. We divided them into three groups to show the changing of some features in brightness in the range of rotational phase from 0 to 0.2. All lightcurves have the same scale of relative magnitudes (y-axis) for better comparison. The typical rms of all composite lightcurves is less than 0.010 mag.

Fig. 2 Plot of magnitude-phase relation of 1998 OR2. In this case, the slope parameter G is fixed at 0.15.

Fig. 3 Color plots of V-R vs. B-V for 1998 OR2 within various Tholen taxonomic classes [1].
In the spring of 2021, perhaps the most famous asteroid, Apophis, approached the Earth. We used this time to obtain photometric material to refine the physical characteristics known so far. The aim was not to make long-term observations to determine the rotational period, as this is known, a fact complicated by the excited rotational state (tumbling). We mainly focused on finding the B-V and V-R color indices, the absolute magnitude H, and the diameter. Already after the first observations, it was clear that either the shape of the object is highly elongated or the rotation is not performed along one axis. The values of the effective diameter varied significantly from 0.31 to 0.40 km each night. We observed a similar effect when determining the absolute magnitude, which we calculated to be 19.08 ± 0.06 mag (with fixed G = 0.24).
Similarly to the previous asteroid, we used color photometry. It shows almost unequivocally that Apophis is classified as an S-type asteroid (Fig. 4). A similar finding was obtained by Hromakina et al. (2021) [2] or Lin et al. (2018) [3].

Fig. 4 Color plots of V-R vs. B-V for Apophis within various Tholen taxonomic classes [1].
References
[1] Dandy, C. L., Fitzsimmons, A., and Collander-Brown, S. J., “Optical colors of 56 near-Earth objects: trends with size and orbit”, Icarus, vol. 163, no. 2, pp. 363–373, 2003. doi:10.1016/S0019-1035(03)00087-3.
[2] Hromakina, T., “Photometric survey of 55 near-earth asteroids”, Astronomy and Astrophysics, vol. 656, 2021. doi:10.1051/0004-6361/202141600.
[3] Lin, C.-H., Ip, W.-H., Lin, Z.-Y., Cheng, Y.-C., Lin, H.-W., and Chang, C.-K., “Photometric survey and taxonomic identifications of 92 near-Earth asteroids”, Planetary and Space Science, vol. 152, pp. 116–135, 2018. doi:10.1016/j.pss.2017.12.019.
How to cite: Husárik, M. and Ivanova, O.: Photometric results of two PHAs: (52768) 1998 OR2 and (99942) Apophis, Europlanet Science Congress 2022, Granada, Spain, 18–23 Sep 2022, EPSC2022-671, https://doi.org/10.5194/epsc2022-671, 2022.
Abstract
The tangential YORP effect (or TYORP) is a radiation pressure torque, which acts on small irregularities of the asteroid surface due to their non-uniform heating. This effect causes asteroids to change their rotation rates, and in many cases, it can be larger than other non-gravitational torques. Other works have already considered TYORP produced by smooth boulders of different shapes on an asteroid's surface. Here, we present the new results on the contribution to TYORP due to the small-scale roughness on the surface of boulders or regolith. We carry out numeric simulations of the 2D heat conduction problem on a sinusoidal surface, average the radiation pressure force in time and space, and thus numerically find the TYORP experienced by the asteroid surface. We also create an approximate analytic theory of heat conduction on a slightly non-flat sinusoidal surface and use it to compute TYORP. We study the small-scale roughness of asteroid Ryugu published in other works and use it to evaluate its TYORP. As a result, we find that the numeric and analytic estimates of the tangential YORP produced by a rough surface are in good qualitative agreement with each other. The contribution of different sinusoidal harmonics to the tangential YORP is additive to good accuracy. It allows us to derive an approximate analytic formula, which expresses TYORP in terms of the Fourier spectrum of the shape of the asteroid surface. The TYORP contribution of the small-scale roughness can be comparable to or even greater than TYORP produced by boulders.
Introduction
The tangential Yarkovsky–O'Keefe–Radzievskii–Paddack effect (also tangential YORP, or TYORP) is caused by the recoil light pressure and drags the asteroid’s surface in the tangential direction [1]. It has previously been simulated for different geometries of smooth boulders [2, 3, 4]. Here, we study the contribution to TYORP arising from the roughness of the asteroid surface on a centimeter-scale, including both non-smoothness of the rocks and the non-flatness of the regolith. We present the recent analytic results from [5] and as yet unpublished results of the numeric simulation of the effect.
Analytic model
We use the perturbation theory to solve the heat conduction equation for a surface whose shape is described by a sinusoidal wave of small amplitude. The resulting temperature is used to compute the light pressure recoil force acting on the surface and thus to evaluate TYORP.
The expression for TYORP is second-order in terms of the surface slopes, thus it gets vanishingly small if the surface is nearly flat. TYORP of surface roughness has other features previously observed for TYORP of boulders: it vanishes at very small and very big thermal parameters, it vanishes for very short and very long wavelengths of the sinusoidal perturbation of the surface, it is maximal if the thermal parameter is of the order of unity and the wavelength of the sinusoidal perturbation is of the order of the thermal wavelength.
As a qualitative result of this approximate analytic theory, we also obtain that sinusoidal waves with non-commensurable wavelengths do not interfere with each other, and their TYORP is additive.
Numeric model
We create a computer program that numerically solves the 2D heat conduction equation under the curved surface, and uses the resulting temperature field to compute TYORP. The results of the program qualitatively agree with the analytic model, but differ in exact numeric values due to simplifying assumptions incorporated into the analytic model. We fit the numeric results with an analytic expression and thus get an equation for TYORP as simple as our analytic theory, but more precise than it.
Numeric simulations of TYORP for a surface composed of two sinusoidal harmonics show that different harmonics are almost independent, with the TYORP of a surface being almost equal to the TYORP of individual harmonics.
Results
To apply the theory, we take the high-resolution shape model of asteroid (162173) Ryugu from [6] and decompose its shape into the Fourier harmonics. The additivity of TYORP for different Fourier harmonics tested both analytically and numerically allows us to derive a simple mathematical expression for TYORP as an integral over the Fourier power spectrum of the asteroid surface roughness. Application of this expression to Ryugu results in a TYORP value that is greater than the YORP effect due to the large-scale asymmetry of Ryugu computed from its global shape model [7].
Overall, TYORP produced by the asteroid surface roughness has the same order of magnitude as TYORP produced by boulders. This new component of the YORP effect needs to be computed to correctly predict the dynamics of asteroids, and here we show how this computation can be done.
Acknowledgments
This work was supported by the National Research Foundation of Ukraine, project N2020.02/0371 “Metallic asteroids: search for parent bodies of iron meteorites, sources of extraterrestrial resources”.
References
[1] Golubov O., Krugly Y. N., 2012, ApJL 752, L11
[2] Golubov O., Scheeres D. J., Krugly Y. N., 2014, AJ 794, 22
[3] Sevecek P., Broz M., Capek D., Durech J., 2015, MNRAS 450, 2104
[4] Sevecek P., Golubov O., Scheeres D. J., Krugly Y. N., 2016, A&A 592, A115
[5] Golubov O., Lipatova V., A&A, accepted
[6] Otto K. A., Matz K. D., Schröder S. E., et al., 2021, MNRAS 500, 3178
[7] Kanamaru M., Sasaki S., Morota T., et al., 2021, Journal of Geophysical Research: Planets 126, e2021JE006863.
How to cite: Golubov, O. and Lipatova, V.: A new component of the tangential YORP caused by the roughness of the asteroid surface, Europlanet Science Congress 2022, Granada, Spain, 18–23 Sep 2022, EPSC2022-734, https://doi.org/10.5194/epsc2022-734, 2022.
Introduction
The observation of NEOs allows us to study the physical characteristics of the smallest size bodies of our Solar System as well as to impose constraints on their origin and evolution. Considering that these objects are in unstable orbits over the age of the Solar System, this implies that it is a transient population, which can be asteroids or comets, forming a particularly interesting population to study [1,2]. Important physical properties of atmosphereless bodies can be derived from their phase curves which represent how the object’s brightness varies with the solar phase angle. These properties are based on the understanding that the physical properties of the material present on the object’s surface can be retrieved from the analysis of the scattering of the incident solar radiation. Therefore, we set up an observational campaign in order to determine the phase curve for a large number of NEOs, deriving their absolute magnitude, H, and the G1 and G2 parameters. Together, these two parameters can provide information about composition, texture, and roughness properties [3].
Observations and results
In order to obtain the physical parameters of NEOs, we set up an observational campaign since 2017 to derive phase curves of these objects. Considering all objects observed in our campaign, taken from works [4,5,6] and Arcoverde et al., (submitted), we analyzed a homogeneous dataset of 32 NEOs. The data were mainly acquired at the Astronomical Observatory of Sertão de Itaparica (Brazil), with some NEOs also observed at the Osservatorio di Campo Imperatore (Italy). Then, using data from the dual-band photometry phase curves of NEOs and MB, acquired by the Asteroid Terrestrial-impact Last Alert System Survey [7,8] telescopes, we analyzed the behavior in G1 vs G2 of 21,865 MB and 105 NEOs. The objects were separated into three bands of albedo - low, medium and high - and three bands of diameter - less than 10 km, greater than 10 km, but less than 50 km and greater than 50 km.
Analyzing the large sample of MB, we found evidence that the distribution in phase space G1 - G2 has a strong dependence not only on the albedo but also on the size of the object, as shown in figure 1. Objects with D > 10km correspond to the behavior expected [9], and occupy specific regions in the phase space according to the albedo.
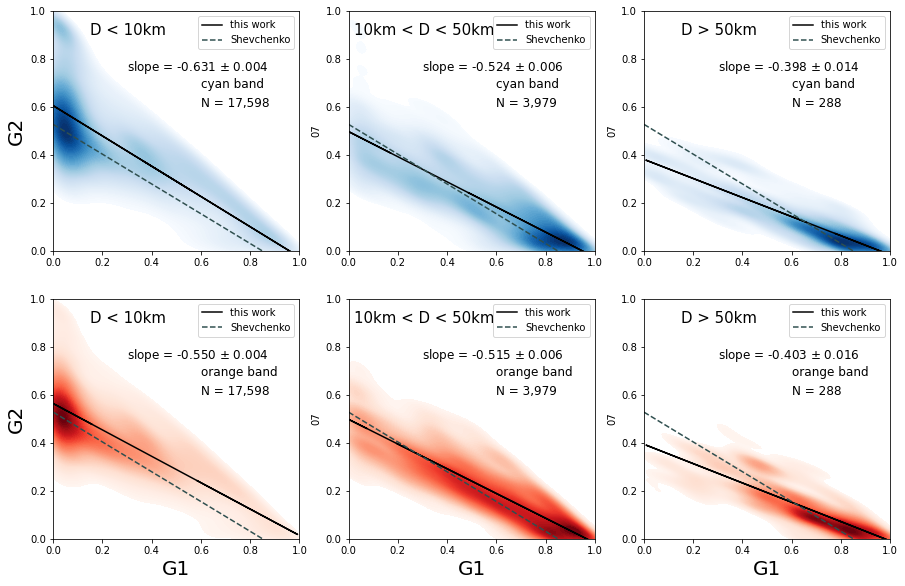
Figure 1: G1, G2-distributions for three diameter ranges of MB objects, from the ATLAS dual-band photometry asteroid phase curve catalog, observed in cyan (blue adjustment) and orange (red adjustment). The black line corresponds to the linear fit of the sample with the slop value shown, and the dashed line corresponds to the linear fit with the 93 MB of work [9], for comparison.
This size dependence on the G1 - G2 phase space is particularly true for smaller objects. As our NEOs are an even smaller population than the MB's, we cannot estimate the albedo of small objects from their phase curve parameters, as shown in Figure 2, from the distribution of our 105 NEOs in the G1 - G2 phase space. Obviously, a larger dataset of very small MB objects is needed to confirm whether the behavior mentioned above is specific to NEOs or to all very small bodies in the Solar System.
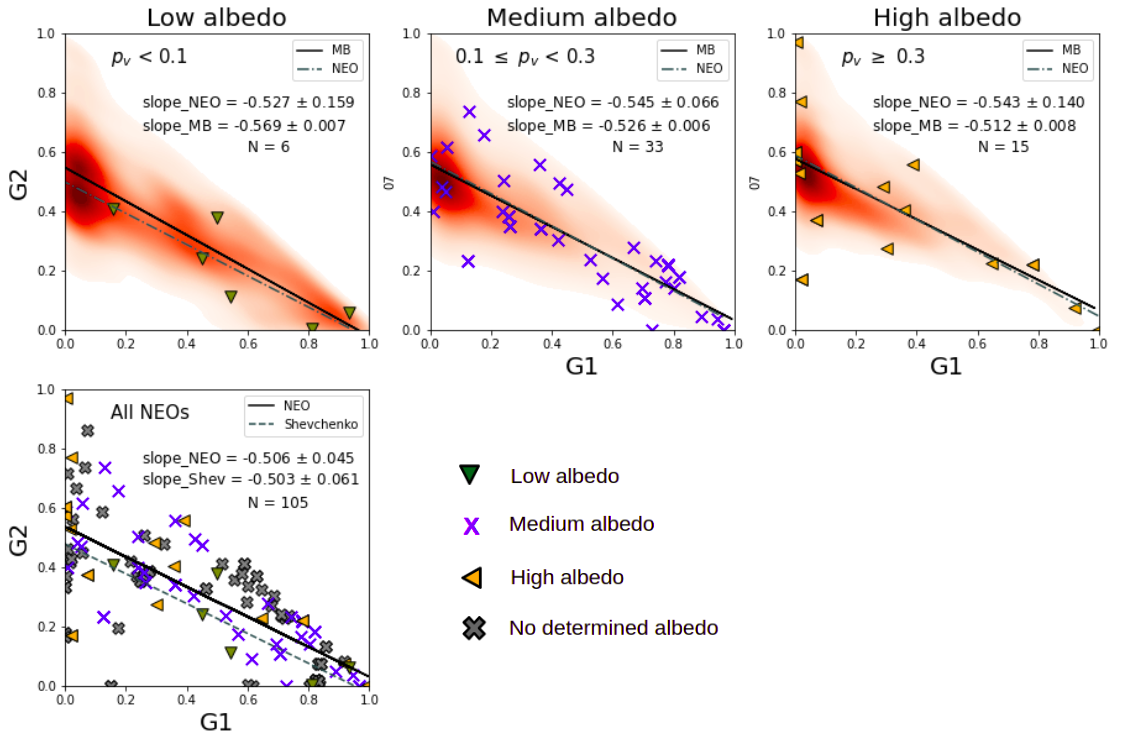
Figure 2 : G1, G2-pairs for MB 𝐷 < 10km with three albedo ranges for all NEOs with determined albedo (upper panels), and for all 105 NEO sample (bottom panel). The black line indicate the linear fits to the MB data and the dashed line indicate the linear fits to the NEO.
Acknowledgements
P.A., E.R., F.M., M.E, W.P. and J.M. would like to thank CNPq, FAPERJ and CAPES for their support through diverse fellowships. Support by CNPq (310964/2020-2) and FAPERJ (E-26/202.841/2017 and E-26/201.001/2021) is acknowledged by D.L. The authors are grateful to the IMPACTON team, in special to R. Souza, A. Santiago and J. Silva for the technical support.
References
[1] Bottke, W.F., Morbidelli, A., Jedicke, R., Petit, J.M., Levison, H.F., Michel, P., Metcalfe, T.S., 2002. . Icarus 156, 399–43.
[2] Morbidelli, A., Walsh, K.J., O’Brien, D.P., Minton, D.A., Bottke, W.F., 2015. pp. 493–507
[3] Helfenstein, P., Veverka, J., 1989. Asteroids II, University of Arizona Press, Tucson, pp. 557–593
[4] Rondón, E., Arcoverde, P., Monteiro, F., Medeiros, H., Navas, G., Lazzaro, D., Carvano, J.M., Rodrigues, T., 2019. 484, 2499–2513
[5] Rondón, E., Lazzaro, D., Carvano, J., Monteiro, F., Arcoverde, P., Evangelista, M., Michimani, J., Mesquita, W., Rodrigues, T., 2022. 372, 114723.
[6] Ieva, S., Arcoverde, P., Rondón, E., Giunta, A., Dotto, E., Lazzaro, D., Mazzotta Epifani, E., Perna, D., Fanasca, C., Rodrigues, T., Monteiro, F., Medeiros, H., Silva-Cabrera, J.S., Di Paola, A., 2022.
[7] Mahlke, M., Carry, B., Denneau, L., 2021. 354, 114094.
[8] Tonry, J.L., Denneau, L., Flewelling, H., Heinze, A.N., Onken, C.A., Smartt, S.J., Stalder, B., Weiland, H.J., Wolf, C., 2021. VizieR Online Data Catalog , J/ApJ/867/105.
[9] Shevchenko, V.G., Belskaya, I.N., Muinonen, K., Penttilä, A., Krugly, Y.N., Velichko, F.P., Chiorny, V.G., Slyusarev, I.G., Gaftonyuk, N.M., Tereschenko, I.A., 2016. . 123, 101–11
How to cite: Arcoverde, P., Rondón, E., Monteiro, F., Pereira, W., Ieva, S., Lazzaro, D., Michtchenko, T., Evangelista, M., Michimani, J., Mesquita, W., Corrêa, T., Dotto, E., Giunta, A., Di Paola, A., Medeiros, H., Carvano, J. M., and Rodrigues, T.: Physical properties of NEOs derived from their phase curves, Europlanet Science Congress 2022, Granada, Spain, 18–23 Sep 2022, EPSC2022-746, https://doi.org/10.5194/epsc2022-746, 2022.
Introduction
Asteroids lightcurves have been used extensively to derive many important physical characteristics such as rotational properties (rotational period and pole direction) and shape (Kaasalainen et al., 2004; Hanus et al., 2011; Durech et al., 2015), as well as to identify and characterize binary asteroids (Pravec et al., 2006). In addition, the rotational period and shape obtained from lightcurves can be used to estimate the internal cohesion strength required to prevent structural failure by centrifugal forces (e.g. Holsapple, 2007; Scheeres et al., 2010; Sánchez and Scheeres, 2014). Here, we will present some results of our extensive observational campaign for the physical characterization for a large sample of NEOs (Monteiro et al., 2017; Monteiro et al., 2018a,b; Rondón et al., 2019, 2020; Monteiro et al., 2020, 2021; Rondón et al., 2022; Monteiro et al., submitted).
Observations and data reduction
Photometric observations of about 150 NEOs were made at the Observatório Astronômico do Sertão de Itaparica (code Y28, OASI) of the IMPACTON project between 2012 and 2020. The images were acquired with the 1.0-m telescope using a 2048 x 2048 Apogee Alta U42 CCD camera. More details on the available instrumentation are given in Rondón et al., 2020. Lightcurve observations were carried out using sidereal tracking and an R-Johnson-Cousins filter. To obtain photometric spectra, observations were made using the g, r, i, z Sloan Digital Sky Survey (SDSS) filters. The science images were calibrated following the standard procedures, including bias, dark and flat-field images. The rotation periods were derived using a Fourier series analysis (Harris et al., 1989) while the spin direction and shape model were obtained by applying the lightcurve inversion method (Kaasalainen and Torppa, 2001; Kaasalainen et al., 2001). To investigate binary periods we used the "Dual Period Search" tool in MPO Canopus software. To obtain the photometric spectrum of some objetcs, we used standard field stars to calculate the zero-point of the night and, consequently, the calibrated magnitude of the asteroid.
Results
Reliable rotational periods and lightcurve amplitudes were determined for 88 NEOs (Monteiro et al. 2018a,b; Monteiro et al., submitted). For another 30 NEOs, only an estimate for the rotational period was obtained. The spin direction and shape model were obtained for about 15 NEOs. As an example, Fig. 1 shows the convex shape model for the NEO 2011 UW158, whose complete physical characterization was reported in Monteiro et al. (2020). These pole directions, along with those obtained from the DAMIT database (Durech et al. 2010), were used to analyze the pole distribution of the NEO population (Fig. 2). It is interesting to note that there appears to be a lack of poles toward the ecliptic plane. Clearly, a more representative sample is needed in order to derive robust conclusions.

Figure 1
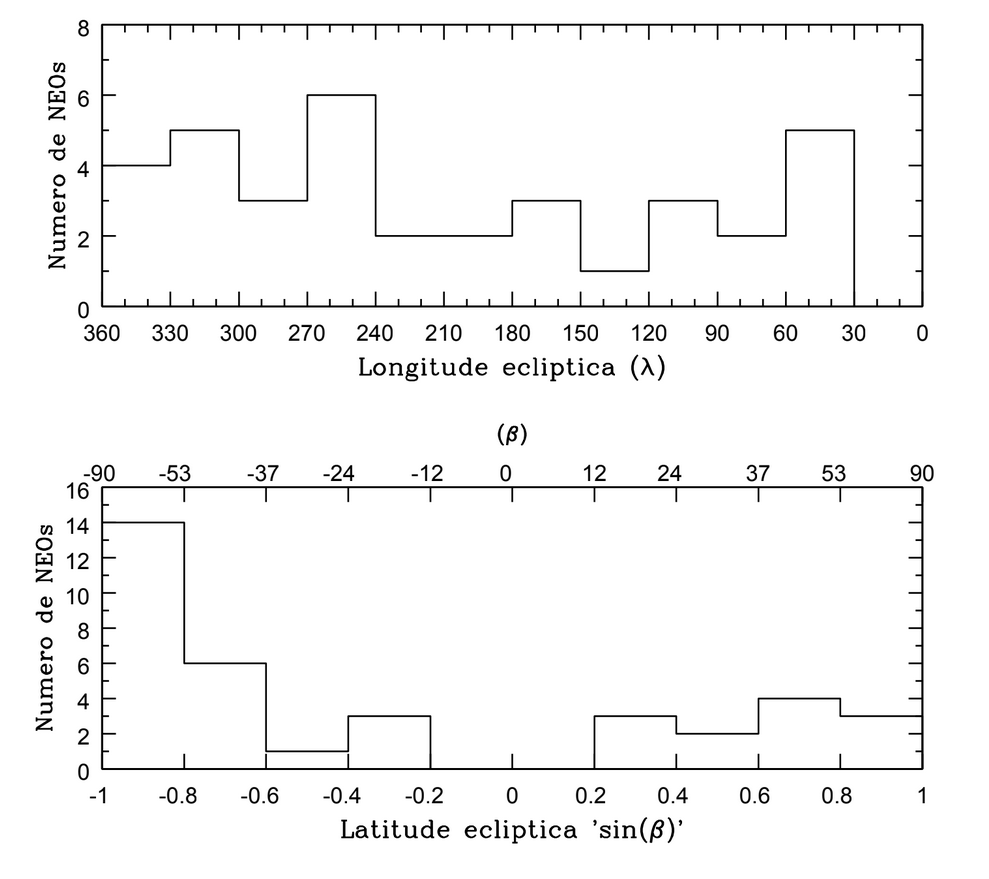
Figure 2
About 20 fast rotators in our sample were analyzed for signs of satellites. For 8 of them, binarity signatures were found in their lightcurves (Monteiro et al., submitted). Fig. 3 shows the primary and secondary lightcurves of a suspected binary showing a possible mutual observed event. For the possible binaries (138846) 2000 VJ61 and (243566) 1995 SA, we derived the minimum relative size of the components of 0.26 and 0.37, respectively. NEOs 2007 EX, 2014 KD91 and 2015 FS332 showed a secondary lightcurve, but no signs of eclipse/occultation, indicating the rotation of a possible satellite.
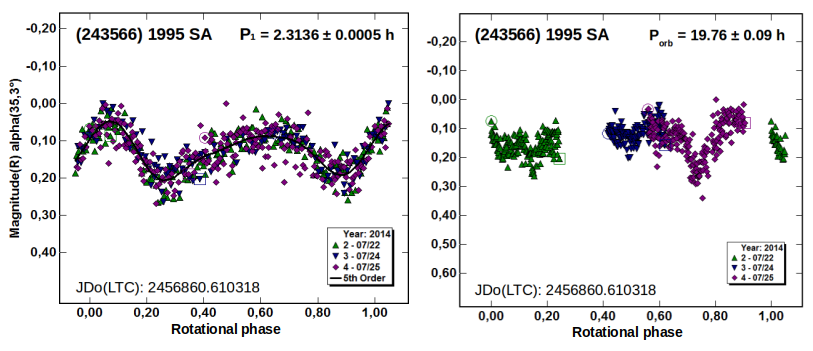
Figure 3
We found binarity signatures for 3 confirmed binaries (Monteiro et al., submitted). The NEO (31345) 1998 PG showed a secondary lightcurve, but no clear mutual events, with a period of about 16 h. The primary and secondary lightcurves of this objects is shown in Fig. 4. Finally, we estimate the internal cohesion strength required to prevent the failure of seventeen binary candidates that rotate beyond the cohesionless bodies limit. We found a minimum cohesion ranging from 3 to 90 Pa, which is in agreement with the numerical simulations reported in the literature (Sánchez and Scheeres, 2014). This analysis is included in detail in our recently submitted paper (Monteiro et al., submitted).
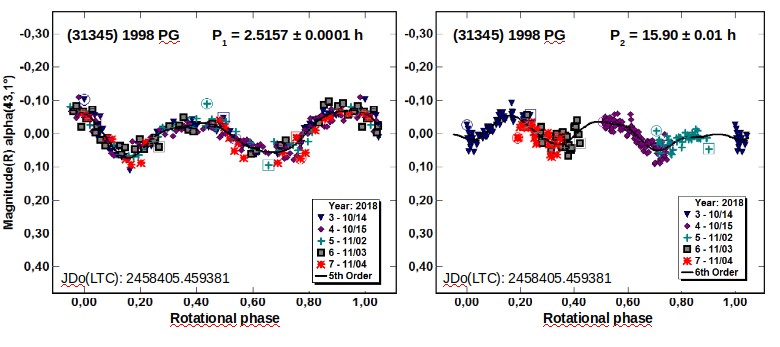
Figure 4
Conclusions
We determined a large sample of reliable lightcurves with well defined rotation period and amplitude. We derived the rotational period for about 30 PHAs and for some of them we indicated their possible taxonomic types. The derived spin direction, along with those obtained from the DAMIT database, continue to show a majority of retrograde rotators, which is consistent with a preferential transport route from the inner main belt. In addition, we identified 8 possible binary NEOs, which showed binarity signatures in their lightcurves. Finally, we showed that some fast rotators in our sample require an internal cohesion strength of 3 to 100 Pa to avoid structural failure by centrifugal forces.
Acknowledgements
F.M. thanks the financial support given by FAPERJ (E-26/201.877/2020). E.R., M.S., P.A, W.P., W.M., H.M. and T.C. would like to thank CAPES and CNPq for supporting this work through diverse fellowships. Support by CNPq (310964/2020-2) and FAPERJ (E-26/202.841/2017 and E-26/201.001/2021) is acknowledged by D.L. The authors are grateful to the IMPACTON team and, in particular, to R. Souza and A. Santiago for the technical support.
References
Durech J. et al. (2010), A&A, 513, A46.
Durech, J.,et al., 2015. Asteroids IV, pages 183-202.
Harris A. W., et al., 1989, Icarus, 77, 171.
Holsapple, K. A. (2007). Icarus, 187(2):500-509.
Kaasalainen, M. and Torppa, J. (2001). Icarus, 153:24-36.
Kaasalainen, M., Torppa, J., and Muinonen, K., 2001. Icarus, 153:37-51.
Kaasalainen, M., et al., 2004. Icarus, 167(1):178-196.
Margot J.L., et al., 2015. Asteroids IV. Pp 355–374.
Monteiro, F., et al., 2017. Minor Planet Bulletin 44, 20-22.
Monteiro, F., et al., 2018a. Minor Planet Bulletin 45, 221-224.
Monteiro, F., et al., 2018b. Planet. Space Sci. 164, 54-74.
Monteiro, F., et al., 2020. MNRAS, 495, 3990-4005.
Monteiro, F., et al., 2021. MNRAS 507, 5403–5414.
Perna, D., et al., 2016. AJ, 151(1):11.
Pravec, P., et al., 2006, icarus, 181, 63.
Rondón, E., et al., 2019. MNRAS, 484:2499–2513.
Rondón, E., et al., 2020. PASP, 132(1012):065001
Rondón, E., et al., 2022. Icarus 372, 114723.
Sánchez, P. and Scheeres, D. J., 2014. Meteoritics and Planetary Science, 49(5):788-811.
Scheeres, D. J., et al., 2010. Icarus, 210(2):968-984.
How to cite: Monteiro, F., Lazzaro, D., Rondón, E., Evangelista-Santana, M., Arcoverde, P., Pereira, W., Mesquita, W., Michimani, J., Medeiros, H., Corrêa, T., Silva-Cabrera, J., and Rodrigues, T.: Physical characterization of near-Earth objects from the IMPACTON project, Europlanet Science Congress 2022, Granada, Spain, 18–23 Sep 2022, EPSC2022-767, https://doi.org/10.5194/epsc2022-767, 2022.
Introduction
Asteroid (594913) 'Aylo'chaxnim, formerly designated as 2020 AV2, is the only one known to orbit inside Venus orbit. It was first observed by the Zwicky Transient Facility on January 4, 2020 (Bolin et al. 2020) and it may represent the largest member of a new population of small bodies with the aphelion distance smaller than 0.718 a.u., called Vatiras (Greenstreet et al. 2012). Because of its orbit, the surface of this asteroid is being constantly modified by the high temperature, by the strong solar wind irradiation that characterizes the innermost region of the Solar system, and by high-energy micrometeorite impacts. Thus, it represents an extreme case when compared with the near-Earth asteroids.
Based on the observations obtained on January 13, and 14, 2020, we found that 'Aylo'chaxnim has a wide spectral absorption band around 1 μm that represents the signature of an olivine-rich composition. The estimated absorption band center BIC = 1.08 ± 0.02 μm corresponds to a ferroan olivine mineralogy (Popescu et al. 2020 MNRAS). By comparing these spectra with the taxonomic types from Bus-DeMeo taxonomy, we found Sa types as the best fit for the (0.5 - 1.5 ) μm spectral interval. The classification as an S-complex asteroid was also reported by Bolin et al. (2020 EPSC) based on a visible spectrum obtained on January 23, 2020 with the Keck I telescope. They also reported a reddish surface with g-r=0.65 mag and r – i = 0.23 mag and i-z = 0.11 mag.
Here we report new near-infrared spectra, in the range 0.8-2.5 μm, obtained using the 3m NASA Infrared Telescope Facility (NASA IRTF). The observations were performed during August 2021, when the object was close to its maximum solar elongation of 40 deg.
Table 1. Observational circumstances for (594913) 'Aylo'chaxnim.
|
Spec. ID |
Average UT |
Average airmass |
Total exp.[sec] |
No. of exp. |
|
S1 |
2021-08-11T14:38:38 |
2.8 |
1912.7 |
16 x 120 sec |
|
S2 |
2021-08-12T14:37:21 |
2.9 |
1793.2 |
15 x 120 sec |
|
S3 |
2021-08-14T15:05:12 |
2.3 |
836.8 |
7 x 120 sec |
Observations
We used the SpeX instrument, with the PRISM mode and a slit of 0.8 x 15 arcsec. This configuration allowed us to cover the 0.82 – 2.5 μm spectral interval. The spectral images were acquired in the ABBA mode. Table 1 shows the observation log for the three sets of data. The object was observable at an air-mass of ~2.5-3 for about 30 min before the start of the morning twilight. We noticed a wide apparent magnitude variation between the nights.
In order to obtain the reflectance spectrum, the asteroid’s observed spectral data must be divided by that of a solar analog. We could observe only one solar analog, a G2V star, namely GSC 01881-01236, which was the best suited for our work in terms of apparent vicinity and time constraints. The data reduction was performed with the Spextool package (Cushing et al. 2004).
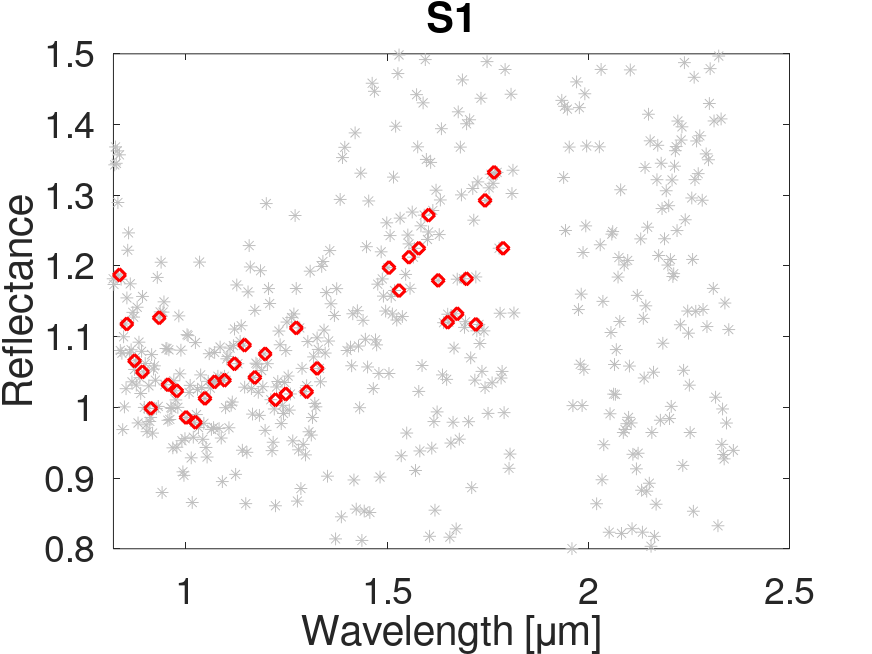
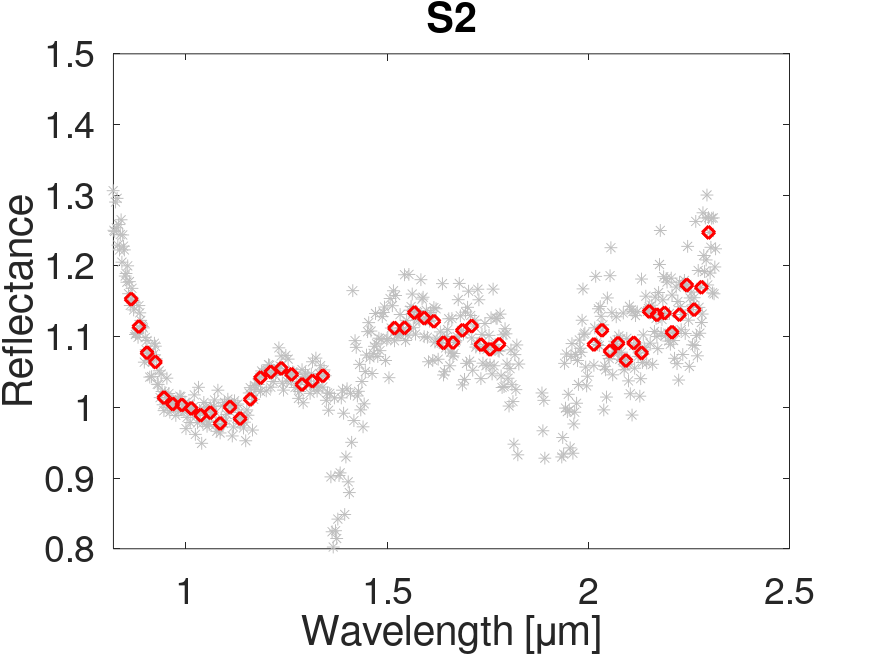
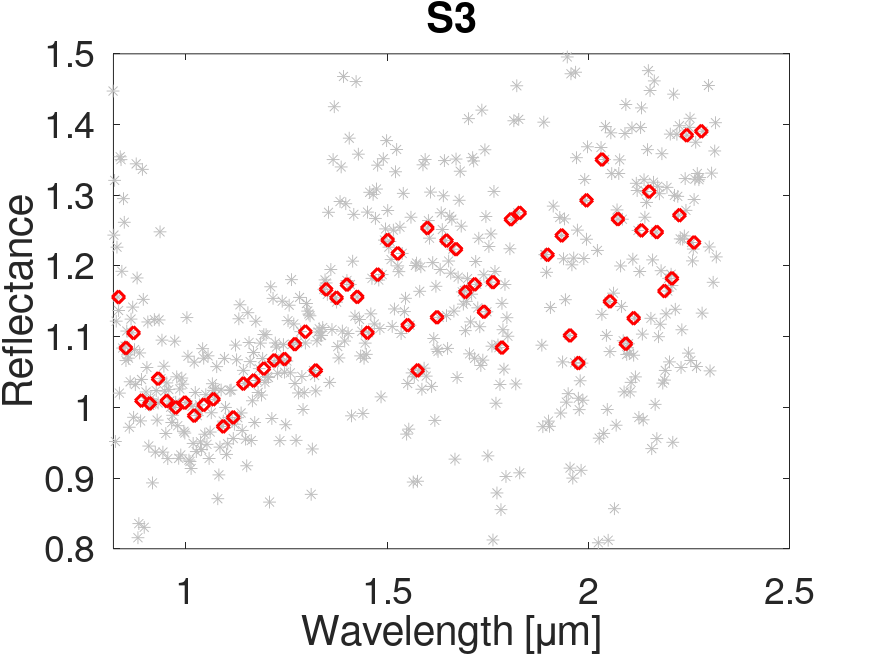
Fig.1 The spectral data obtained with IRTF/SpeX during August 2021 for (594913) 'Aylo'chaxnim. The gray points represent the data obtained as provided by Spextool (the pipeline used to reduce the spectral images). The red points were obtained by binning every 9 points from the original data (the gray ones). The observational details associated with S1, S2, S3 are described in Table 1. The data are normalized at 1 μm.
Results
The spectra obtained during the three nights are identical up to 1.3 μm. They also match the spectrum obtained in 2020 (Fig. 2). The S1 and S3 spectra are redder compared with S2, for wavelengths longer than 1.3 μm. A thermal tail is identifiable for S2.
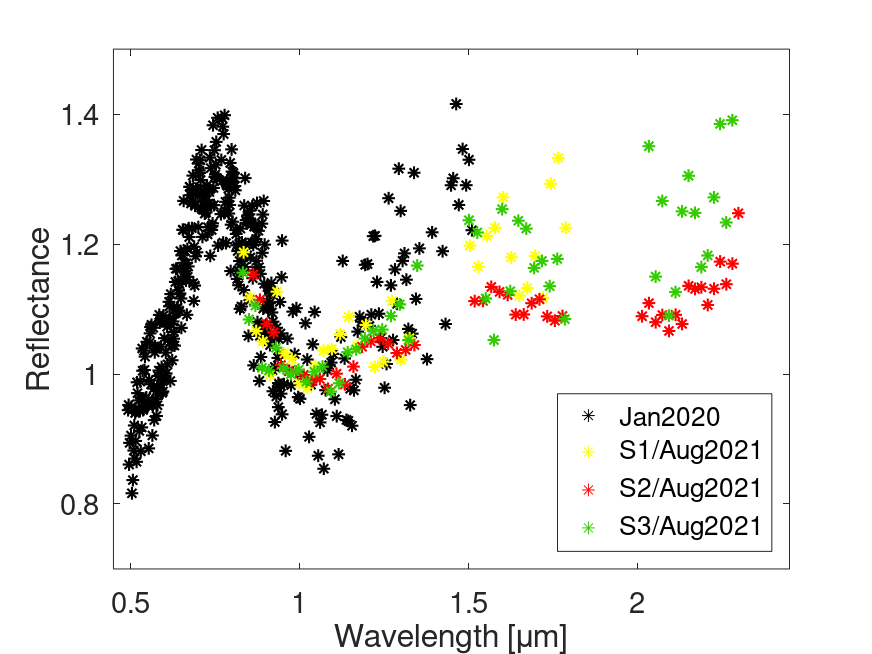
Fig. 2 Comparison between the spectra obtained during January 2020 (Popescu et al. 2020), and those obtained during August 2021. All spectra are normalized to 1 μm.
The absorption band minima (BImin) is located at 1.07 +/- 0.015 μm for S2, and 1.09 +/-0.02 μm for S3 (we did not compute this band center for S1 due to its large error-bars). This result is consistent with the olivine rich composition proposed based on the 2020 observations. The S2, which has the best signal to noise ratio, shows a possible feature at 1.25-1.30 μm, which can also be attributed to olivine.
We used the S2 spectrum for comparison with the RELAB spectral database . Its shape is best matched by the CK meteorites (Cloutis et al. 2021). These are characterized by an olivine associated absorption band in the 1.05 μm region. Compared to pure olivine, CK spectra are darker, have a more subdued olivine absorption band, and are often more blue-sloped (Cloutis et al. 2012).
References
1. Bolin et al. 2020 , Minor Planet Electronic Circ., No. 2020-A99 (2020)
2. Bolin et al. 2020, the 14th Europlanet Science Congress 2020, abstract id. EPSC2020-482
3. Cloutis et al. 2012, Icarus, Volume 221, Issue 2, p. 911-924
4. Greenstreet S., Ngo H., Gladman B., 2012, Icarus, 217, 355
5. Popescu et al. 2020, MNRAS, Volume 496, Issue 3, pp. 3572-3581
Acknowledgments
The work of MP was supported by a grant of the Romanian National Authority for Scientific Research – UEFISCDI, project number PN-III-P1-1.1- TE-2019-1504. The work of MP, JdL, JL, is made in the framework of EU-funded project ”NEOROCKS - The NEO Rapid Observation, Characterization and Key Simulations project”, SU-SPACE-23-SEC-2019 from the Horizon 2020 - Work Programme 2018-2020, under grant agreement No 870403. The abstract make use of data published by the Relab Spectral Database
How to cite: Popescu, M., de la Fuente Marcos, C., Văduvescu, O., de la Fuente Marcos, R., Bus, S., de León, J., Licandro, J., Tatsumi, E., and Simion, G. N.: New near-infrared spectra of (594913) 'Aylo'chaxnim, the first known asteroid orbiting inside Venus orbit, Europlanet Science Congress 2022, Granada, Spain, 18–23 Sep 2022, EPSC2022-804, https://doi.org/10.5194/epsc2022-804, 2022.
Introduction
The asteroid (4660) Nereus is considered one of the most accessible targets for a rendez-vous space mission. It was proposed as a possible target for the NASA Near-Earth Asteroid Rendezvous (NEAR) and for JAXA Hayabusa spacecraft.
The lightcurve analysis and the radar shape modeling revealed a long rotational period of ≅ 15.16 ± 0.04 h [1, 2]. The radar [2] and thermal [3] observations report optical albedo values of 0.54 (-0.09, +0.03) and 0.55 ± 0.17 respectively. Coupled with the featureless spectrum [4], Nereus is classified as an E-type object in the Tholen taxonomy. This class has been associated with enstatite achondrite meteorites.
During the fall of 2020 and the beginning of 2021, (4660) Nereus made a favorable apparition for observations with ground-based telescopes. It had an apparent magnitude brighter than 18.5 V mag. for about 7 months. The peak brightness was 12.9 on the night of December 7. In this context, we performed an extended characterization using various telescopes. Thus, we report light-curves, spectro-photometric data and spectral observations for Nereus.
Observations
We obtain the light curve of (4660) Nereus using the T025-BD4SB, a 0.25 m aperture telescope located at the Bucharest Astronomical Institute , Romania. About 65 hours of observations were obtained during 8 nights spread between October 27 and November 25, 2021. These data were acquired using the QHY294M CMOS camera.
The color indices in the visible region were determined using the MuSCAT2 instrument of the 1.52 m Telescopio Carlos Sanchez (TCS) located in Tenerife, Spain. This instrument allows simultaneous images with the broad band filters g (0.40 - 0.55 μm), r (0.550 - 0.70 μm), i (0.70 - 0.82 μm), and zs (0.82 - 0.92 μm). As such, we gathered 15.2 hours of data during six nights of observations spread over October 02, 2021 until April 02, 2022.
Additional photometry data was obtained using the 2.54 m Isaac Newton Telescope (La Palma, Spain) equipped with Wide Field Camera (WFC). We obtained 6 hrs of photometric observations using the B, V, R Johnson filters, and the r and z SDSS filters during the nights of March 2, and April 18, 2022.
The spectrum in the near-infrared region was obtained using the 3.58m Galileo National Telescope (La Palma, Spain). We used the near-infrared camera spectrometer (NICS) with the AMICI prism and a a.5 arcsec slit-width. The configuration allowed a resolving power of R=50 and a spectral interval coverage of 0.8 - 2.45 μm.
The photometric data reduction has been made using the Photometry Pipeline [5]. We also used IRAF and MP0 Canopus to cross-check the results. The spectral data was reduced using a dedicated pipeline written in Python.
Results
First we performed a photometric analysis of the asteroid (4660) Nereus. We determined its period using the Lomb-Scargle Periodogram and we investigated the YORP effect on the asteroid. Subsequently, we obtained the object's phase curve and we computed its absolute magnitude (H) and the slope parameter (G). Then we determined its color indices and we used them for classification. Finally, we reviewed its taxonomic classification based on the new acquired spectrum.
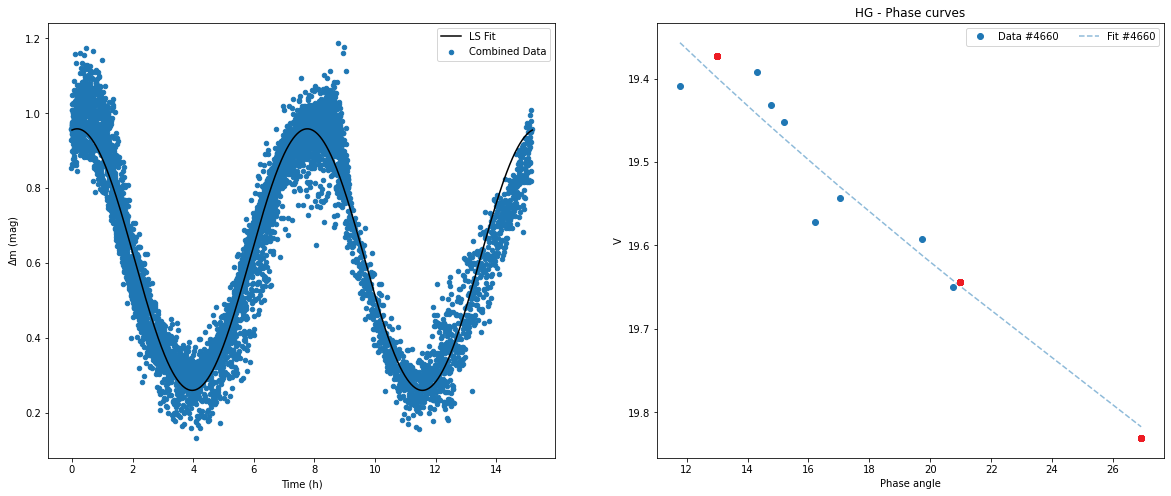
Fig 1: Left: The folded lightcurve of (4660) Nereus obtained by combining
the data from T025-BD4SB and TCS. Right: Phase curve of (4660) Nereus. The
red points are TCS observations while the blue ones are T025-BD4SB. The
dotted line represents the H-G model fit.
The Lomb-Scargle periodogram peaks at a value of 15.19 hrs. The light-curve corresponding to this period is plotted in Fig. 1. This value is in the range reported by [1] determined a period of 15.1 ± 1.2 h. It is also compatible with the value obtained using radar data [2] of 15.16 ± 0.04 h.
Because of its size, (4660) Nereus is subjected to the YORP effect which affects the asteroid's spin rate. We estimate a change of one to four seconds for its rotation period in a range of 10 years. Unfortunately, the previous values for its rotation period have much larger uncertainties. As such, another favorable observing window is needed to quantify this effect.
Furthermore, we determine the phase curve of the asteroid in order to obtain its absolute magnitude. In order to do this, we use the Pyedra software [6]. The algorithm allowed us to use the H-G model [7] in order to fit our phase curve (Fig. 1). We obtained the absolute magnitude (H = 18.69 ± 0.18) and the slope parameter (G = 0.209 ± 0.06). In Fig. 1 we show our results. For comparison, [8] reported a value of 18.58 ± 0.06.
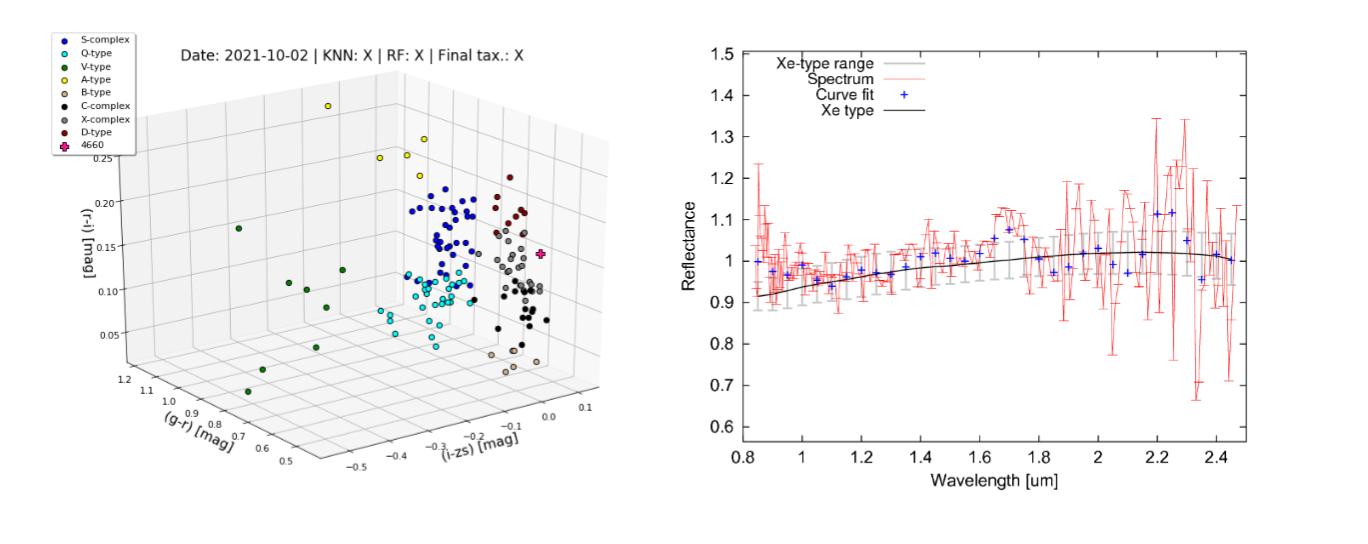
Fig 2: Left: The color-color diagram of (4660) Nereus compared with the reference data-set (Popescu et al. 2022 - paper in preparation). Right: The near-infrared spectrum of (4660) Nereus and its taxonomic classification.
The TCS/MuSCAT2 instrument allowed us to simultaneously obtain the light-curve in all four filters. We found (g-r) = 0.537 ± 0.048, (r-i) = 0.145 ± 0.012, (i-zs) = 0.091 ± 0.017. In addition to these values, we obtained the (B-R) = 1.15 ± 0.05 mag, and ± = 0.043 ± 0.03 mag color indices.
The average color values obtained with TCS/MuSCAT2 are compatible with an X-complex classification (Fig. 2). This result complements the spectral classification based on the data obtained with TNG/NICs instrument. The spectrum shown in Fig. 2 is compatible with the Xe type.
Acknowledgments
The work of MP and RMG was supported by a grant of the Romanian National Authority for Scientific Research -- UEFISCDI, project number PN-III-P1-1.1-TE-2019-1504. The work of MP, JdL, JL, and DM is made in the framework of EU-funded project "NEOROCKS project", SU-SPACE-23-SEC-2019 from the Horizon 2020 - Work Programme 2018-2020. The observations were obtained trough the EURONEAR collaboration.
[1] Y. Ishibashi et al, 2000, Earth, Planets and Space
[2] Marina Brozovic et al, 2009, Icarus
[3] Marco Delb ́o et al, 2003, Icarus
[4] Richard P. Binzel et al, 2004, Asteroids II
[5] M. Mommert, 2017, Astronomy and Computing
[6] M. Colazo et al, 2022, Astronomy and Computing
[7] Edward Bowell et al, 1989, Asteroids II
[8] Y. Ishibashi et al, 2000, Advances in Space Research
How to cite: Mansour, J. A., Popescu, M., de León, J., Berteșteanu, D., Morate, D., Văduvescu, O., Licandro, J., Dumitru, B. A., Simion, G. N., Gherase, R. M., Pinter, V., and Tatsumi, E.: Physical characterization of asteroid (4660) Nereus, Europlanet Science Congress 2022, Granada, Spain, 18–23 Sep 2022, EPSC2022-984, https://doi.org/10.5194/epsc2022-984, 2022.
Introduction
When talking about Trojan asteroids -- bodies orbiting around the L4 or L5 Lagrangian points of a Sun-planet system -- it is inevitable to refer to Jupiter. This giant planet has, by far, the largest reservoir of Trojan asteroids with thousands of objects discovered since 1906. We currently know, however, that other planets are also able to host asteroids in such a peculiar orbital configuration, although in much smaller number. Trojan asteroids can be important to study the formation and evolution of our Solar System since, some of them – called primordials -- might be remnants of the formation processes of the hosting planet. The first Earth Trojan asteroid (ETA) was discovered in 2010 librating around L4. Thenceforth, several dedicated observational campaigns have been scrutinizing L4 and L5 areas, trying to find a second ETA. In this work we describe how we confirmed (614689) 2020 XL5 as the second ETA and we discuss why it is so arduous to detect these objects with groundbased observations.
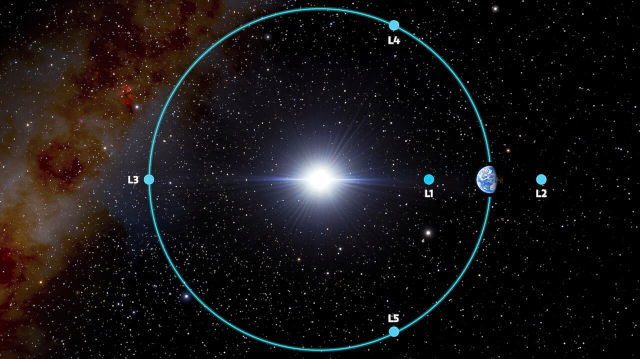
Fig.1: The Sun-Earth Lagrangian points. 2020 XL5 is librating around L4. (NOIRLab/NSF/AURA/J. da Silva)
Observations
Asteroid 2020 XL5 was discovered by the Pan-STARRS1 survey on 2020 December 12. An initial orbit determination was obtained from follow-up observations gathered during the next few weeks. Some solutions suggested that 2020 XL5’s orbit could be librating around L4, but the short arc covered with observations was still to short for a long term analysis [8]. However, observations were challenging due to the object’s faintness (V~22 mag) and its proximity with the Sun (ε<40°).
Our team started a follow-up campaign and was able to obtain a few new measurements (Fig.2) of the object during February and March 2021 using ESA’s Optical Ground Station (OGS) 1.0 m telescope, the 4.1 m Southern Astrophysical Research (SOAR) telescope and the 4.3 m Lowell Discovery Telescope (LDT). Despite the successful results of the observation campaign and the consequent improvement of the orbit of 2020 XL5, the arc was still too short for a conclusive result. However, the orbit now allowed us for a detective work among the tons of data from the surveys. Precoveries were found in the files of the Catalina Sky Survey (1.5 m Mt. Lemmon telescope), DECam instrument (4.1 m Victor M. Blanco telescope) and the archive of the 1.8 m Pan-STARRS survey (Fig. 3).
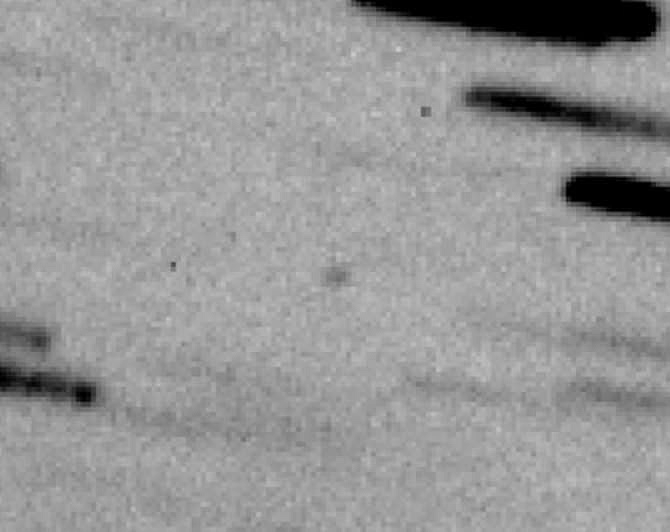
Fig.2: LDT detection of 2020 XL5.
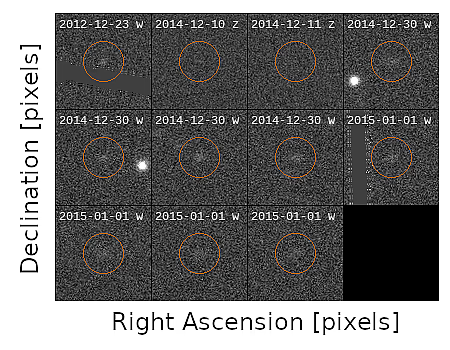
Fig.3: Pan-STARRS ancillary data of 2020 XL5.
Results
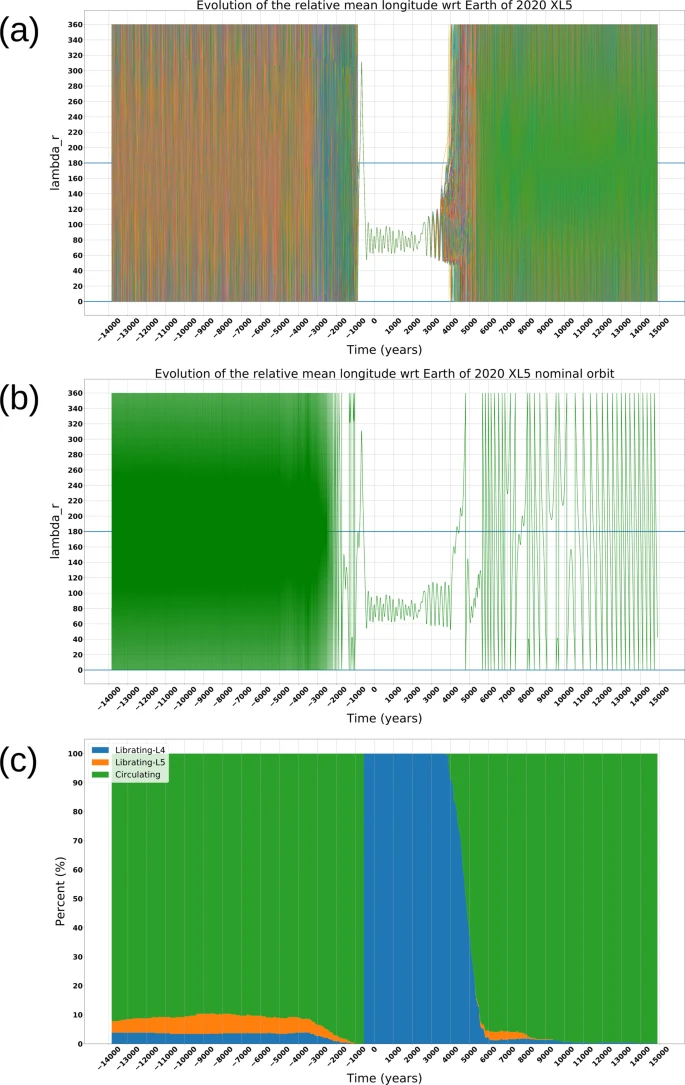
Fig.4: a The relative mean longitude (λr) evolution of the 2020 XL5 nominal orbit and clones orbit over 29 000 years, where each clone orbit is represented by a different color, while the green line represents the nominal orbit. b Evolution of λr for the nominal orbit of 2020 XL5. c Stack plot representing the behavior of the nominal orbit and the 800 clone orbits. In the plot the time t0 = 0 is the mean epoch of the orbits.
With all the data in hand, we generated hundreds of clone orbits along a time span of 29 000 years, applying the Cholesky method for multivariate normal distributions [9]. The study of the relative mean longitude of 2020 XL5 (Fig.4) revealed that the object is indeed a transient ETA, which was captured some 500 years ago and will keep librating around L4 for at least 4000 more years. In addition, we performed a preliminar physical characterization of the asteroid by means of photometry. We estimated its absolute magnitude to be Hr =18.58 (+0.16−0.15), and color indices suggestive of a C-complex taxonomy. Assuming an albedo of 0.06 ± 0.03 we obtained a bulk diameter of 1.18 ± 0.08 km.
References
[1] Dvorak, R. & Schwarz, R. On the stability regions of the Trojan asteroids. Celest. Mech. Dyn. Astron. 92, 19–28 (2005).
[2] Connors, M., Wiegert, P. & Veillet, C. Earth’s Trojan asteroid. Nature 475, 481–483 (2011).
[3] Wiegert, P. A., Innanen, K. A. & Mikkola, S. An asteroidal companion to the Earth. Nature 387, 685–686 (1997).
[4] Whiteley, R. J. & Tholen, D. J. A CCD search for Lagrangian asteroids of the Earth-Sun system. Icarus 136, 154–167 (1998).
[5] Markwardt, L. et al. Search for L5 Earth Trojans with DECam. Mon. Not. R. Astron. Soc. 492, 6105–6119 (2020).
[6] Lifset, N., Golovich, N., Green, E., Armstrong, R. & Yeager, T. A search for L4 Earth Trojan asteroids using a novel track-before-detect multiepoch pipeline. Astron. J. 161, 282 (2021).
[7] Santana-Ros et al. Orbital stability analysis and photometric characterization of the second Earth Trojan asteroid 2020 XL5. Nature Communications 13, 447 (2022)
[8] de la Fuente Marcos, C. & de la Fuente Marcos, R. Transient terrestrial Trojans: comparative short-term dynamical evolution of 2010 TK7 and 2020 XL5. Res. Notes Am. Astronomical Soc. 5, 29 (2021).
[9] T., T. N. Essentials of Monte Carlo Simulation (Springer-Verlag, New York, 2013).
Acknowledgements
TSR acknowledges funding from the NEO-MAPP project (H2020-EU-2-1-6/870377). This work was (partially) funded by the Spanish MICIN/AEI/10.13039/ the Institute of Cosmos Sciences University of Barcelona (ICCUB, Unidad de Excelencia ‘María de Maeztu’) through grant CEX2019-000918-M.
How to cite: Santana-Ros, T., Micheli, M., Faggioli, L., Cennamo, R., Devogèle, M., Alvarez-Candal, A., Liu, P.-Y., Benavidez, P. G., and Campo Bagatin, A.: Operating manual on how to find an Earth Trojan asteroid, Europlanet Science Congress 2022, Granada, Spain, 18–23 Sep 2022, EPSC2022-986, https://doi.org/10.5194/epsc2022-986, 2022.
The Herschel Space Observatory observed with its PACS and SPIRE instruments a diverse selection of astronomical objects, including Solar System objects (SSOs), either in dedicated measurements or serendipitously. The infrared observations of asteroids helped scientists to determine their physical and thermal properties. In addition, PACS and SPIRE observations of selected large asteroids were used for a wide range of calibration aspects. Due to their strong thermal emission, SSOs may sporadically also contaminate the photometric measurements of other sources. Racero et al. (2022) presented ESASky tools to find these moving targets in Herschel data products. As a first step, we focused on the flux extraction of these serendipitous observations of SSOs in Herschel/PACS measurements at 70, 100 and 160 μm. We obtain far-infrared photometry on the PACS maps, either by extracting the flux densities from the existing standard data products, or via re-reducing the PACS maps in the co-moving frame of the target. Based on these scientifically very important far-IR flux densities, in combination with already published IR detections (Szak ́ats et al., 2020), we perform radiometric studies to determine the objects’ physical and thermal properties with unprecedented accuracy.
A natural continuation of our current work is the extension to SPIRE maps at 250, 350, and 500 μm, with a two-fold aim. First, to find serendipitous asteroids, extract new submm flux densities and flag sources in the SPIRE Point Source Catalog (Schulz et al., 2018) for possible contamination. In addition, the dedicated SPIRE observations of asteroids for various calibration activities are not yet published. As the SPIRE absolute photometry is connected to planet models, these asteroid flux densities are of great value and will put strong constraints on their submm emissivity properties. All SPIRE asteroid measurements were reprocessed and calibrated with the latest pipeline. The final maps are then used to extract high quality IR/submm flux densities. The flux densities are then added to the publicly available SBNAF Infrared Database (Szakáts et al., 2020).
We collected the Herschel/SPIRE targeted asteroid measurements, and we went through the list of SPIRE observations with potential serendipitous asteroid detections (from Racero et al. 2022). We only considered those, where the isvisible flag was ’true’. In a first step we verified that the photometry via the point source calibrated maps and the SSO calibrated maps are in agreement. This is important because all the dedicated measurements were reprocessed in the object co-moving frame and made available in the Herschel Science Archive, but not the serendipitous ones. Our tests confirmed that the two maps give the same flux densities within the error bars, so there is no need to reprocess the serendipitous maps into the co-moving frame. In a second part of the project, after making all flux densities available in the IR database, we perform radiometric
studies for individual asteroids. Depending on the a priori knowledge for a given object, we distinguish between the following five categories: (1) mission targets, well-known/-studied objects; (2) objects with good-quality spin-shape solution and multi-epoch/-mission thermal measurements; (3) good-quality spin-shape solution, but very limited or no thermal measurements available; (4) no good-quality spin-shape solution, but sufficient multi-epoch/-mission thermal measurements available; (5)
no spin-shape solution and very limited thermal measurements available. In each of these five categories, the SPIRE (and PACS) flux densities are important to obtain the object’s emissivity properties, to constrain the thermal properties of the surface or to establish basic radiometric size-albedo solutions.
We will present an overview of the new far-IR and sub-mm measurements (for about 17 dedicated program asteroids and several different main-belt asteroids), the extracted flux densities, and applications for the different categories.
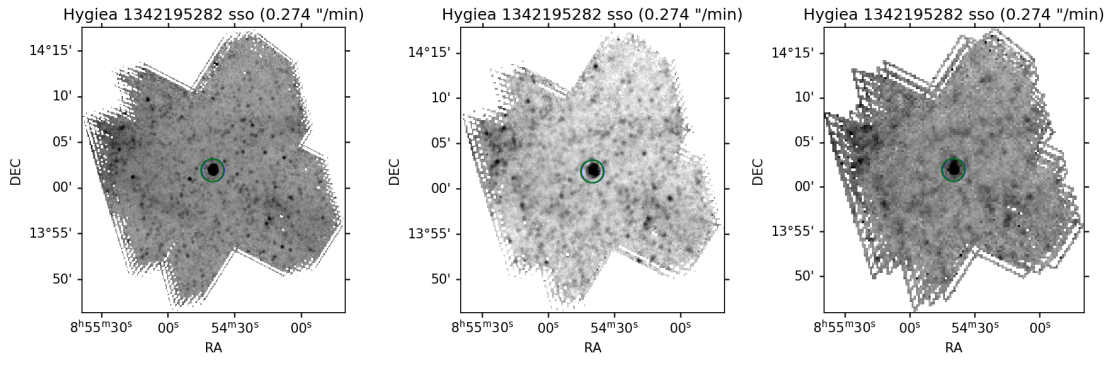
Figure 1: The SPIRE maps for asteroid (10) Hygiea at 250, 350, and 500 μm, taken from a dedicated calibration sequence, and processed in the object’s co-moving frame.
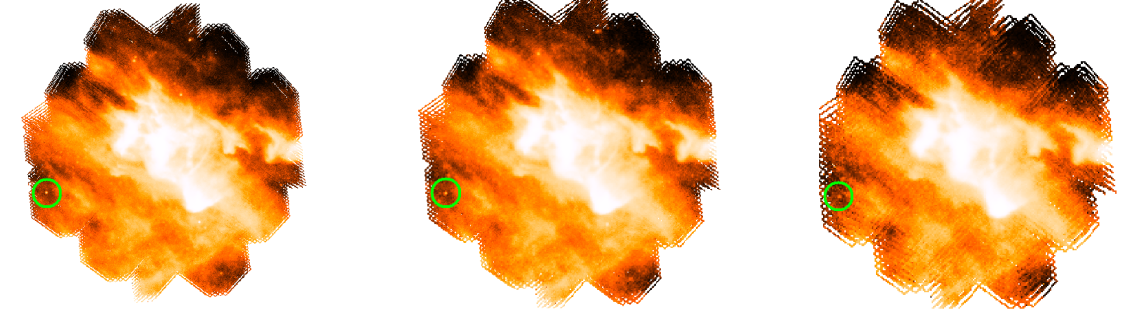
Figure 2: The SPIRE maps of the serendipitously seen asteroid (464) Megaira (marked by the green circles) at 250, 350, and 500 μm.
How to cite: Szakáts, R., Kiss, C., Müller, T., and Valtchanov, I.: Herschel/SPIRE photometry of targeted and serendipitously observed asteroids, Europlanet Science Congress 2022, Granada, Spain, 18–23 Sep 2022, EPSC2022-1060, https://doi.org/10.5194/epsc2022-1060, 2022.
Introduction
2022 AB is a very small near-Earth asteroid that passed Earth at a distance of 9.6 lunar distances on 20 January.
Our campaign started on 4 January and until 26 January, we observed 2022 AB using telescopes located in many places around the world. More about the campaign, including the determination of the phase curve, will be presented during this conference in a separate presentation [2]. Here we only present results regarding the colour indices, taxonomic class, and diameter. We organised a similar observation campaign for 2021 DW1 in 2021 [3][4][5].
Rotation period
In determining the colours indices, it is very important to know the rotation period of the asteroid. We discussed the issues, especially in the field of NEAs, at the conference last year [5].
We briefly discuss the determination of the rotation period using an example of observations from the first night of the campaign of 2022 AB. More will be discussed in [2].
We used a 0.7-m RBT/PST2 telescope(Arizona), 5-s exposures, and the clear filter. We observed object for 1.5 hours and we create composite lightcurve with Fourier series fit (see Figure 1). In this way, we determined the rotation period P=182 s.
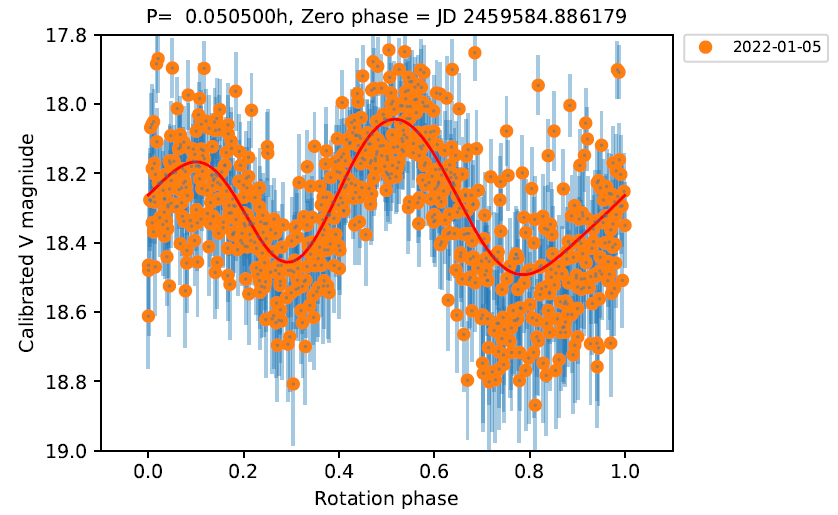
Figure 1: Example of composite lightcurve of 2022 AB.
Colour indices
The preliminary results presented here are based on most of the data obtained. The full results will be presented during the conference.
To determine the colour indices, we used observations from three telescopes: 0.7-m RBT, 1-m telescope of DOAO (South Korea), and 1-m telescope of Pic du Midi Observatory (France). Telescopes from DOAO and Pic du Midi observed the asteroid with an exposure time of several seconds in the B,V,R,I (DOAO) or g’,r’,i’,z’ (Pic du Midi) filters. Due to changes in the geometry of the observations, we divided the observations into several sets. Using solar analogues, we transformed the brightness in B,V,R,I into g’,r’,i’,z’ bands, respectively. Then, knowing the rotation period, we composited the lightcurves to determine the shifts between the lightcurves in the given bands. We have prepared the composited lightcurves separately for each set. An example is shown in Figure 2. RBT observations were made in B,V,R filters and, as we mentioned, transformed them into g’,r’,i’. In this case, we used knowledge of the rotation period to average the brightness measurements over the period, exposure time Texp=P=182s. Adjacent measurements in different bands allowed us to determine a series of colour indices that we averaged as one set. The results for each set are shown in Table 1.
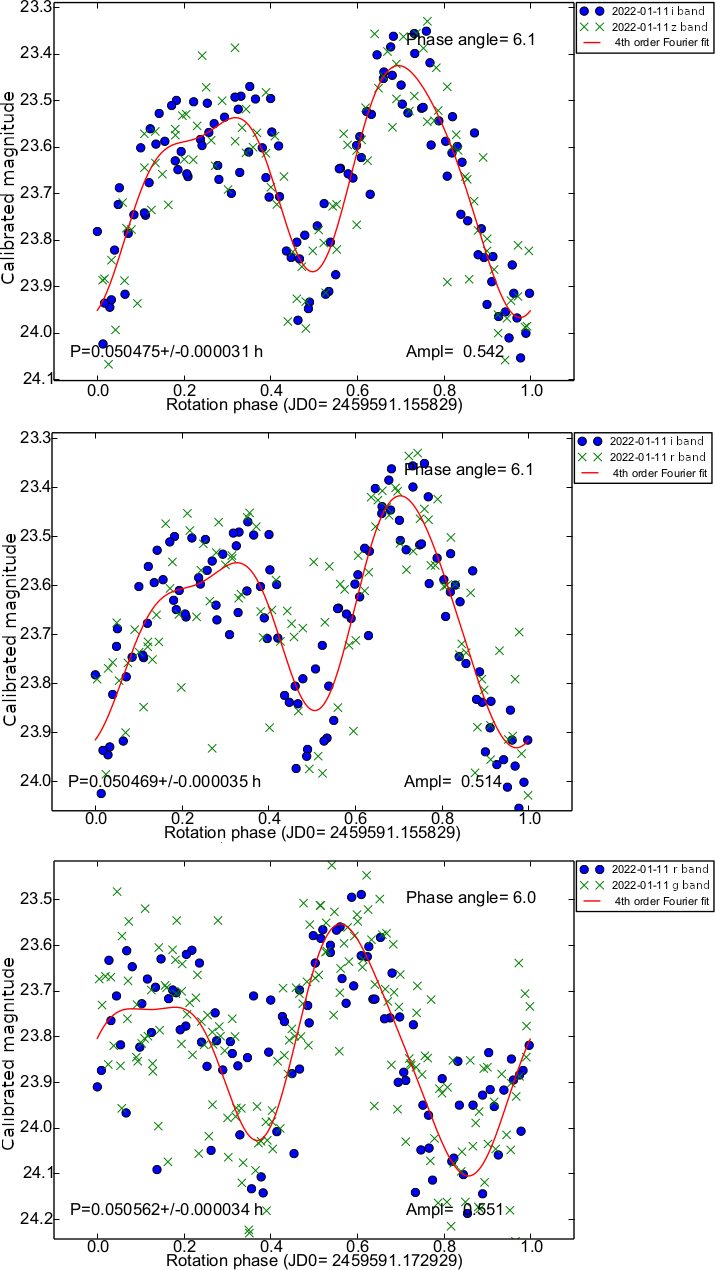
Figure 2: Composite lightcurves for DOAO set 1. Top: lightcurves in i’ (dots) and z’ band (crosses), middle: i’ and (dots) and r’ (crosses) bands, bottom: r’ (dots) and g’ (cross) bands.

Table 1: Preliminary results of colour indices for each set.
Taxonomy
To determine the taxonomic class of 2022 AB, we converted the average value of colour indices to the reflection coefficients Rr,Ri and Rz, normalised to the reflection values in the g band, using the formula [6]:
Rf=10−0.4[(f−g)−(f☉−g☉)]
Next, we compared them with spectra of different taxonomic classes, as given by [6]. In Figure 3 we present the reflective value of the asteroid compared to similar taxonomic classes. B class asteroids are rare and they are mainly associated with the outer main belt. 2022 AB as an NEA is an unlikely class B asteroid. The Cb class fits well with the data of 2022 AB and is the only one to show the common with 2022 AB characteristic of visible absorption around 0.6 micrometre. We suggest that 2022 AB is most likely a type Cb asteroid.

Figure 3: Plot of reflectivities values of B,Cb,Ch asteroid classes (black dots) and 2022 AB (red dots). Data for the B,Cb, and Ch classes were taken from [6].
Diameter
We can determine the diameter knowing the absolute magnitude H and the albedo pV according to equation [7]:
Deff=1329×10−H/5×pV−0.5
At the conference, we will present the results based on the determined H from the phase curve, but for now we used the approximate H=23.6±0.36 given by JPL[1]. Albedo for Cb class asteroids: pV=0.059±0.027 [8], hence Deff=0.104±0.029 km.

Figure 4: Rotation period-diameter plot. The red dotted line is the spin barrier (2.2 h). Other asteroid data come from LCDB [8].
Acknowledgements
This research was funded in whole or in part by the National Science Centre, Poland, grant No. 2021/41/N/ST9/04259.
References
[1] https://ssd.jpl.nasa.gov
[2] Kwiatkowski et al. (2022) Photometry and model of near-Earth asteroid 2022 AB from one apparition,EPSC 2022, held 18–23 September 2022 in Granada, Spain
[3] Kwiatkowski et al. (2021) A&A 656, A126
[4] Kwiatkowski et al. (2021) Photometry and model of near-Earth asteroid 2021 DW1 from one apparition, EPSC 2021, held virtually, 13-24 September 2021
[5] Koleńczuk et al. (2021) Determination of colour indices of super-fast rotator near-Earth asteroids, EPSC 2021, held virtually, 13-24 September 2021
[6] DeMeo & Carry (2013), Icarus 226, 723
[7] Fowler and Chillemi (1992) Phillips Laboratory, Hanscom AF Base, MA, 17–43
[8] Warner et al. (2009) Icarus 202, 134
How to cite: Koleńczuk, P., Kwiatkowski, T., Kamińska, M., Kamiński, K., Colas, F., Klotz, A., Kim, T., and Birlan, M.: Colours and taxonomy of 2022 AB: a super fast rotating near-Earth asteroid, Europlanet Science Congress 2022, Granada, Spain, 18–23 Sep 2022, EPSC2022-1161, https://doi.org/10.5194/epsc2022-1161, 2022.
There are a large number of small bodies (known as trans-Neptunian objects or TNOs) in the outer solar system that show different types of dynamical behavior. These objects can be considered as "probes" of the dynamical and chemical history of the Solar System. These asteroids or planetezimals are relics of dynamical events among and beyond the giant planets, and the current observed orbital distribution of the TNOs is a sign of large-scale changes in the position of the giant planets. The dynamical classification of the bodies of this outer region of the Solar System helps to understand the structure and formation of the Solar System. In this work, we performed a comprehensive survey on the TNOs. By using the FAIR method considering all known small bodies in outer Solar System (more than 4,000 asteroids classified as TNO in the JPL database), we identified several MMRs between these bodies and the planet Neptune. According to our dynamical investigations, there are two types of resonant behaviour of asteroids; namely, when the critical argument (resonance variable) shows short-term or long-term libration.
How to cite: Forgács-Dajka, E., Kővári, E., Kovács, T., Kiss, C., and Sándor, Z.: Dynamical Investigation of Trans-Neptunian Objects in particular the Mean-Motion Resonances with Neptune, Europlanet Science Congress 2022, Granada, Spain, 18–23 Sep 2022, EPSC2022-1213, https://doi.org/10.5194/epsc2022-1213, 2022.
In a recent research, we carried out a large-scale survey of the trans-Neptunian objects (TNOs) by means of dynamical maps. We identified the most important MMRs and explored their dynamical role through the quantification of the chaotic diffusion and that of the stability times of the small bodies. The chaotic diffusion is of fundamental importance for its rate determines the long-term evolution of a given celestial system. To estimate the rate of the diffusion (that is, to compute the diffusion coefficients) in the case of more than 4100 TNOs, we initiated the use of the Shannon entropy. This latter quantity allows, on the one hand, to measure the extent of unstable regions in the phase space (and thus serves as an indicator of chaos), and also enables the direct measurement of the diffusion coefficients. The characteristic times of stability - in the case of normal diffusion - are then achieved by taking the inverse of the diffusion coefficients. In the knowledge of the chaotic diffusion and stability times for as large a TNO sample as the one indicated above, the overall structure of the trans-Neptunian space can be mapped, along with the specification of dynamical classes or the update of the existing ones.
How to cite: Kővári, E., Forgács-Dajka, E., Kovács, T., Kiss, C., and Sándor, Z.: Chaotic behaviours of different time-scales in the trans-Neptunian space, Europlanet Science Congress 2022, Granada, Spain, 18–23 Sep 2022, EPSC2022-1216, https://doi.org/10.5194/epsc2022-1216, 2022.
SB2 | Small bodies from the active Main Belt to the Oort cloud and beyond
Comets are thought to have preserved dust particles from the very beginning of Solar System formation, providing a unique insight into intricate processes like dust growth mechanisms. The Rosetta mission offered the best opportunity to investigate nearly pristine cometary dust particles of comet 67P/Churyumov–Gerasimenko. In particular, among the three in-situ dust instruments, the MIDAS (Micro-Imaging Dust Analysis System) atomic force microscope collected cometary dust particles with sizes from hundreds of nanometres to tens of micrometres on dedicated targets and recorded their 3D topographic information and related parameters (Bentley et al. 2016a). However, the straightforward dust collection strategy, i.e., simply hitting the collection targets, leads to an unknown degree of collection alteration (Mannel et al. 2016; Bentley et al. 2016b).
We aim to understand dust alteration during collection and determine which structural properties of the MIDAS dust particle remained pristine. An exhaustive dust particle catalogue for MIDAS is created, containing 3494 dust particles with (meta)data. Among these particles, we carefully select 1082 particles that are eligible for a more extensive structural investigation. First, we generate sophisticated dust maps showing the distribution of the selected dust particles on the collection targets and investigate dust clustering, i.e., determination of which of the particles stem from a single parent particle that fragmented upon the collection impact. Additionally, in the collaboration with Longobardo et al. in preparation, we use an algorithm to determine from which cometary source regions which MIDAS particles were stemming (Longobardo et al. 2020). Next, we develop MIDAS particle shape descriptors such as aspect ratio (i.e., height of the particle divided by the square root of area; Lasue et al. 2019), elongation, circularity, convexity, and particle surface/volume distribution. Furthermore, we compare the structure of the MIDAS dust particles and the clusters to those found in the laboratory experiments (Ellerborek et al. 2017) and by COSIMA/Rosetta (Langevin et al. 2016). Finally, we combine our findings to calculate a pristinity score for MIDAS particles and determine the most pristine particles and their properties.
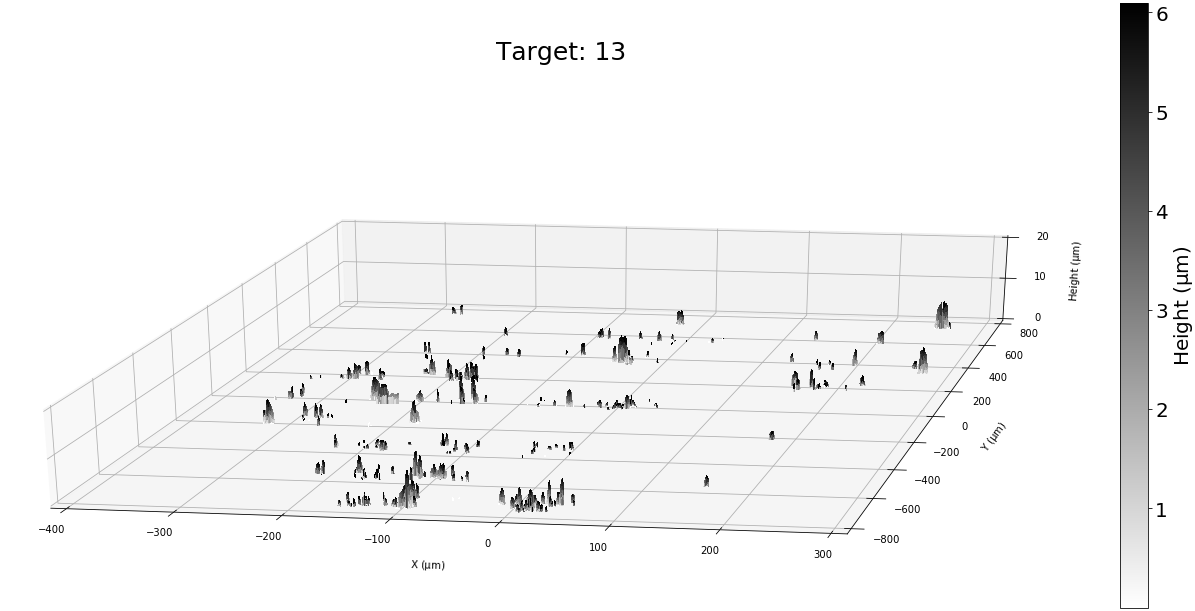
Fig 1. 3D dust coverage map of target 13
We find there is only a weak trend between shape descriptors and cometary source regions, cluster morphology, and particle characteristics such as size and particle morphology. For example, particles ejected from smooth or rough terrain are similar in their investigated shape properties, which implies dust particle activity such as dust ejection, partial dry out, and recycled dust material are not responsible for the structure of particles at the micrometre scale. Furthermore, the aspect ratio distributions suggest that the subunits of different cluster types are similar in their shape and composition. Thus, the different cluster morphologies detected by MIDAS are not created by a change in subunit properties, but rather by different impact velocities, a result in good agreement with the finding of laboratory experiments (Ellerbroek et al. 2017) and simulations (Lasue et al. 2019). Next, the types of clusters found in MIDAS show good agreement (Ellerbroek et al. 2017), however, there are some differences to those found by COSIMA (Lasue et al. 2019). Furthermore, our pristinity score shows that almost half of MIDAS particles suffered severe alteration by impact, which indicates dust alteration was inevitable with the given dust collection strategy. Consequently, only ~ 20 particles were rated 'moderately pristine' particles, i.e., they are not substantially flattened by impact, not fragmented, and/or not part of a fragmentation cluster. The microphysical properties of pristine cometary materials are established in this study and can be translated into properties of laboratory analogue materials for future study to understand comets and early Solar System processes.
How to cite: Kim, M., Mannel, T., Lasue, J., Longobardo, A., Bentely, M., and Moissl, R.: Primitiveness of cometary dust collected by MIDAS on-boardRosetta, Europlanet Science Congress 2022, Granada, Spain, 18–23 Sep 2022, EPSC2022-3, https://doi.org/10.5194/epsc2022-3, 2022.
Comets, thought to be amongst the most primordial of Solar System objects, are distinguished by their activity, i.e. the insolation driven ejection of gas and dust from their surfaces. The exact mechanisms of the outgassing and dust ejection remain an important open question in planetary science, relating as it does to the structure, composition, and thermophysical properties of the surface material. Various thermophysical models (see e.g. [1,2,3]) have been proposed to explain the activity seen by Rosetta at 67P/Churyumov-Gerasimenko, with these often compared to the total outgassing rate. Another directly observable effect of the activity, however, is the resultant non-gravitational force and torque on the cometary nucleus, which can alter its trajectory and rotation state. Understanding the effect of non-gravitational forces on the dynamics of a particular comet therefore gives us a powerful additional tool to investigate its activity and surface properties.
Here we present the latest work in an ongoing project, testing various activity distributions in an effort to fit the combined Rosetta outgassing, trajectory, and rotation data. We test a number of different activity distributions over the surface of the comet by varying the Effective Active Fraction (EAF) of facets on a shape model, relative to a pure water-ice emission. We investigate different spatial patterns in EAF, and attempt to correlate them to physical features on the cometary surface. In addition to the changes in rotation period examined in [4], we also compute changes in the rotation axis, using a method based on [5] in order to compare with the observations. This provides an additional constraint on the spatial distribution of activity. Trajectory information, in the form of Earth-to-comet range, is also compared with a recent re-analysis of Rosetta radio-tracking data [6].
We are able to achieve a reasonable fit to the combined Rosetta data by parameterising EAF in terms of the different geological unit types on 67P (Fig. 1). This will have important implications for understanding how activity works on the different types of surface observed on cometary nuclei, including ‘rough’, ‘smooth’, ‘dusty’ and ‘rocky’ surface morphologies. The objective here is to constrain the shape of the activity curve on these various surfaces that a more detailed thermal model must produce in order to fit the data. We are in the process of implementing these more advanced thermal models [1,3] in our code, and will present results of an analysis of the non-gravitational forces and torques generated by [1].
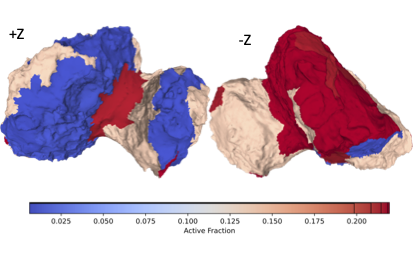
Fig. 1. Peak Effective Active Fraction over the surface of 67P for a model fit to geological unit types.
References
- How comets work. Fulle, M. Blum, J., Rotundi, A., 2019. ApJ Letters, 879:L8 (3pp).
- Near-perihelion activity of comet 67P/Churyumov–Gerasimenko. A first attempt of non-static analysis. Yu. Skorov, H. U. Keller, S. Mottola and P. Hartogh. Monthly Notices of the Royal Astronomical Society, Volume 494, Issue 3, May 2020, Pages 3310–3316
- On the activity of comets: understanding the gas and dust emission from comet 67/Churyumov-Gerasimenko’s south-pole region during perihelion. B. Gundlach, M. Fulle, J. Blum. Monthly Notices of the Royal Astronomical Society, Volume 493, Issue 3, April 2020, Pages 3690–3715
- Constraining models of activity on comet 67P/Churyumov-Gerasimenko with Rosetta trajectory, rotation, and water production measurements. N. Attree, L. Jorda, O. Groussin, S. Mottola, N. Thomas, Y. Brouet, E. Kührt. Astronomy & Astrophysics 630, A18
- Kramer, T., Laeuter, M., Hviid, S., et al. 2019. A&A, Volume 630, id.A3, 11 pp.
- Lasagni Manghi R., Zannoni M., Tortora P., Kueppers M., O'Rourke L., Martin P., Mottola S., et al., 2020, EGU General Assembly 2020, Online, 4–8 May 2020, EGU2020-19173
How to cite: Attree, N., Argawal, J., Jorda, L., Groussin, O., Marschall, R., Lasagni Manghi, R., Tortora, P., and Zannoni, M.: Constraints on comet thermal models from Rosetta at 67P/Churyumov-Gerasimenko, Europlanet Science Congress 2022, Granada, Spain, 18–23 Sep 2022, EPSC2022-5, https://doi.org/10.5194/epsc2022-5, 2022.
Introduction
The ESA Rosetta mission orbited the 67P/Churyumov-Gerasimenko comet (hereafter 67P) for two years and its results are providing important clues to understand activity processes on comets.
The goal of the ISSI International Team “Characterization of 67P cometary activity” is two-fold:
- Retrieval of the activity of different regions of 67P’s surface during different time periods.
- Identification of the main drivers and the effects of cometary activity, via revealing the link between cometary activity and illumination/local time, dust morphology and composition, and surface geomorphology.
Goal #1 has been reached by tracing the motion of dust particles detected in the coma back to the nucleus surface.
Goal #2 accomplishment is in progress by means of data fusion of different instruments onboard the Rosetta spacecraft.
Traceback
The Grain Impact Analyser and Dust Accumulator (GIADA) [1] measured speed and momentum of fluffy and compact dust particles. We assumed radial motion, constant dust acceleration up to a 11 km altitude and constant speed above that height, to retrieve the source region of each dust particle detected in the coma [2]. We obtained that fluffy and compact dust distributions correlate on the surface, but not in the coma due to the different speeds of the two dust categories. Dust ejection is also correlated with solar illumination. Fluffy particles are more abundant in rough terrains [3], according to models which predict that they are embedded within pebbles [4].
Traceback is under study also with a different approach, based on retrieving ejection probability maps of detected dust particles [5].
Data Fusion
GIADA vs VIRTIS. We related dust ejection rates of different surface regions, as retrieved by GIADA, and spectral indicators of water ice exposure measured by the Visible InfraRed Thermal Imaging Spectrometer (VIRTIS) of Rosetta, such as the shortward shift of the 3.2 mm absorption band center and infrared spectral slope flattening [2]. The observed correlation between these parameters (Figure 1) indicates that ejection of dust comes from water ice-rich regions.

Figure 1. Observed correlation between number of fluffy particles ejected from each 67P surface region and observed infrared slope flattening. Each symbol identifies a different geomorphological region of 67P.
GIADA vs MIDAS. The Micro-Imaging Dust Analysis System (MIDAS) detected and measured physical properties of micron-sized particles. In principle, it provides complementary information with respect to GIADA, which detected mm-sized particles.
We retrieved the number of parent particles hitting the MIDAS targets by applying two different methods [7,8]. Independently of the used approach, we obtained that the dust flux ratio between the two instruments is temporally constant. This suggests that the small particles detected by MIDAS are fragments of larger particles, as those detected by GIADA.
The combination of MIDAS data and our traceback algorithm revealed that the physical properties (size, density, flatness) of compact dust are homogeneous across 67P’s surface (Figure 2). Indicators of dust pristinity were defined [8] and suggested that pristinity is correlated with size (being small particles more pristine) but not with the ejecting region evolution degree.

Figure 2. Flatness distribution of dust particles detected on different MIDAS target (each target corresponds to a defined exposition period). Distributions are very similar.
GIADA vs ROSINA. ROSINA-COPS (Rosetta Orbiter Spectrometer for Ion and Neutral Analysis - COmetary Pressure Sensor) detected icy particles as pressure peaks [9]. The GIADA-ROSINA data fusion allows us to associate icy and dust particles and to retrieve the icy particle source regions.
Currently, a moderate correlation between icy and dust fluffy dust particles was found. The work is in progress.
Conclusions and future perspectives
. We found that fluffy dust particles are more abundant on rough terrains, in agreement with their lower evolution degree and to comet formation models. Physical properties of compact dust are similar across the comet surface. The relation between dust and icy particles is under study.
Future activities include:
- Analysis of the COSIMA mass spectrometer data [10], which observed dust composition variations. COSIMA-GIADA data fusion will allow understanding if they are related to different surface terrains.
- Analysis of OSIRIS images, which show bright patches on the comet surface, corresponding to frost enrichments and having different composition and morphology [11]. OSIRIS images combined with GIADA and ROSINA data will help in characterizing these peculiar regions.
- Laboratory activity aimed at simulating and interpreting the different photometric behavior of rough and smooth terrains [12] at the dust scale
References
[1] Della Corte, V. et al. (2014), Journal of Astronomical Instrumentation, 3, 1, 1350011-110; [2] Longobardo, A. et al. (2019), MNRAS, 483, 2, 2165-2176; [3] Longobardo, A. et al. (2020), MNRAS, 496, 1, 125-137; [4] Fulle, M. and Blum, J. (2017), MNRAS, 492, 2, S39-S44; [5] Ivanovski, S.L. et al. (2017), EPSC, 708; [6] Bentley, M.S. et al. (2016), Nature, 537, 7618, 73-75; [7] Longobardo, A. et al. (2020), EPSC, 1044; [8] Kim, M. et al. (2022), EGU abstract; [9] Pestoni, B. et al. (2022), EPSC, this session; [10] Hilchenback, M. et al. (2019), EPSC, 900; [11] Dehapriya, J.D.P. et al. (2018), EPSC, 1166; [12] Longobardo, A. et al. (2017), MNRAS, 469, 2, S346-S356.
Acknowledgements
This research was supported by the Italian Space Agency (ASI) within the ASI-INAF agreement I/032/05/0 and by the International Space Science Institute (ISSI) through the ISSI International Team “Characterization of cometary activity of 67P/Churyumov-Gerasimenko comet”.
M.K. and T.M. acknowledge funding by ESA project "Primitiveness of cometary dust collected by MIDAS on-board Rosetta" (Contract No. 4000129476).
How to cite: Longobardo, A., Kim, M., Pestoni, B., Cottin, H., Guttler, C., Ivanovski, S., Mannel, T., Merouane, S., Rinaldi, G., Rubin, M., Tubiana, C., Zakharov, V., Deshapriya, P., Dirri, F., Ciarniello, M., Della Corte, V., Fulle, M., Palomba, E., and Rotundi, A.: Characterization of 67P/Churyumov-Gerasimenko cometary activity, Europlanet Science Congress 2022, Granada, Spain, 18–23 Sep 2022, EPSC2022-459, https://doi.org/10.5194/epsc2022-459, 2022.
Centaurs are small objects of the Solar System with orbits between Jupiter and Neptune (5.2 AU < q < 30 AU) (Jewitt 2009), being an important population due to the presence of cometary activity (about 13% of Centaurs shows cometary activity) (Bauer et al. 2008). However, after the discovery of ring systems orbiting Chariklo (Braga-Ribas et al. 2013) and Haumea (Ortiz et al. 2017) and the proposition of a ring around Chiron (Ruprecht et al. 2015; Ortiz et al. 2015), we wonder if these structures are common around the small bodies or if specific conditions are necessary for their formation and maintenance (Sicardy et al. 2020). Discovered in March 2000, the active Centaur 174P/Echeclus (60558) has an equivalent diameter estimated in 59 ± 4 km (Bauer et al. 2013) and 64.6 ± 1.6 km (Duffard et al. 2014), and showed cometary activity on different occasions: December 2005 (Choi & Weissman 2006), May 2011 (Jaeger et al. 2011), August 2016 (Miles 2016), and December 2017 Kareta et al. (2019). To determine the main body’s size and shape and investigate whether material ejections during the outbursts could have fed possible rings or a shell of diffuse material around Echeclus, we predicted and observed stellar occultations by this Centaur in 2019, 2020, and 2021.
Stellar occultations by Echeclus were predicted using the Gaia DR2 catalog and NIMA ephemeris (Desmars et al. 2015). The prediction map of the 2019 October 29 event put the shadow’s path over South America, but all the telescopes that participated in this campaign missed the occultation path, providing five negative chords. The 2020 January 22 event is also predicted to pass over South America, resulting in two positive and four negative chords. Finally, we predicted the last event over Japan in 2021 January 19, resulting in one positive and ten negative chords.
With the positive detections of 2020, we fit an ellipse with an equivalent diameter of 59 ± 4 km to the edges of the chords. The resulting ellipse has a semi-major axis a’ = 36 km and oblateness ε′ = 0.325. From the rotational light curves (Rousselot et al., 2021), we note that 2020 stellar occultation occurs near the maximum absolute brightness. Thus, the surface seen during the occultation event was close to the maximum possible. So we were able to compare the ellipse fitted to the chords to the 3D model and pole orientations proposed by (Rousselot et al. 2021). By propagating the Echeclus rotation, we compare the 3D model to the 2021 stellar occultation, where we rule out some of the proposed pole solutions due to the close negative chord. We also fitted the 3D model to the chords, obtaining the triaxial dimensions of Echeclus as a × b × c = 36.5 × 28.0 × 24.5 km, resulting in an area-equivalent diameter of Dequiv = 61.8 ± 0.6 km, which is in agreement with the area-equivalent diameters presented in the literature.
We used all three event data sets to look for sudden drops in flux (evidence of confined material) or shallow and extensive drops (evidence of coma). The best light curves in terms of spatial resolution and SNR were: La Silla/NTT in 2019, which covered about 7,000 km in the sky plane; SOAR in 2020, covering 14,000 km in the sky plane and Okazaki/Japan in 2021, which covered about 9,000 km in the sky plane. With these light curves, we determined lower limits for detection for apparent opacity at the 3σ level as 0.145, 0.189, and 0.258, respectively. In addition, limits for the equivalent width were also determined for these three data sets, with values of 0.19 km for La Silla/NTT, 0.36 km for SOAR, and 0.18 km for Okazaki.
Acknowledgments: C.L.P. is thankful for the support of the CAPES scholarship. The following authors acknowledge the respective CNPq grants: F.B-R 309578/2017-5; J.I.B.C. 308150/2016-3 and 305917/2019-6; F.L.R. CAPES scholarship. This study was financed in part by the Coordenação de Aperfeiçoamento de Pessoal de Nível Superior - Brasil (CAPES) - Finance Code 001 and the National Institute of Science and Technology of the e-Universe project (INCT do e-Universo, CNPq grant 465376/2014-2). ARGJr acknowledges FAPESP grant 2018/11239-8.
References
Bauer, J. M., Choi, Y.-J., Weissman, P. R., et al. 2008, PASP, 120, 393
Bauer, J. M., Grav, T., Blauvelt, E., et al. 2013, The Astrophysical Journal, 773, 22
Braga-Ribas, F., Sicardy, B., Ortiz, J. L., et al. 2013, ApJ, 773, 26
Choi, Y.-J. & Weissman, P. 2006, in AAS/Division for Planetary Sciences Meeting Abstracts, Vol. 38, 37.05
Desmars, J., Camargo, J. I. B., Braga-Ribas, F., et al. 2015, A&A, 584, A96
Duffard, R., Pinilla-Alonso, N., Santos-Sanz, P., et al. 2014, A&A, 564, A92
Jaeger, M., Prosperi, E., Vollmann, W., et al. 2011, IAU Circ., 9213, 2
Jewitt, D. 2009, AJ, 137, 4296
Kareta, T., Sharkey, B., Noonan, J., et al. 2019, AJ, 158, 255
Miles, R. 2016, CBET, 4313
Ortiz, J. L., Duffard, R., Pinilla-Alonso, N., et al. 2015, A&A, 576, A18
Ortiz, J. L., Santos-Sanz, P., Sicardy, B., et al. 2017, Nature, 550, 219
Rousselot, P., Kryszczyńska, A., Bartczak, P., et al. 2021, MNRAS, 507, 3444
Ruprecht, J. D., Bosh, A. S., Person, M. J., et al. 2015, Icarus, 252, 271
Sicardy, B., Renner, S., Leiva, R., et al. 2020, The Trans-Neptunian Solar System, 249
How to cite: Pereira, C. L., Braga-Ribas, F., Emilio, M., Morgado, B. E., Desmars, J., Sicardy, B., Ortiz, J. L., Vieira-Martins, R., Branco, H. C., Assafin, M., Camargo, J. I. B., Gomes-Jr, A., and Rommel, F. L. and the Echeclus team: Recent results of stellar occultations by (60558) Echeclus, Europlanet Science Congress 2022, Granada, Spain, 18–23 Sep 2022, EPSC2022-557, https://doi.org/10.5194/epsc2022-557, 2022.
We report on the results of a long photometry and monitoring of comet C/2017 K2 (PanSTARRS), hereafter 17K2, with the TRAPPIST telescopes [1]. 17K2 is an Oort cloud comet discovered by the Pan-STARRS survey in 2017 [2], at a large heliocentric distance of 16 au. The comet was later identified in archival imagery to be active at 23.8 au from the Sun, the second most distant discovery of an active comet [3]. It has been claimed that 17K2 is a rare CO-rich comet [4]. We started observing 17K2 with TRAPPIST-North on October 25, 2017 using broad-band filters when the comet was at 15 au from the Sun with a magnitude of 18. We started collecting broad and narrow-band images [5] with TRAPPIST-South on September 9, 2021 (rh=5.4 au) when the comet became visible and bright from the southern hemisphere. The comet will reach its perihelion on December 19, 2022 at rh=1.8 au, and we will monitor its activity on both sides of perihelion. As writing this abstract, we detected emission of CN, C2, and C3 radicals as well as the dust continuum in four bands. By fitting the observed gas profiles with Haser model [6] after subtraction of the dust continuum, we derived the gas production rates for a different detected species. From the continuum and broad-bands images, we computed the Afρ parameter, and a dust production proxy [7]. In this work, we will show the magnitude evolution of this comet over 4 years (2017-2022), as well as the gas and dust activity for several months as a function of heliocentric distances.
References
[1] E. Jehin et al. 2011, The Messenger, 145, 2-6.
[2] Kaiser, N., Aussel, H., Burke, B. E., et al. 2002, Proc. SPIE, 4836, 154.
[3] Meech, K. J., Kleyna, J. T., Hainaut, O., et al. 2017, ApJL, 849, L8
[4] Yang, B., Jewitt, D., Zhao, Y., et al. 2021, ApJL, 914, L17
[5] Farnham, T. L., Schleicher, D. G., A’Hearn, M. F. 2000, Icarus, 147, 180
[6] L. Haser. 1957, Bulletin de l’Acad ́emie Royale de Belgique, Vol. 43, 740-750.
[7] Michael F. A’Hearn et al. 1984, The Astronomical Journal, Vol. 89, 579-591.
How to cite: Hmiddouch, S., Jehin, E., Moulane, Y., Jabiri, A., Vander Donckt, M., and Benkhaldoun, Z.: Monitoring the activity and composition of comet C/2017K2 (PanSTARRS) with TRAPPIST telescopes, Europlanet Science Congress 2022, Granada, Spain, 18–23 Sep 2022, EPSC2022-593, https://doi.org/10.5194/epsc2022-593, 2022.
Eris is currently the most massive known dwarf planet in the Solar system, it has one known satellite, Dysnomia (Brown & Schaller 2007; Holler et al. 2020). There have been several attempts trying to identify the rotation period of Eris from visible ground based measurements which resulted in a wide range of possible values (Duffard et al., 2008). Here we present some new light curve data of Eris, taken with ∼1m-class ground based telescopes, with the GROND instrument at the 2.2m MPG/ESO telescope La Silla, and also with the Transiting Exoplanet Survey Satellite (TESS).
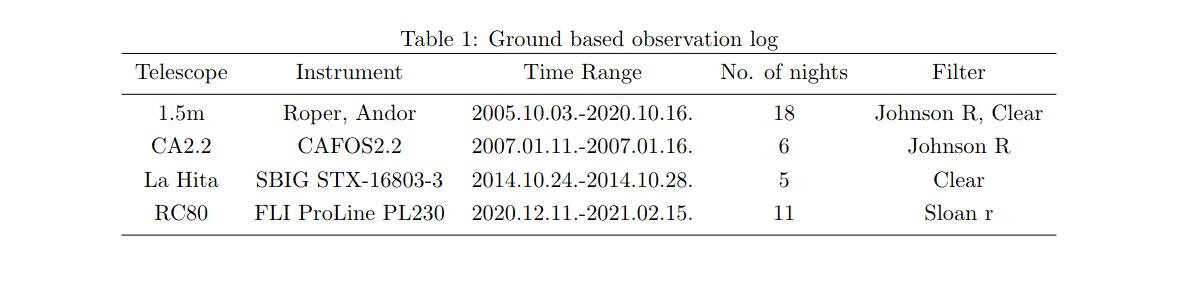
Observations of Eris with GROND were made in 3 nights in August 2010. Auxiliary ground based photometry data of Eris from five telescopes were obtained in irregular intervals between 2005 and 2020 (see table 1.) TESS observed Eris in Sector 30 with its Camera 1 and CCD 3. A significant portion of the light curve data had to be excluded due to Eris’ encounter with nearby background sources which left a dominant feature in the background-subtracted image. We note that due to the limited length of the TESS light blocks (2.3 d and 6.6 d) it was not possible to detect light curve periods in to order or close to the orbital period (15.78 d).
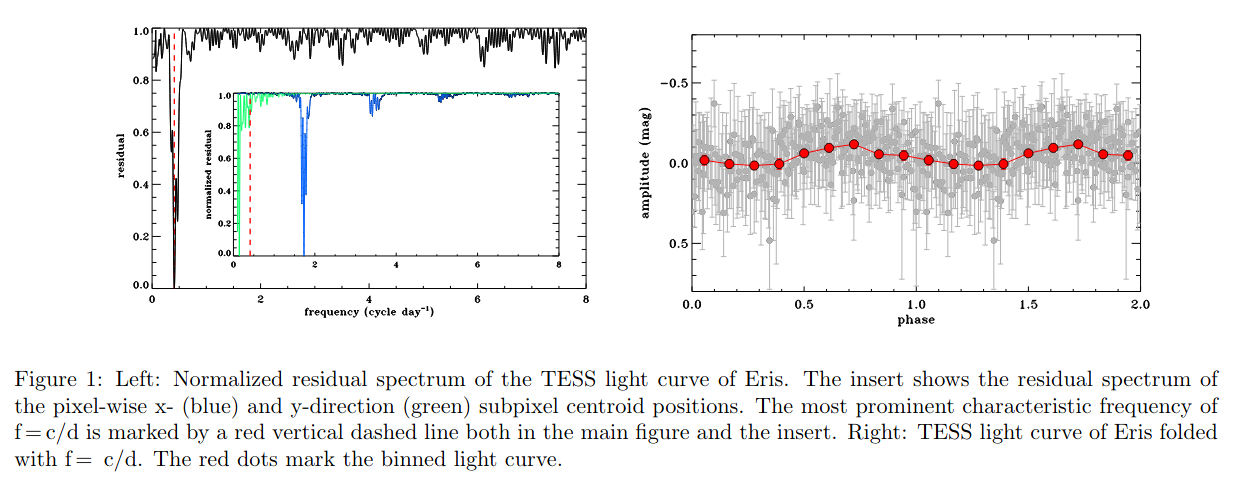
For most of the ground-based measurements we used our night-averaged values for the 1.5m, La Hita and CA2.2m data), except for the GROND measurements, for which we used the all the individual data points. In addition, we also considered previously published data, including ground-based data from Carraro et al., 2006 and Duffard et al., 2008, and the SWIFT satellite data from Roe et al., 2008.
We assumed that i) the light curve amplitude is the same in any of the photometric bands used and ii) the light curve can be described by a simple sinusoidal variation. With these assumptions each model light curve can be described by four parameters: a light curve amplitude, period, phase-shift, and an offset from the photometric zero point. We allowed a different offset for each measurement block even if the data were taken by the same instrument and filter combination (1.5m measurements) due to the year-long gaps between the measurement blocks. We chose an amplitude A and period P, and determined the best fitting light curve phase using a Levenberg–Marquardt minimization algorithm. We expect that the best-fitting period-amplitude values provide the lowest C(P,A) values. We searched the period range P ∈ [1d, 15.88 d], where 15.88 d is the orbital period of Dysnomia, and it would correspond to a synchronised rotation. The C(P,A) contour map shows two minima, one at P ≈ 8 h, and A ≈ 0.05, and another at P ≈ 11.5 h, and A ≈ 0.08. To check the robustness of this result, we repeated the process by modifying the photometric data points by adding a random value with normal distribution and repeating the fitting process several times for the whole data set. The same two minima popped up in all cases. TESS data favours a rotation period of 59.420±0.527 h (See Figure 1.), while ground based data is more compatible with a synchronous or nearly synchronous rotation (See Figure 2.).
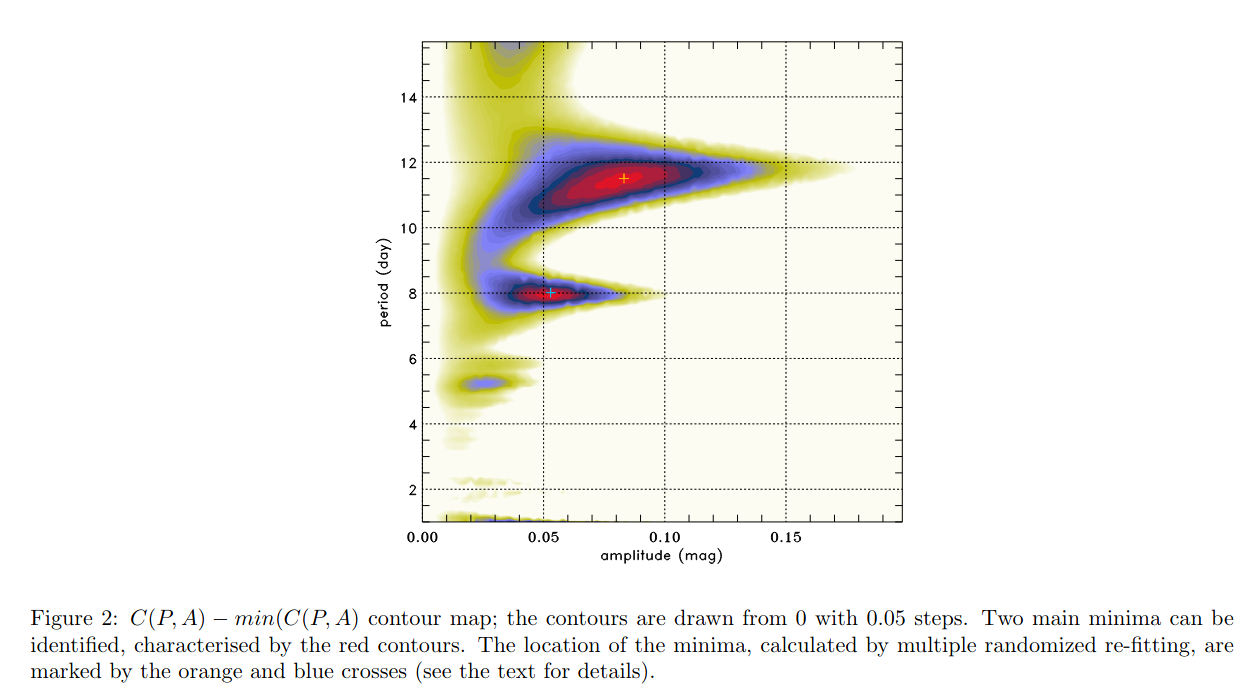
We inspected the colours calculated from the GROND photometry and compared our results to previous values from the literature (Table 2). The optical colours (B-V, V-R, R-I) are in good agreement with previous colours, but the J-H colour from GROND is different from the ones in the literature. Also, we can see a big scatter in those. (See Table 2.)
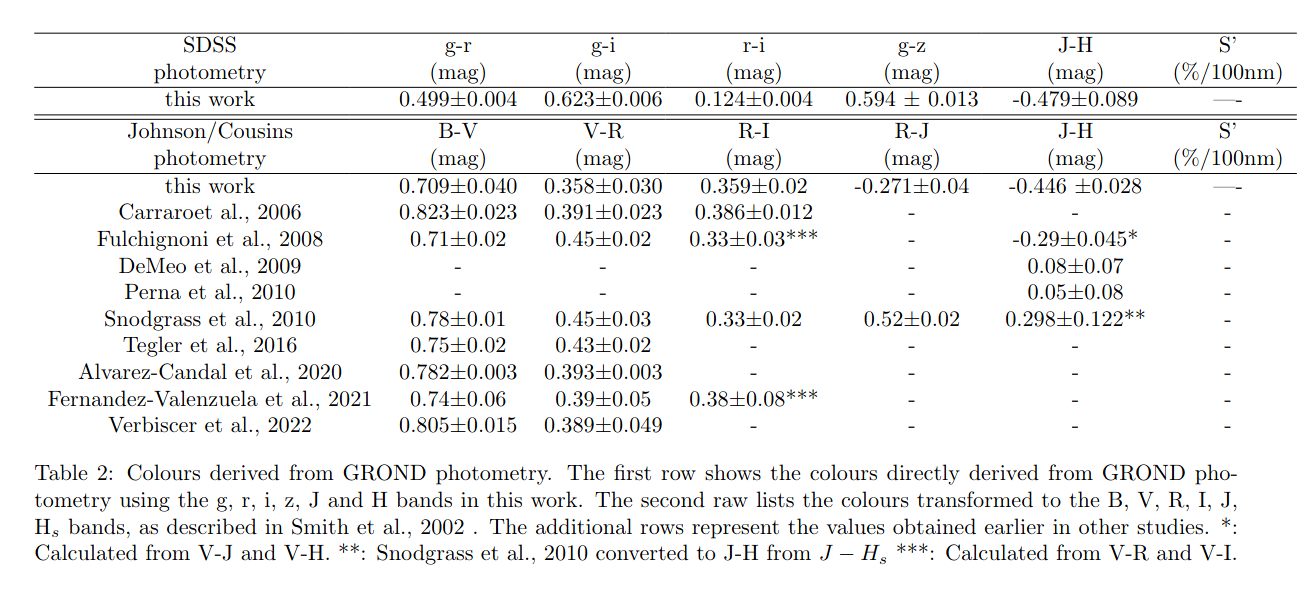
One possible explanation can be, that there is a big CH4 feature on the surface of Eris, which has strong absorption lines in H band, and it can change the NIR colour, but not the optical ones. To confirm this, more long-term optical and NIR measurements are needed. Finally, we use the simple tidal evolution code by Hastings et al. (2016) to calculate the evolution of the satellite orbit (only the semi-major axis in this approximation) and the spin evolution of Eris and Dysnomia. Although the spin period of Eris is not well defined yet, it is an interesting question whether the possible rotation periods of Eris – ranging from a few hours to the orbit-synchronous state – are feasible in terms of tidal evolution, using the current knowledge on the system components.
How to cite: Szakáts, R., Kiss, C., Pál, A., Müller, T., Greiner, J., Santos-Sanz, P., Marton, G., Ortiz, J. L., Morales, N., Duffard, R., and Sági, P.: On the rotation of the dwarf planet (136199) Eris, Europlanet Science Congress 2022, Granada, Spain, 18–23 Sep 2022, EPSC2022-824, https://doi.org/10.5194/epsc2022-824, 2022.
The phase curve of a small Solar System object shows the change in the object’s reflectance at different Sun-object-observer (phase) angles, and the shape of the phase curve is determined by the physical properties of the object’s surface. Analysing phase curves of small Solar System objects such as Kuiper belt objects (KBOs), Centaurs, and inert Jupiter-family comets (JFCs) can also probe the composition and regolith structure of their surfaces, and by comparing these across populations of objects, can reveal possible evolutionary connections between them.
The phase curve of an object can be significantly altered from its nominal shape if the object has undergone epochs of cometary activity during the time across which observations were taken. Furthermore, Centaur activity takes the form of outgassing in between long periods of quiescence, differing significantly from the activity exhibited by JFCs, which is more continuous and strongly coupled to heliocentric distance. As a result, Centaur activity may be difficult to identify from their phase curves if there are large time-intervals between observations. However, if observations are taken at sufficiently high cadence to isolate these outbursts, phase curves can be used to detect and analyse cometary activity out to distances where any coma may not be visible to Earth-based observations. This technique can help shed light on the mechanism responsible for the activity exhibited by Centaurs, which is presently not fully understood, and which is also an important step in understanding cometary evolution in the Solar System.
Obtaining such high cadence observations over multiple apparitions for phase curve analysis is difficult to achieve due to limited availability of telescope observation time, the large baseline of observations required, and the challenges of ground-based observing (poor weather and the limited observability of targets throughout the year). To circumvent these difficulties, many previous studies of phase curves augment their datasets by collating photometry obtained from different sources (Alvarez-Candal et al., 2016; Ayala-Loera et al., 2018; Alvarez-Candal et al., 2019). These additional data are often obtained with heterogeneous methods of image processing and data analysis, which might introduce systematic errors in the resulting phase curve. The Asteroid Terrestrial-impact Last Alert System (ATLAS) survey (Tonry et al., 2018a,b) has accumulated serendipitous observations of several bright KBOs, Centaurs, and JFCs, having observed the visible sky over a 2-day cadence, to a limiting magnitude of ~19.5 in two wide-band filters since it first began observations in 2015. ATLAS offers an opportunity to study the phase curves of these objects populated with large datasets and thus use them to search for epochs of cometary activity.
Using data from the Haleakalā and Mauna Loa telescopes of the ATLAS 4-telescope survey, we analyse the phase curves of the bright KBOs, Centaurs, and JFCs visible to ATLAS with datasets large enough that we do not need to include additional data from potentially heterogeneous sources, thereby reducing potential systematic errors. Our sample of 18 bright KBOs, JFCs and Centaurs visible to ATLAS span semimajor axes of 5.7 au ≤ a ≤ 67.9 au, absolute magnitudes of −1.1 < HV < 13.3. Each object has on average 181 (c-filter) and 463 (o-filter) data points, exceeding the values of previous studies (Rabinowitz et al., 2007; Schaefer et al., 2009; Alvarez-Candal et al., 2016; Ayala-Loera et al., 2018; Alvarez-Candal et al., 2019), and which sample most of the phase angle range observable from Earth.
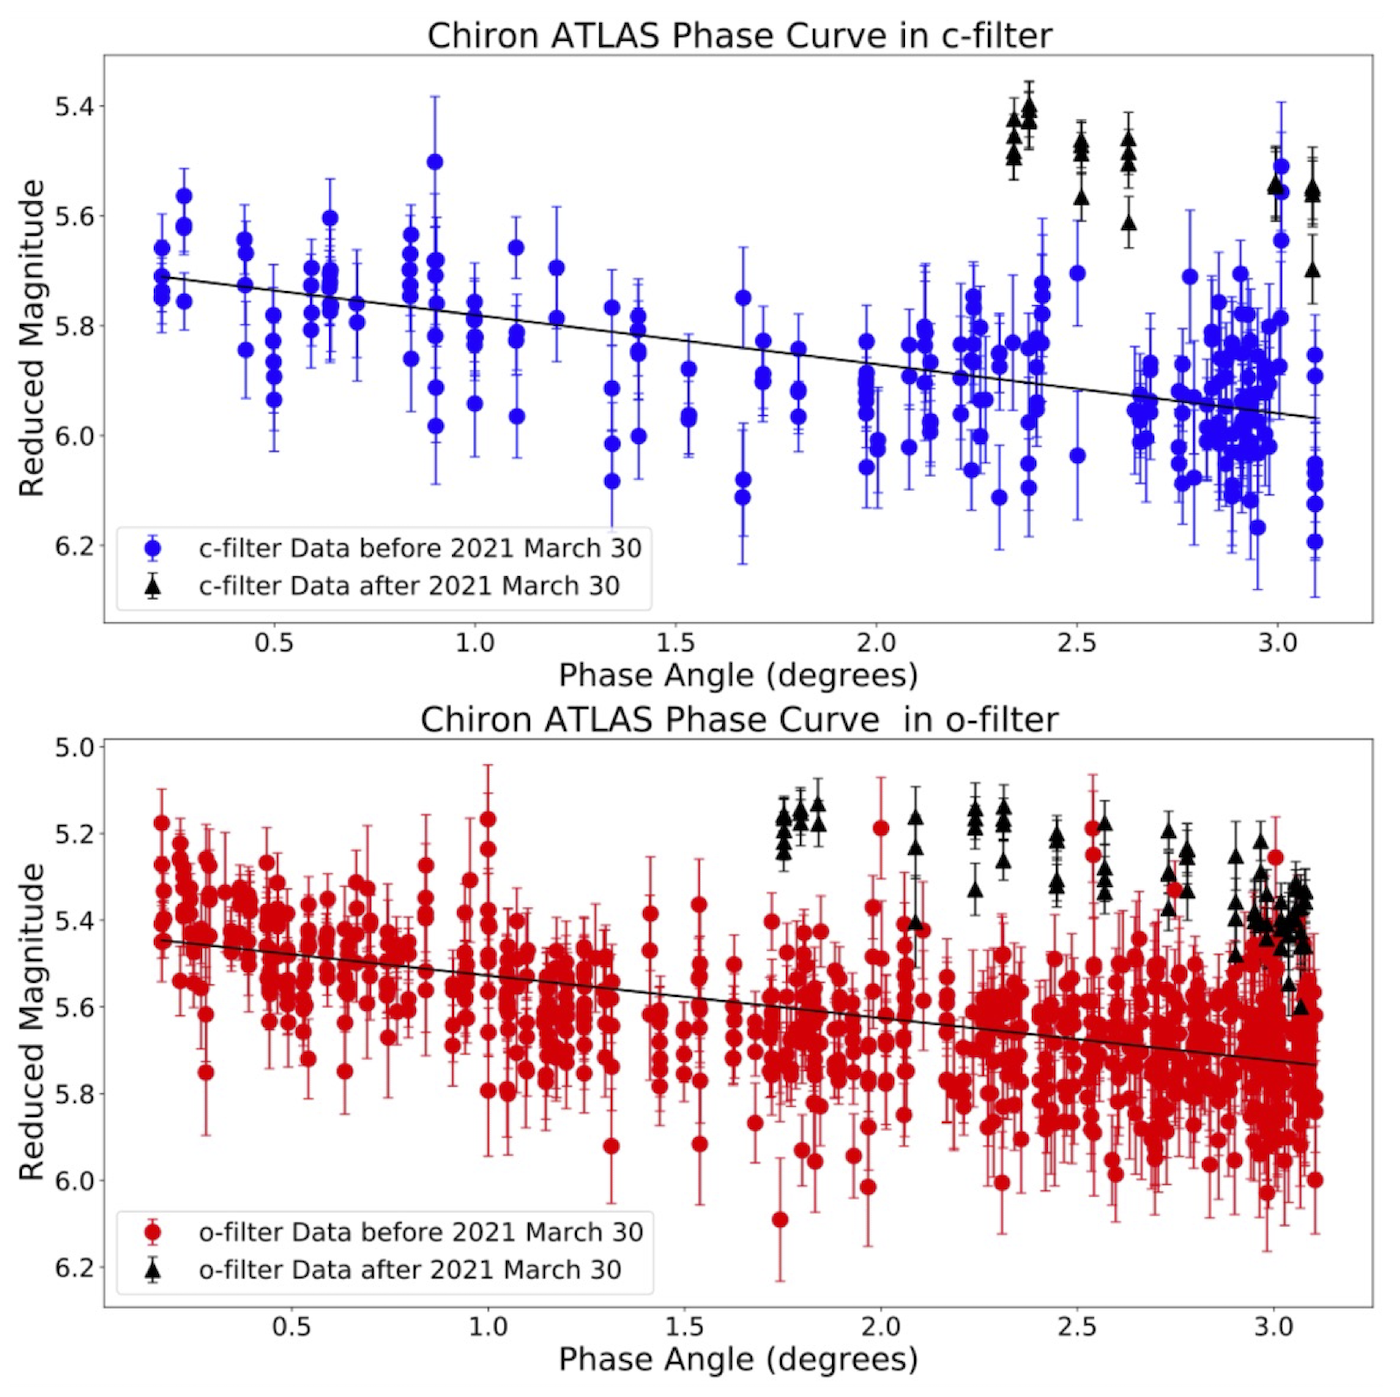
Figure 1: From Dobson et al. (2021), ATLAS Phase Curves of (2060) Chiron in c-filter (upper plot) and o-filter (lower plot), with data from most recent apparition indicated as black triangles. Black lines represent linear best fits to data.
We present our findings on using ATLAS phase curves with their advantage of unprecedentedly large datasets to search for instances of cometary activity exhibited by our sample of KBOs, JFCs and Centaurs since 2015. Notably, we discover a recent brightening of the Centaur (2060) Chiron (Dobson et al. 2021), as seen in Figure 1, which despite the lack of detected coma, is indicative of either an outburst or enhanced activity.
Acknowledgements
We made use of the ATLAS Forced Photometry Server to obtain our Centaur and KBO photometry. https://fallingstar-data.com/forcedphot/
This work has made use of data from the Asteroid Terrestrial-impact Last Alert System (AT- LAS) project. ATLAS is primarily funded to search for near earth asteroids through NASA grants NN12AR55G, 80NSSC18K0284, and 80NSSC18K1575; byproducts of the NEO search include images and catalogs from the survey area. The ATLAS science products have been made possible through the contributions of the University of Hawaii Institute for Astronomy, the Queen’s University Belfast, the Space Telescope Science Institute, the South African Astronomical Observatory (SAAO), and the Millennium Institute of Astrophysics (MAS), Chile.
References
Alvarez-Candal, A., Ayala-Loera, C., Gil-Hutton, R., et al. 2019, MNRAS, 488, 3035, doi: http://doi.org/10.1093/mnras/stz188010.1093/mnras/stz1880
Alvarez-Candal, A., Pinilla-Alonso, N., Ortiz, J. L., et al. 2016, A&A, 586, A155, doi: http://doi.org/10.1051/0004-6361/20152716110.1051/0004-6361/201527161
Ayala-Loera, C., Alvarez-Candal, A., Ortiz, J. L., et al. 2018, MNRAS, 481, 1848, doi: http://doi.org/10.1093/mnras/sty236310.1093/mnras/sty2363
Dobson, M. M., Schwamb, M. E., Fitzsimmons, A., et al. 2021,
Research Notes of the AAS, 5, 9, doi: http://doi.org/10.3847/2515-5172/ac26c9
Rabinowitz, D. L., Schaefer, B. E., & Tourtellotte, S. W. 2007, AJ, 133, 26, doi: http://doi.org/10.1086/50893110.1086/508931
Schaefer, B. E., Rabinowitz, D. L., & Tourtellotte, S. W. 2009, AJ, 137, 129, doi: http://doi.org/10.1088/0004-6256/137/1/12910.1088/0004-6256/137/1/129
Tonry, J. L., Denneau, L., Heinze, A. N., et al. 2018a, , 130, 064505, doi: http://doi.org/10.1088/1538-3873/aabadf10.1088/1538-3873/aabadf
Tonry, J. L., Denneau, L., Flewelling, H., et al. 2018b, ApJ, 867, 105, doi: http://doi.org/10.3847/1538-4357/aae38610.3847/1538-4357/aae386
How to cite: Dobson, M. M., Schwamb, M. E., Benecchi, S. D., Verbiscer, A. J., Fitzsimmons, A., Shingles, L. J., Denneau, L., Heinze, A. N., Smith, K. W., Tonry, J. L., Weiland, H., and Young, D. R.: Using Phase Curves from ATLAS to Search for Cometary Activity in the Solar System, Europlanet Science Congress 2022, Granada, Spain, 18–23 Sep 2022, EPSC2022-878, https://doi.org/10.5194/epsc2022-878, 2022.
The Rosetta mission of the European Space Agency has enabled a deep study of the nucleus and coma of comet 67P/Churyumov-Gerasimenko (hereafter 67P). Four instruments onboard the Rosetta spacecraft sensed coma particles ejected from the nucleus of 67P: the Grain Impact Analyzer and Dust Accumulator (GIADA; Della Corte et al. 2014), the COmetary Secondary Ion Mass Analyser (COSIMA; Kissel et al. 2007), the Micro-Imaging Dust Analysis System (MIDAS; Riedler et al. 2007), and the COmet Pressure Sensor (COPS; Balsiger et al. 2007). GIADA, COSIMA, and MIDAS were developed specifically for the study of cometary dust. COSIMA and MIDAS are sensitive only to refractories, GIADA is sensitive to refractories and (semi-)volatiles. On the other hand COPS is a gas density and pressure sensor that unexpectedly perceived the sublimating volatile fraction of cometary particles (Pestoni et al. 2021a,b). Since COPS measured a different component than the other three instruments, a comparison of the results of the latter is particularly worthy. In this study, we investigate correlations among the particle detections of COPS and GIADA.
The two COPS gauges – the nude gauge (hereafter NG) and the ram gauge (hereafter RG) – detected 6.7e4 and 73 dust particles, respectively. GIADA subsystems led to the identification of 2110 compact particles, 3159 fluffy fragments arose by the fragmentation of 277 parent particles, and 4e-7 kilograms of mass coming from nanogram dust particles (Della Corte et al. 2019). It has been found that NG detections are correlated solely with GIADA parent particles, meaning that fluffy particles have both a volatile and a refractory part. Parent particles are fragmented by the spacecraft potential (Fulle et al. 2015). Consequently, the NG may not have observed intact parent particles, but one or more fluffy fragments reaching COPS remained unresolved within time resolution of the instrument. The diameters of equivalent water ice spheres calculated from the values of the density increases measured by the RG and the NG (60-850 nm assuming a density of 1 g cm−3; Pestoni et al. 2021a,b) are comparable to the sizes of the subunits of the fractal particles detected by MIDAS (52-183 nm; Mannel et al. 2019).
References
Balsiger, H., Altwegg, K., Bochsler, P. et al. 2007, Space Sci. Rev., 128, 745
Della Corte, V. et al. 2014, JAI, 3, 1, 1350011-110
Della Corte, V., Rotundi, A., Zakharov, V., et al. 2019, A&A, 630, A25
Fulle, M., Della Corte, V., Rotundi, A., et al. 2015, ApJ, 802, L12
Kissel, J., Altwegg, K., Clark, B. C., et al. 2007, Space Sci. Rev., 128, 823
Mannel, T., Bentley, M. S., Boakes, P. D., et al. 2019, A&A, 630, A26
Riedler, W., Torkar, K., Jeszenszky, H., et al. 2007, Space Sci. Rev., 128, 869
Pestoni, B., Altwegg, K., Balsiger, H., et al. 2021a, A&A, 645, A38
Pestoni, B., Altwegg, K., Balsiger, H., et al. 2021b, A&A, 651, A26
How to cite: Pestoni, B., Altwegg, K., Della Corte, V., Longobardo, A., Müller, D., Rotundi, A., Rubin, M., and Wampfler, S.: A multi-instrument analysis of 67P/Churyumov-Gerasimenko coma particles: COPS vs. GIADA, Europlanet Science Congress 2022, Granada, Spain, 18–23 Sep 2022, EPSC2022-971, https://doi.org/10.5194/epsc2022-971, 2022.
The long-period comet C/2017 K2 (PanSTARRS) was discovered in 2017 at a large heliocentric distance of 16 au (Wainscoat et al. 2017). Pre-discovery images from 2013 show that K2 was even active at a record distance of ~24 au from the Sun (Jewitt et al. 2017) well beyond the snow line, indicating that, most probably, CO and CO2 ices - the most abundant species after water - might drive its activity. CO was indeed detected in K2’s coma in the sub-mm range at a heliocentric distance of 6.7 au (Yang et al. 2021) and K2 was claimed to be a CO-rich comet.
Detecting comets at such large distances is becoming more frequent, but it is still a rare occasion to study a well preserved comet surface coming directly from the Oort Cloud or on a several million years orbit, and especially if it is of a rare type.
K2 will reach its perihelion on 2022 December 19 (Rh=1.8 au, Δ=2.5 au) and become a bright target in automn with good observing conditions from the Southern hemisphere. We have started an observing campaign on May 8 (Rh=3.2 au), 2022 with UVES at the ESO VLT to obtain high resolution and good SNR optical spectra to characterize the detailed coma composition of its daughter species before and after K2 perihelion. We report here about the first epochs before perihelion.
UVES was setup with a slit width of 0.45" (length of 10") to provide a resolving power of 80.000, and we selected two different settings (DIC#1 346/580 and DIC2 437/860) to cover the whole optical range (304-1040 nm) at each epoch in only two long exposures on the same night. These spectra will allow us to compare K2 - characterized by its unusual distant activity - to other well studied comets in the optical and particularly using the same instrument since 20 years by the Liège comet team. These spectra will allow us to measure the detailed composition of its coma: the production rates of the daughter species (OH, CN, C2 etc.) to check among other things if the comet is a C-chain depleted or normal comet (A'Hearn et al. 1995), to link those production rates with those from the parent species observed in the IR (see CRIRES+ poster by Lippi et al.), to search for CO+ and CO2+ lines to check if K2 is a CO-rich comet like the unique CO-N2-rich blue comet C/2016 R2 (PanSTARRS) (Opitom et al. 2019), to measure the ratio of the [OI] lines to estimate the CO/H2O ratio (Decock et al. 2015), and if the comet is bright enough to measure the isotopic ratios of the light elements (12C/13C and 14N/15N from the CN isotopologues), to measure the ortho- to para- ratio of NH2, and search for faint FeI and NiI lines which are a new and puzzling component of the cometary coma (Manfroid et al. 2021).
How to cite: Jehin, E., Lippi, M., Hutsemékers, D., Manfroid, J., Vander Donckt, M., and Rousselot, P.: Pre-perihelion high resolution optical spectroscopy of the long period comet C/2017 K2 (PanSTARRS) with UVES at the VLT, Europlanet Science Congress 2022, Granada, Spain, 18–23 Sep 2022, EPSC2022-1071, https://doi.org/10.5194/epsc2022-1071, 2022.
The discovery of trans-Neptunian objects (TNOs) marked an important milestone in the understanding of the outer Solar System. Due to their environmental conditions, these objects could preserve the most pristine materials that were present on the protoplanetary disk. Studies focused on understanding TNOs physical and dynamical properties can be used to probe planetary formation processes and the subsequent solar system dynamical evolution that followed the formation era.
Nowadays, above 3,000 TNOs have been detected, including four large ones that receive the official designation of dwarf-planets. Analysis of TNOs revealed a compositionally and dynamically diverse population. However, despite all the progress in the last decades, much is still unknown about the composition of the TNOs.
The recently launched James Webb Space Telescope (launched on December 25, 2021) will provide a powerful tool to investigate the TNOs surface composition, where all prior instrumentation has fallen short. The NIRSpec instrument onboard JWST will provide high-quality data that will surpass the quality of the data available by orders of magnitude. DiSCo-TNOs, lead by the Florida Space Institute, is the only large program approved by JWST for the study of the Solar System. With it, we aim to assess the relative ratio of water ice, complex organics, silicates, and volatiles on the surface of a large sample of TNOs. This information is vital to improving models of the formation of our Solar System and other planetary systems. In this talk we present the scope of the DiSCo program, and the tools that are being developed to extract the maximal information from the data. We pay special attention to the compositional modeling technique that uses an implementation of a nested sampling algorithm for Bayesian inference of the abundances and grain sizes distribution of the materials present on TNOs surfaces.
How to cite: De Pra, M., Pinilla-Alonso, N., Souza Feliciano, A. C., Schambeau, C., Harvison, B., Emery, J., Cruikshank, D., Pendleton, Y., Holler, B., Stansberry, J., Lorenzi, V., Muller, T., Guilbert-Lepoutre, A., Peixinho, N., Bannister, M., and Brunetto, R.: Discovering the Surface Composition of TNOs (DiSCo-TNOs) with the James Webb Space Telescope, Europlanet Science Congress 2022, Granada, Spain, 18–23 Sep 2022, EPSC2022-1196, https://doi.org/10.5194/epsc2022-1196, 2022.
SB4 | Computational astrophysics and numerical models of small bodies and planets
Recent sample-return missions to asteroids (101955) Bennu and (162173) Ryugu have revealed their rough surfaces are strewn with regolith particles ranging from millimeters to tens of meters in diameter with a broad spectrum of shapes. Numerical modelers often simulate these kinds of bodies as rubble piles composed of discrete particles with rock-like material properties. The particles in most models for the past few decades have been independent spheres meant to represent the individual grains that make up the surface and interior of a rubble pile. It has been shown, however, that grain shape has a significant effect on the flow and equilibrium states of particles in granular media. Simulating irregular grain shape is thus imperative for accurately modeling the surfaces and interiors of rubble-pile asteroids.
One of the most challenging aspects of simulations using spherical particles is creating high-porosity media. The densest packing distribution of monodisperse spheres has ~26% porosity; porosities of polydisperse spheres in a randomly packed orientation approach 35-45%. Bennu and Ryugu were each found to have bulk densities on the order of 1.1 g/cc, indicating bulk macroporosities of 50% or larger. Furthermore, the depth to which the arm of the OSIRIS-REx TAGSAM spacecraft penetrated Nightingale crater showed that it met little resistance from the regolith surface of Bennu, which may indicate that the finer-grained parts of regolith surfaces could have porosities larger than the bulk macroporosity. The low bulk densities and high macroporosities of rubble piles that have been visited by spacecraft seem to indicate subsurface structure mainly supported by contact networks between regolith grains strengthened by grain shape and interparticle cohesion from electrostatic and van der Waals forces. These recent results, in combination with historical measurements on the lunar surface, show a need to be more methodical in preparing “fluffy” granular beds to accurately reproduce surface structure on low-gravity, airless bodies.
For our experiments, we use the parallel N-body gravity tree code PKDGRAV. PKDGRAV uses a soft-sphere discrete element method to model surface grains as individual spheres that feel interparticle and uniform gravity, cohesion, and contact forces. The contact forces from the soft-sphere method allow particles to slightly interpenetrate at the point of contact, using a restoring spring force to model the stiffness (akin to the Young’s modulus) of the material and applying normal and tangential damping and forces like interparticle friction. More recently, we have made improvements to routines handling irregularly shaped “aggregate” particles, made by “gluing” together two or more spheres.
Aggregates allow PKDGRAV users to capture geometric effects like bulking, where low-sphericity polyhedra generally occupy larger volumes than spheres when packing, accounting for increased porosity and resistance to flow in granular media. With this in mind, we model the gentle deposition of aggregates under microgravity and lunar gravity to create highly porous (>50% porosity) granular assemblies both with and without cohesion. We use aggregates composed of centimeter-scale spheres and model both symmetric and asymmetric shapes, as well as systems with both aggregates and single spheres. We calculate the porosity of these systems by generating a concave hull around the settled system and calculating the ratio of the total volume in particles interior to the hull to the total hull volume, with interior particle volume modified to account for particle-particle overlaps and particle fractions partially exterior to the hull.
How to cite: DeMartini, J. and Richardson, D.: Modeling High-Porosity Regolith on Low-Gravity Planetary Surfaces, Europlanet Science Congress 2022, Granada, Spain, 18–23 Sep 2022, EPSC2022-560, https://doi.org/10.5194/epsc2022-560, 2022.
Many objects that form via a gravitational collapse or contraction appear to rotate around their own axis (spin) in a manner that aligns with their orbit around larger parent structures. Systematic prograde rotation is found in the planets and larger asteroids of the Solar System [1], in the stars of several open clusters [2], as well as in the molecular clouds of different galaxies [3,4]. Remarkably, the fact that such a spin-orbit alignment exists across different scales has received little scientific attention in the last decades, while a satisfactory answer remains to be found.
Indeed, when the rotational direction of an object is assumed to be equal to that of the cloud from which it formed, only specific birth environments with rising orbital velocity curves lead to systematic prograde spin [5]. We present a new mechanism that describes how collections of particles or clouds gain a prograde rotational component when they collapse or contract while subject to an external, central force. We show that because particles that orbit in any non-rigid cloud shear away from one another over time – and do so on curved paths – their combined center-of-mass moves inward. The orbital angular momentum that is thus liberated, adds a prograde component to the spin of the object that forms.
We first visualize the mechanism of prograde spin-up in Fig. 1a, where we plot the motion of a disk of particles on circular orbits around a central mass. For illustrative purposes, mutual interactions like self-gravity are not included here. Over time, the shear over curved orbits morphs the particles into an increasingly extended arc, whose combined center-of-mass moves inward to an orbit with a reduced semi-major axis. Hence, if the cloud of particles were to gravitationally collapse, the object forms at an orbit interior to the cloud, with a lower orbital angular momentum. The deficit goes into rotation, and the object attains a prograde spin. Being a geometric effect, the mechanism of prograde spin-up persists around any central potential that triggers shear, even those where the shear is strongly retrograde.
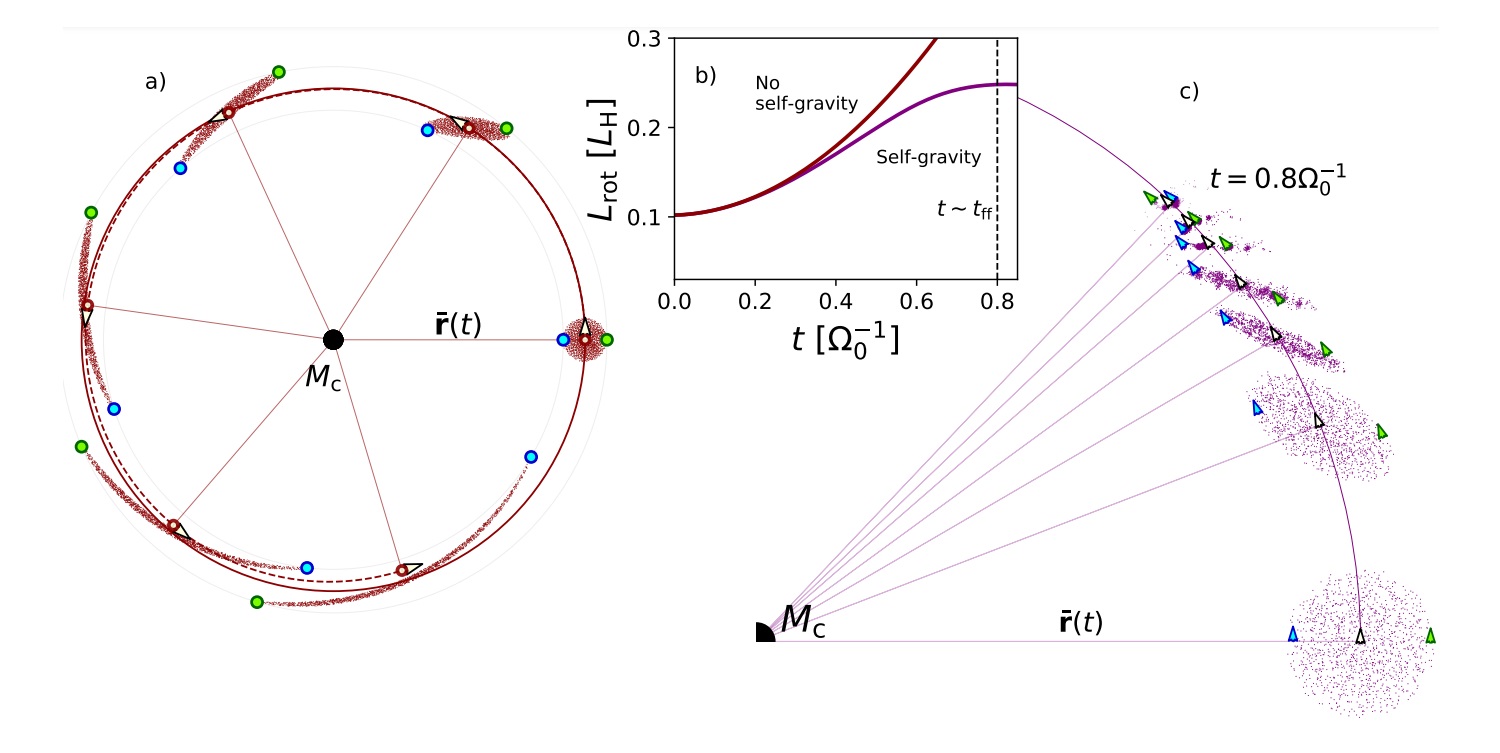
Fig. 1: Visual representation of the prograde spin-up mechanism
To verify this mechanism of prograde spin-up, we perform N-body simulations of gravitationally bound, collapsing clouds with REBOUND [6]. As seen in Fig. 1b, the rotational angular momentum of the cloud increases quadratically during the collapse (δLrot/LH ∝ t2), before slowing down when the collapse completes around t ∼0.8 tff in this example. We provide further visualization in Fig. 1c, where shear is seen to initially deform the cloud into a curved, bar-like structure whose center moves inward, spinning up the material. As the cloud contracts, collisions prevent further relative motion and eventually a stable, prograde binary forms.
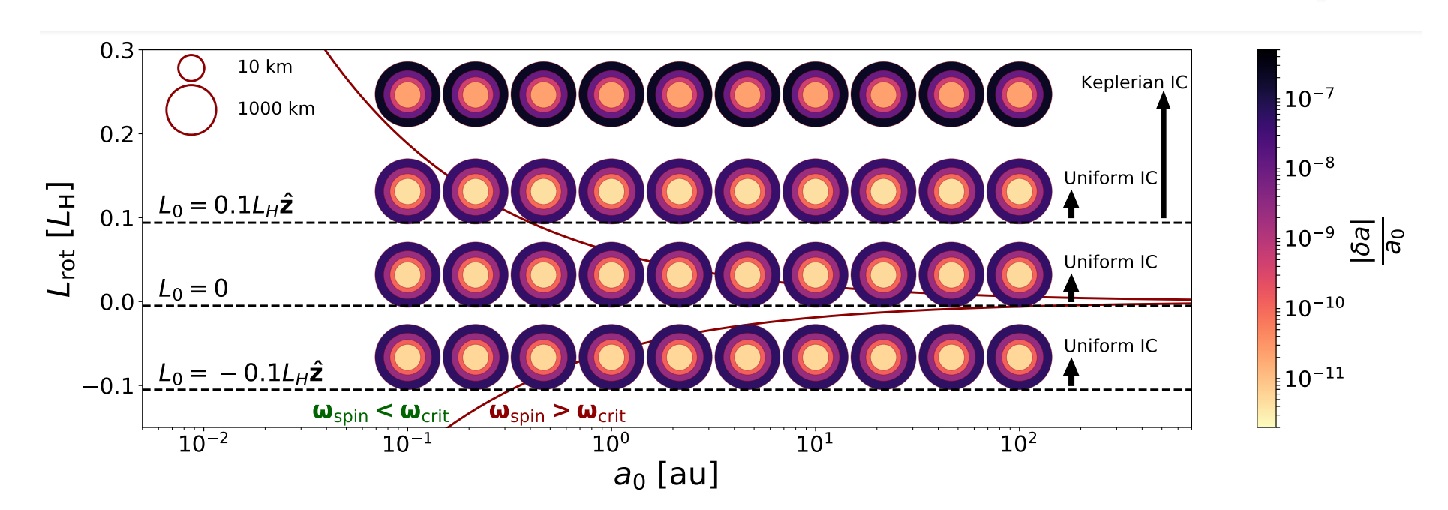
Fig 2: Rotational gain by prograde spin-up in the streaming instability.
We highlight an application of prograde spin-up to the rotation of (binary) asteroids in the Solar System, which are understood to form via gravitational collapse in a process known as the streaming instability [7]. We numerically estimate the magnitude of their spin-up with a set of N-body simulations with varying initial conditions (see Fig. 2). The formation of binaries is easier in the outer Solar System, offering an explanation for the high fraction of binary systems on wider orbits. Indeed, we show that at the distance of the Kuiper belt (∼30 AU), even the clouds that begin their collapse without any rotation can gain enough angular momentum via prograde spin-up to form prograde comet binaries.
Within the Solar System, the group of 'Cold Classicals' that reside in the Kuiper belt provide a unique sample of asteroids that likely retained their rotation at birth [8]. Besides being characterized by low inclinations and eccentricities, this group contains a high fraction of binary pairs [9] that often have strong color correlations [10], reinforcing the idea that they formed in a single gravitational collapse – rather than by later capture. The majority of these binaries spin in a prograde direction, a key signature that has recently been reproduced with detailed hydrodynamical simulations [8,11]. In these simulations, the colatitude distribution of the vorticity vectors is initially broad, and the prograde bias only appears when the bound clumps collapse. We suggest that the new mechanism of prograde spin-up can function as the physical driver of this rotational bias.
The relevance of prograde spin-up to the formation of objects by gravitational collapse on larger astrophysical scales remains open for further investigation. It is likely, however, that the universal applicability of prograde spin-up contributes to the ubiquity of spin-orbit alignment on different scales. The total rotational gain scales with relative cloud size: δLrot/LH ∝(Rcl/RH)5. Compared to the rotation contained in shear: δLrot/LH ∝(Rcl/RH)2, prograde spin-up becomes important when the size of the cloud prior to collapse is comparable to the Hill radius. For objects that form in this interface between self-gravity and shear, prograde spin-up naturally produces a spin-orbit alignment, even in an environment of retrograde shear.
[1] Grundy, W. M., Noll, K. S., Roe, H. G., et al. 2019, Icarus, 334, 62
[2] Corsaro, E., Lee, Y.-N., García, R. A., et al. 2017, Nature Astronomy, 1, 0064
[3] Braine, J., Rosolowsky, E., Gratier, P., Corbelli, E., & Schuster, K. F. 2018, A&A, 612, A51
[4] Braine, J., Hughes, A., Rosolowsky, E., et al. 2020, A&A, 633, A17
[5] Mestel, L. 1966, MNRAS, 131, 307
[6] Rein, H. & Liu, S. F. 2012, A&A, 537, A128
[7] Johansen, A., Youdin, A., & Mac Low, M.-M. 2009, ApJ, 704, L75
[8] Nesvorný, D., Li, R., Simon, J. B., et al. 2021, Planetary Science Journal, 2, 27
[9] Grundy, W. M., Noll, K. S., Roe, H. G., et al. 2019, Icarus, 334, 62
[10] Benecchi, S. D., Noll, K. S., Grundy, W. M., et al. 2009, Icarus, 200, 292
[11] Nesvorný, D., Li, R., Youdin, A. N., Simon, J. B., & Grundy, W. M. 2019, Nature Astronomy, 3, 808
How to cite: Brouwers, M. and Visser, R.: Prograde spin-up during gravitational collapse, Europlanet Science Congress 2022, Granada, Spain, 18–23 Sep 2022, EPSC2022-582, https://doi.org/10.5194/epsc2022-582, 2022.
SB5 | Tools for characterizing planetary and small bodies surfaces, atmospheres, and dust particles (Imagery, photometry, spectroscopy, spectrophotopolarimetry)
Abstract
The comet 17P/Holmes underwent an enormous outburst in October 2007 leaving vast amount of dust particles, which spread into elliptic orbits around the Sun [1, 2]. During February-March 2022 dust trail observations were forecasted to be possible with amateur sized telescope when outburst dust particles were in second revolution orbiting the Sun [1]. Observations were compared to the new dust trail particle model ‘Dust Trail kit’ implemented in Orekit.
1. Introduction
Cometary Dust Trail kit model was developed between 1999-2013 and latest dust trail observations were referenced to model at 2015 [1]. More recent observations were needed to ensure and validate model accuracy and these new observations were part of the announced comet 17P dust trail observation campaign that started in 2013 [1].
2. Observations
2.1 February 26th and 28th 2022
The 17P/Holmes dust trail was observed 26.2.2022 18:26UT and 28.8.2022 18:31UT based to the modeled position reported in [1]. 40 x 90 second exposures were taken at both nights with 305mm aperture telescope and clear filter using CCD bin2 mode and tracking stars. Stacked images were astrometrically plate solved and then subtracted and inverted to highlight the dust trails. Figure 1 shows the dust trails with their positions. The upper dark dust trail was observed on 26.2.2022 and lower light dust trail on 28.2.2022.
2.2 March 1st and 2nd 2022
The 17P/Holmes dust trail was observed on 1.3.2022 18:25UT and 2.3.2022 18:35UT based to the model position. CCD bin3 mode was used to get more sensitivity with exposure times 50 x 45 second at both nights. Images were then stacked, plate solved and subtracted. Figure 2 shows dust trails with positions, the upper dark dust trail is an observation made on 1.3.2022 and the lower light dust trail on 2.3.2022.
3. Comparison to the model
Observations 2.1 and 2.2 were compared with the results of the ‘Dust Trail kit’ model implemented in Orekit by Markku Nissinen. Figure 3 show a good correlation between the model calculations and the four observations.
4. Equipment and software
4.1 Equipment
The telescope used was 305mm aperture and 1205mm focal length F4 Newton with coma corrector. Mount was iOptron CEM60 and autoguider was configured to track stars during each exposure. The telescope was placed in Viestikallio Remote Controlled Observatory at Artjärvi, Finland under Bortle 3 rural sky conditions.
CCD-camera was cooled QSI690wsg having Sony ICX814 CCD-sensor. Exposures 90s and 45s were used with CCD binning 2x2 and 3x3, giving 1.3 and 1.9 arcsec/px resolution. Baader Clear filter was used.
4.2 Software
Image processing software used was PixInsight (PI), images were registered and stacked with PI Star registration and PI Integration functionality. PI PixelMath was used in image subtraction.
ASTAP software was used for plate solving and astrometric analysis.
5. Figures
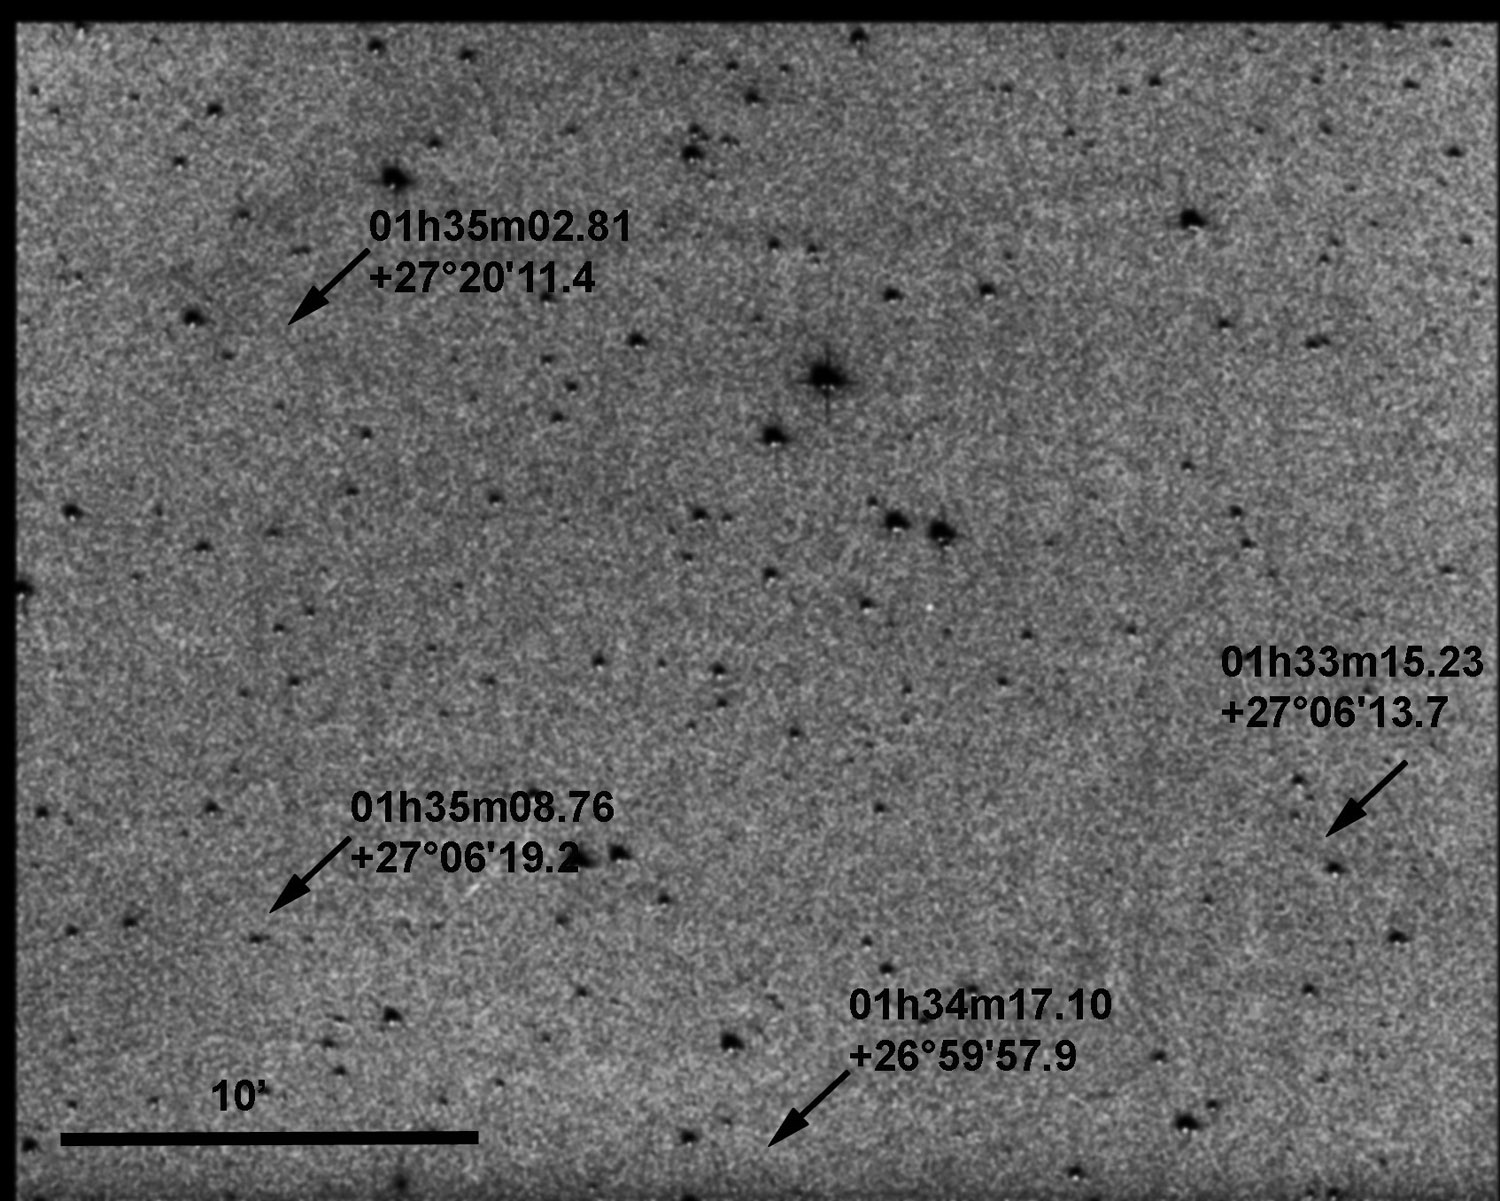
Figure 1: Subtracted image of 17P/Holmes dust trails with measured positions, upper dust trail 28.2.2022, lower trail 26.2.2022, Jorma Ryske. Observations separation is 48 hours.
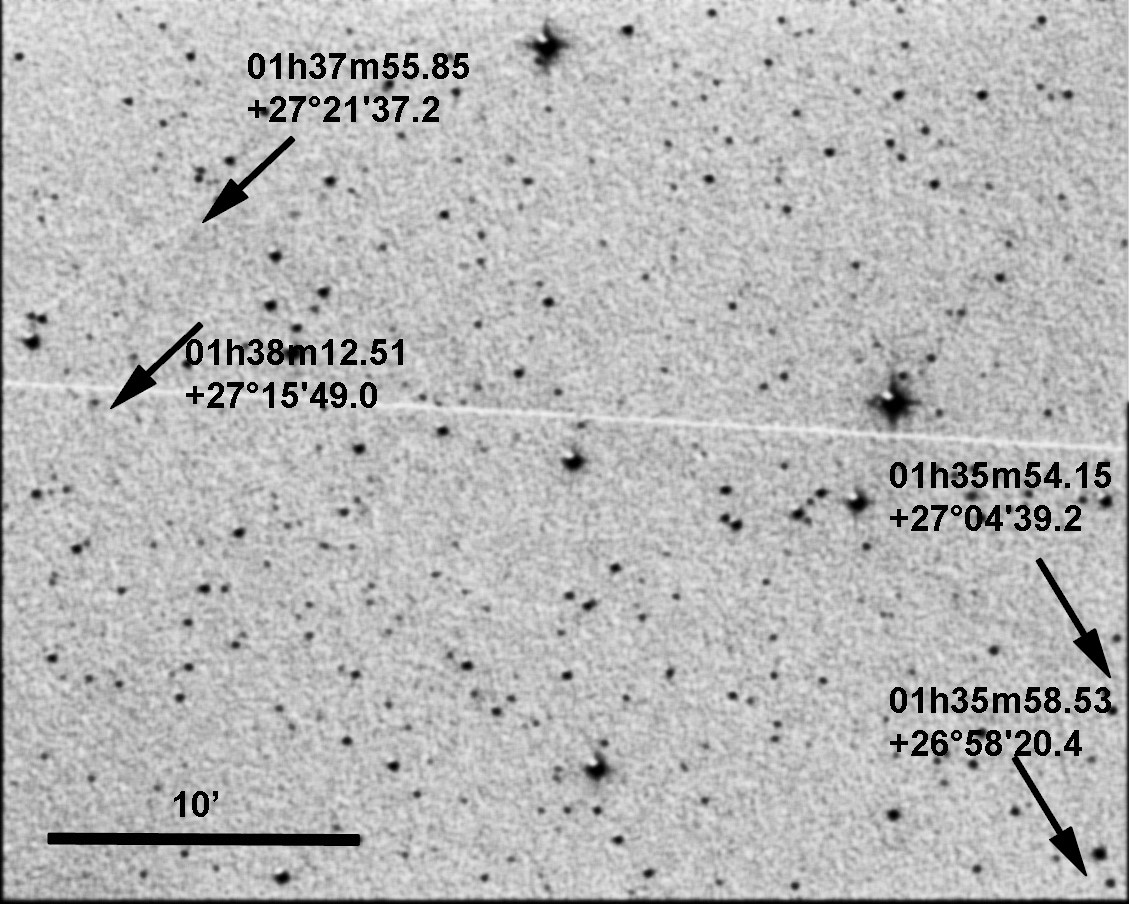
Figure 2: Subtracted image of 17P/Holmes dust trails with measured positions, upper dark dust trail 1.3.2022, lower light dust trail 2.3.2022, Jorma Ryske. Observations separation is 24 hours. Two satellite tracks in image.
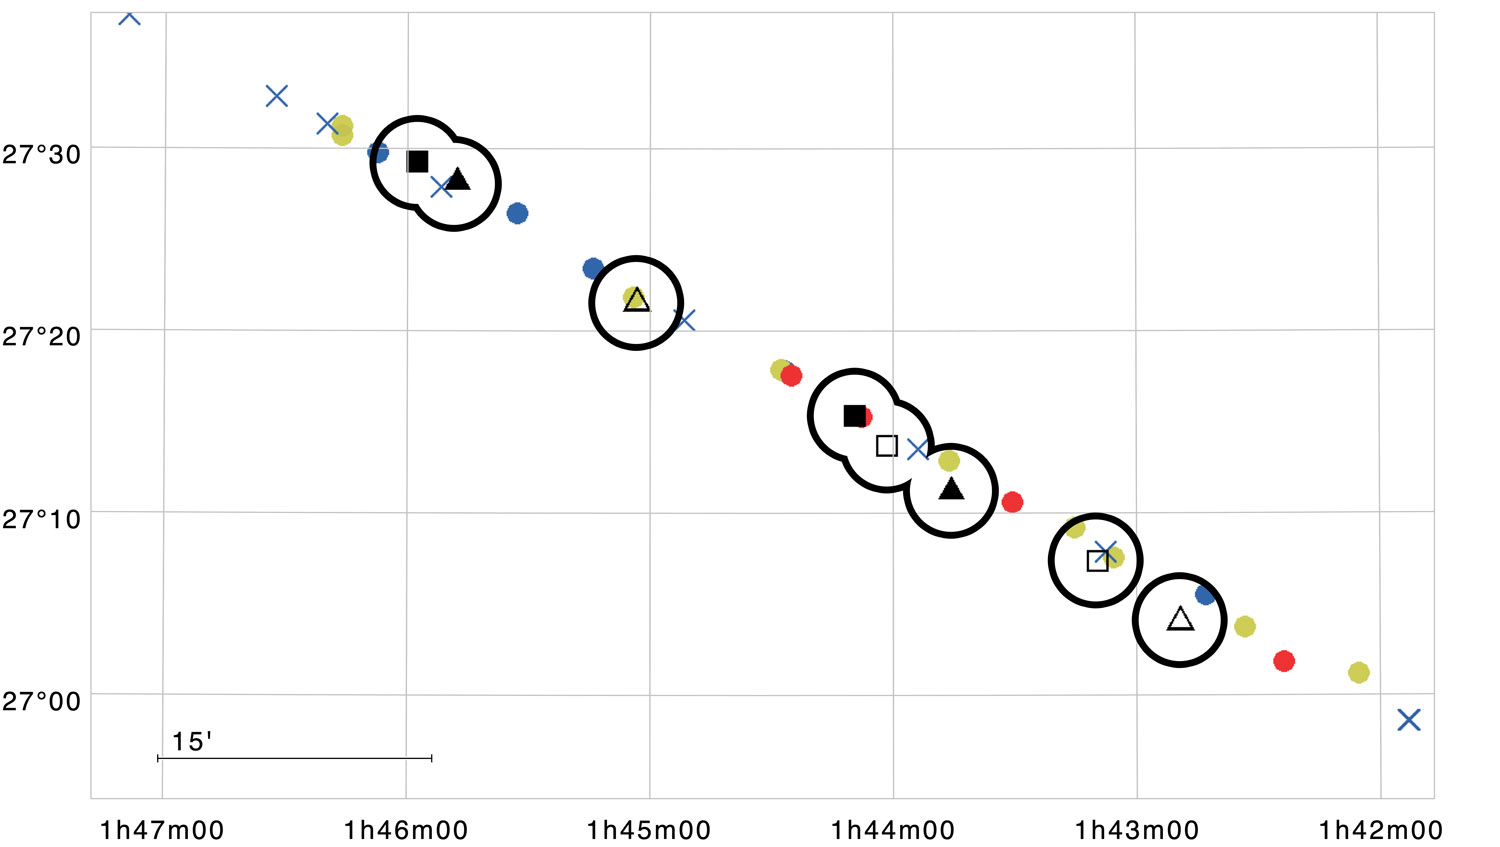
Figure 3: 17P Dust Trail kit model positions (markers with no circles as small, medium, big and toward the Sun particles) [1] and observations positions (square and triangle markers with circles) for dates 26.2. & 28.2.2022 and 1.3. & 2.3.2022. The X-axis shows RA and the Y-axis DEC. Model calculations M. Nissinen, M. Gritsevich, observations J. Ryske.
6. Summary and Conclusions
The particles released by the comet 17P/Holmes during the 2007 outburst formed a dust trail which is still possible to observe with relatively small aperture amateur sized telescopes using modern CCD-camera and image processing technology giving useful research data by amateur astronomers. Observations ensure that the developed dust particle model is producing the realistic results and can be used to forecast dynamics of meteoroid streams.
Acknowledgements
Special thanks to Arto Oksanen, Jyväskylän Sirius ry, image verification and Harry Lehto, University of Turku, image photometric guidance.
References
[1] Evolution of the Dust Trail of Comet 17P/Holmes, Maria Gritsevich, Markku Nissinen, Arto Oksanen, Jari Suomela, Elizabeth A. Silber. MNRAS Monthly Notices of the Royal Astronomical Society, 513(2), pp. 2201–2214, https://doi.org/10.1093/mnras/stac822
[2] Dust Trail Observations of Comet 17P/Holmes and Predictions for 2021-2022, Nissinen, Markku; Gritsevich, Maria; Oksanen, Arto; Suomela, Jari. Europlanet Science Congress 2021, EPSC2021-86.
How to cite: Ryske, J., Gritsevich, M., and Nissinen, M.: Validation of the Dust Trail kit model with the recent observations of the comet 17P/Holmes dust trail (February –March 2022), Europlanet Science Congress 2022, Granada, Spain, 18–23 Sep 2022, EPSC2022-60, https://doi.org/10.5194/epsc2022-60, 2022.
We present our preliminary results of searching for short-term variations of four long-period comets C/2016 M1 (PANSTARRS), C/2015 O1 (PANSTARRS), C/2014 W2 (PANSTARRS), C/2016 N4 (MASTER), and a hyperbolic comet C/2021 A1 (Leonard). All the comets reveal red color of their dust coma with slight variations, i.e., without changes of the color to blue or neutral. The observed dust productivity of the comets is quite high. Dust production respects to measurements of other long-period comets at the similar heliocentric distances. Comet C/2021 A1 (Leonard) was significantly redder comparing with the other comets and possessed weaker activity.
Introduction
In our research, we are looking for rapid variations of photometric color of comets at heliocentric distances beyond 3 au. The color reflects mainly the size distribution and also depends on the composition of dust particles (1; 2).
Variations of photometric color can be observed when we change the aperture size. It can be explained by differences in sizes and/or compositions of particles on different cometocentric distances, which can be caused by sublimation and/or fragmentation of dust particles (3; 4). On the second hand, except variations with the aperture size, the color was believed to be a constant characteristic of a cometary coma, but further studies have demonstrated changes of color during a long time (5; 6; 7). Furthermore, recent studies reveal much shorter variations of photometric color, i.e. days or months, which can be induced by changes of dust properties (3; 8; 9).
We analyze monitoring observations of 4 comets with highly eccentric elliptical orbits and a hyperbolic comet in order to find rapid color variations.
Observations
Observations of the comets were taken at the Skalnaté Pleso observatory (IAU Code – 056) using the 61-cm telescope. As CCD detector the FLI PL-230 camera have been taken. The pixel size of the camera is 15 µm, the field of view of 40.3 arcmin×40.6 arcmin, and the pixel scale was 1.18 arcsec/px. the Bessel B, V, R broadband filters were used. Images were taken without binning. During observations of comet C/2021 A1 (Leonard) in 2021 the telescope was equipped with the SBIG ST-10XME Dual CCD camera, having a pixel size of 6.8 µm, the field of view of 19.5 arcmin×13.1 arcmin and the pixel scale is 1.07 arcsec/px. We used a 2×2 binning mode. R and V filters of the Johnson-Cousins photometric system were used.
The reduction procedure (bias subtraction, dark and flat field corrections, and cleaning cosmic-ray tracks) was performed in in the standard manner, using the IDL routines (10; 8; 11). We used only photometric nights for analysis.
Results
At heliocentric distances bigger than 3 au, where the comets were observed, the coma is mostly formed by the sublimation of more volatile species, e.g., CO/CO2. Furthermore, at such distances gaseous emissions of daughter molecules are rarely observed in the optical region (12). Therefore, we assume that the observations obtained with the broadband filters allow us to study features of a dust coma.
We have not found significant variations of color from red to blue or neutral (or vice versa) in the selected comets. All the comets possessed red color of the dust coma with slight variations. Dust production of most long-period comets is similar to other comets of these family and is significantly bigger than for the Jupiter family comets. Only comet C/2016 N4 (PANSTARRS) has possessed lower activity.
Color of hyperbolic comet C/2021 A1 (Leonard) was usually bigger than for the other sampled comets, but dust production was on contrary smaller.
Acknowledgments
Our work was supported by the Slovak Grant Agency for Science VEGA No. 2/0059/22. Also, we were supported by the Slovak Research and Development Agency under the Contract no. APVV-19-0072.
References
1. Sen, A. K., et al. The effect of porosity of dust particles on polarization and color with special reference to comets. Journal of Quantitative Spectroscopy and Radiative Transfer. 2017, Vol. 198, pp. 164 - 178.
2. Jewitt, D. The active Centaurs. The Astronomical Journal. 2009, Vol. 137, 5, pp. 4296 - 4312.
3. Betzler, A. S., et al. An analysis of the BVRI colors of 22 active comets. Advances in Space Research. 2017, Vol. 60, pp. 612 - 625.
4. Farnham, T. L. Coma morphology of Jupiter-family comets. Planetary and Space Science. 2009, Vol. 57, pp. 1192-1217.
5. Jewitt, D. and Meech, K. J. Cometary Grain Scattering versus Wavelength, or, "What Color is Comet Dust?". Astrophysical Journal. 1986, Vol. 310, p. 937.
6. Li., J.-Y., et al. Constraining the Dust Coma Properties of Comet C/Siding Spring (2013 a1) at Large Heliocentric Distances. The Astronomical Journal Letters. 2014, Vol. 797, 1, p. 7.
7. Weiler, M., et al. The dust activity of comet C/1995 O1 (Hale-Bopp) between 3 AU and 13 AU from the Sun. Astronomy&Astrophysics. 2003, Vol. 403, pp. 313 - 322.
8. Ivanova, O., et al. Colour variations of Comet C/2013 UQ4 (Catalina). Monthly Notices of the Royal Astronomical Society. 2017, Vol. 469, 3, pp. 2695-2703.
9. Luk`yanyk, I., et al. Rapid variations of dust colour in comet 41P/Tuttle–Giacobini–Kresák. Monthly Notices of the Royal Astronomical Society. 2019, Vol. 485, 3, pp. 4013-4023.
10. Ivanova, O. V., et al. Photometric and spectroscopic analysis of comet 29P/Schwassmann-Wachmann 1 activity. Planetary and Space Science. 2016, Vol. 121, pp. 10-17.
11. Picazzio, E., et al. Comet 29P/Schwassmann-Wachmann 1 dust environment from. Icarus. 2019, Vol. 319, pp. 58-67.
12. Kulyk, I., et al. Physical activity of the selected nearly isotropic comets with perihelia at large heliocentric distance. Astronomy&Astrophysics. 2018, Vol. 611, p. A32.
How to cite: Voitko, A. and Ivanova, O.: Search for short-term color variations of five distant comets, Europlanet Science Congress 2022, Granada, Spain, 18–23 Sep 2022, EPSC2022-218, https://doi.org/10.5194/epsc2022-218, 2022.
Planetary community knows Ukraine as a country that has a prominent history of polarimetric studies of Solar system objects. Ukrainian planetary polarimetry has been counting since 1926 when academician M. Barabashov (Kharkiv) observed polarization of the Moon. It got a significant impetus in late 1950th since then concentrating in Kharkiv, Kyiv, and Crimea, and gradually moving its focus from polarimetric studies of Mars and Venus to comets and asteroids, at the same time keeping the leading role in the lunar polarimetry. In parallel with building polarimetric instrumentation and observing, Ukrainian polarimetric school also has had notable achievements in theory, specifically in studies of planetary and cometary atmospheres and surfaces of the Moon and asteroids, and in laboratory studies of light scattering by particulate surfaces. The devastating events of this year made it impossible for the Ukrainian polarimetrists to participate in the EPSC meeting. This poster intends to compensate for their absence by describing the history of the Ukrainian Polarimetric School and reminding the planetary community about leading Ukrainian polarimetrists and their contribution to the polarimetry of small bodies.
How to cite: Kolokolova, L., Sosonkin, M., and Levasseur-Regourd, A.-C.: Ukrainian School of Planetary Polarimetry, Europlanet Science Congress 2022, Granada, Spain, 18–23 Sep 2022, EPSC2022-263, https://doi.org/10.5194/epsc2022-263, 2022.
Background: Spectral observations in visual and near-infrared wavelengths are used to infer their surface material composition. Similar laboratory measurements of meteorites and various minerals and are used to link the known composition in laboratory measurements to asteroid composition.
However, many parameters in observations and measurements can introduce effects on the resulting spectra. With regolith-type powdered grains packed to a slab, the observing angles, particle size distribution, particle shapes, and space-weathering state of the material can all alter the spectra. Here, we try to model the particle size effects so that at least this effect could be understood when comparing different spectra.
Size effects in spectra: One can find spectral measurements of the same material but with varying size fractions in spectral databases such as RELAB (https://pds-speclib.rsl.wustl.edu/) and SSHADE (https://www.sshade.eu/). The typical spectral effects of different particle size are that the smaller particles are generally brighter, have redder slope, and deeper (absolute) absorption band depths. However, it is also possible to find counterexamples of different behavior.
Trend from light-scattering theory: If we limit to optically large particles (several times larger than the wavelength) and assume that different particle sizes are simply scaled versions of one particle, the particle size effects in spectra can be understood as interplay between surface reflections and absorption in the volume. If we assume that the surfaces are flat in the wavelength-scale, the surface reflections follow Fresnel reflections. For light that is refracted from the surface into the homogeneous material, the Beer-Lambert absorption gives the attenuation in the volume.
The Fresnel-type reflections do not absorb and are also only weakly dependent on the imaginary part k of the complex refractive index of the material, m=n+ik. The Beer-Lambert absorption, on the other hand, is only dependent on k and the distance traveled in the material, d. If the same volume is divided into smaller particles, typical d in the material between air-surface or surface-air interfaces and reflections or refractions from these is decreasing. Since absorption is taking place only in the volume, the increased surface reflections are increasing the brightness. This is the simple mechanism behind increasing brightness with decreasing particle size. At the same time, the exponent-term in the Beer-Lambert absorption affects so that similar change in d in the particle for a bright material has larger effect than the same d in darker material. This means that the absorption band depths are also increasing, in absolute units, when particle size is decreasing.
The possible increase of red slope with decreasing particle size in spectra cannot be explained with optically large particles. The longer wavelengths are ‘seeing’ the distances inside the particles shorter, but the effect is quite small for particles that are several times larger than the wavelength. However, if the sample also includes wavelength-scale particles, these are relatively more abundant in smaller size fractions and can introduce a red slope. This is because the scattering efficiency of particles increase when they reach wavelength-scale whereas for optically large particles it is constant.
Numerical modeling: We will verify and quantify the abovementioned theoretical trends with numerical simulations. We use a two-fold scheme where we first simulate the single-scattering properties (single-scattering albedo and the phase function) of individual random particle shapes, and then simulate the multiple-scattering effect in a packed slab of these particles.
We model the particles with a Voronoi cell particle model, see Fig. 1. In this model, a large volume is first filled with random seed points. Then, a 3d Voronoi division is done on the points, resulting the volume to be divided into Voronoi cells having flat surfaces and sharp corners. Finally, single cells are extracted from the volume, except the cells close to the edge of the volume to avoid edge-effects.

The light-scattering properties of single Voronoi particles are computed using a geometric-optics ray-tracing code SIRIS (https://bitbucket.org/planetarysystemresearch/siris4-framework/). These computations are run for 200 realizations of the particle model and changing the size parameter (physical size divided by the wavelength) and the real and imaginary parts of the refractive index. The results are averaged over the particle shape realizations.
The single-particle properties are fed into the Monte Carlo radiative transfer code RT-CB (https://bitbucket.org/planetarysystemresearch/rtcb_public/) where the amount of reflected light from a large slab containing the single particles is computed. This gives us the brightness as a function of particle size, wavelength, and real and imaginary parts of the refractive index.
Preliminary results: We have a grid of size parameters and refractive indices computed, and the results are consistent with what we expected from the simple theory of the changing ratio of surface reflections to volume absorption. We can, for example, plug in a typical behavior of the imaginary part of olivine as a function of wavelength, keep the real part of the refractive index constant for simplicity (it does not change much in visual/near-infrared wavelengths), and plot the spectra of different-sized olivine particles, see Fig. 2.

Conclusions and future work: Currently, we are increasing the parameter grid to include both smaller size parameters and smaller imaginary k values. From the results we have, it seems that we can fit an analytical function to the results with quite small prediction errors. If successful, this analytical model can be used to model the size effect on the reflectance spectra of particulate materials if the particles are clearly larger than the wavelength. If we can model, we can also remove the effect if we know the particle sizes and receive size-standardized spectra that can be better compared between the samples.
As a side product, we can use this data and the model to invert the imaginary part of the refractive index for materials from which we have reflectance spectra measurements and the particle size.
How to cite: Penttilä, A., Martikainen, J., and Muinonen, K.: Modeling the effect of particle size distribution on spectra for optically large particles, Europlanet Science Congress 2022, Granada, Spain, 18–23 Sep 2022, EPSC2022-415, https://doi.org/10.5194/epsc2022-415, 2022.
Introduction: DART mission will be the first to undertake an orbital deflection experiment against a Near-Earth Asteroid. The smallest member of the binary Didymos-Dimorphos system will be impacted by the 660-kg spacecraft at the velocity of 6.6 km/s, leading the orbital period to change in return. The expected baseline kinetic energy is 9.7 GJ [1], about half the input energy of Deep Impact[2], and >10^5 kg of mass is to be released [3].
The impact will produce an ejecta plume, lasting for several minutes [3], that will be observed by ASI/LICIACube camera up to about 4 m/px resolution [4,5] and phase angles ranging from 45 to 120 deg. The plume is therefore expected to be resolved during several frames and its phase function studied in order to retrieve properties such as albedo, grain size frequency distribution and optical depth. Therefore, we put forth a light scattering model that relies on previous knowledge about the Dydimos binary system composition [6] and the Deep Impact event [7].
LICIACube Observations: The Light Italian Cubesat For Imaging Asteroids is a 6C Cubesat hosted by DART spacecraft. LICIACube will detach from DART spacecraft 10 days from the nominal impact date of 26th September 2022 to start the trajectory correction to be positioned in fly-by mode. LICIACube payload holds two optical cameras, LUKE and LEIA, designed for color imaging studies [5]. At 167 sec after the impact, the Italian Cubesat will reach the closest approach and obtain the highest resolution images from the binary system.
Methodology: grain size range. To provide support and analyze the broad grain’s size distribution range expected in the plume, we relied two numerical codes covering two different size regimes: (i) The Mishchenko et al., [8,9] radiative transfer code for Mie-Lorentz scatters distribution (~0.5-80 microns size in visible range) with Percus-Yevick filling factor correction (called RTT-PM, [10]) to model the thick portion of the plume; (ii) and the Muinonen et al. [11] ray optics code for diverse particle shapes and sizes higher than 100 microns.
model conditions. The plume boundaries are considered much similar to an atmospheric cloud, with particles sparse, many mean radii separated from each other, and the observations in far-field, removed several kilometers from the object of study. Furthermore, we imposed that the number of large particles (>100 microns) is much smaller than the number of Mie-Lorenz particles, therefore limiting the interactions among the large particles, but not with the small particles. Hence, the validity regime for the radiative transfer equation is conserved. Furthermore, coherent effects, shadowing, and opposition effect mechanisms are out of the scope of our calculations and observational conditions with LICIACube.
interaction. The interactions are only resolved between the thick cloud and the >100 microns particles. In the first approach, we compute the particles hovering over the radiative transfer semi-infinite plane of the thick plume, as it gets backlit in varied distances up. In reverse, the thick plume is forward-lit by the particle scattering. In the second approach, the large particles are embedded in the thick plume up to optical depth = 5, again, the medium is considered sparse.
Preliminary Results: Given that Didymos is an S-type asteroid, with visible spectra profile very similar to L/LL Chondrites [6], we selected the Itokawa sample size frequency distribution obtained by the Hayabusa mission as analog [12]. L/LL Chondrite most abundant minerals are Fayalites and Ferrosilites. However only VIS optical constants for Fayalites were recovered [13], thus we stick with it in our simulations. In Fig. 1, we present the bi-directional reflectance distribution factor (BRDF) for the layers composing the plume in our simulation: (I) thick “core”, multiple-scattering Mie RTT-PM; (ii) “scattered small particles'', single-scattering-only Mie-Lorenz particle volumes; (iii) “scattered large particles”, single-scattering-only >100 microns particle volumes. The BDRF can therefore vary as the volumes become less opaque, leading to less reflectiveness for middle phase angles.
In future developments of our modeling, we will use results from ejecta dynamics to constrain the number of particles and population for different zones and lines of sights through the plume [14, 15, 16].
Furthermore, the interaction of the large particles and the thick Mie particle cloud is under refinement, as we test the codes for different binning, distances and depths. Nonetheless, first tests indicate a magnification of the overall BRDF for large azimuth angles, due to coupling with the overall forward scattering behavior of the large particles.
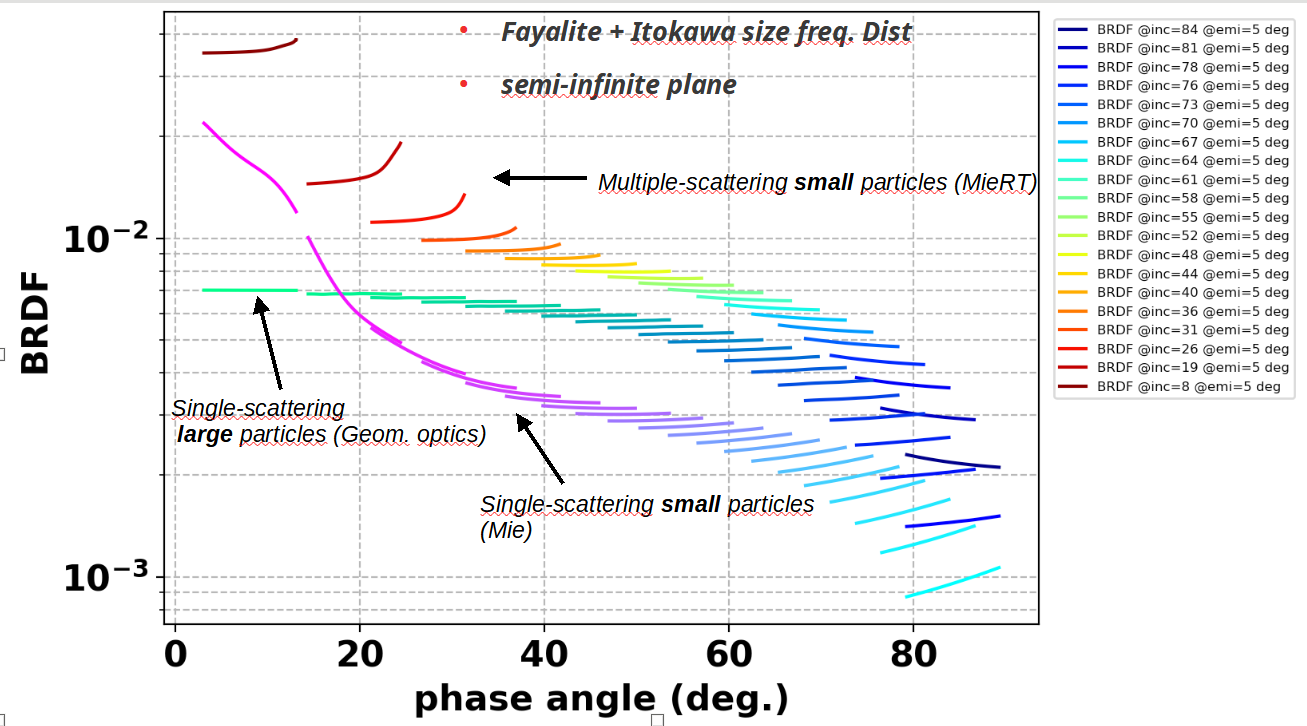
Fig. 1. bi-directional reflectance distribution factor for different layers of the plume, separately. Fayalite’s optical constants at 550 nm (Re(m)=1.6, Im(m)=5e-3) are used, together with Itokawa sample size frequency distribution (Nakamura et al., 2012). Filling factor for RTT-PM is fixed at 0.1%.
Acknowledgements: This research was supported by the Italian Space Agency (ASI) within the LICIACube project (ASI-INAF agreement AC n. 2019-31-HH.0).
References: [1] Sarli et al., 2017, AAS/AIAA 17-206.[2] Groussin et al., 2010, Icarus 205, 627–637.[3] Cheng et al., 2020, Icarus 352, 113989.[4] Dotto et al., 2021, PSS, Volume 199, 10518.[5] Poggiali et al., 2022, PSJ Focus Issue (submitted).[6] Ieva et al., 2022, PSJ Focus Issue (submitted).[7] A’Hearn, 2006, 229th IAU Sym. ACM Proc., 33-40.[8] Mishchenko et al., 1999, JQSRT, 63, 409-432.[9] Mishchenko et al., 2015, JQSRT 156, 97-108.[10] Ito et al;, 2018, JGRE 123, 5, 1203-1220[11] Muinonen et al., 2009, JQSRT 110, 14-16, 1628-1639.[12] Metzger & Britt, 2020, Icarus 350, 113904.[13] Fabian et al., 2001, A&A 373, 1125–1138.[14] Rossi, A. F. et al., 2022, PSJ, Focus Issue (in press).[15] Zanotti, G., and M. Lavagna, 2020, IAC 71.[16] Ivanovski et al., 2022, PSJ Focus Issue (submitted).
How to cite: Hasselmann, P. H., Bertini, I., Zanotti, G., Rossi, A., Ivanovski, S., Gai, I., Deshapriya, J. D. P., Mazzotta Epifani, E., Dotto, E., Della Corte, V., and Zinzi, A. and the LICIACube Team: DART mission ejecta plume: Modeling the reflectance through radiative transfer and geometric optics in support to LICIACube observations, Europlanet Science Congress 2022, Granada, Spain, 18–23 Sep 2022, EPSC2022-615, https://doi.org/10.5194/epsc2022-615, 2022.
SB6 | Cosmic Dust in our Solar System
In our solar system, meteoritical matter exhibits a variety in bulk compositions that is representative of the processing history of refractory matter in the protosolar nebula (PSN). This history is usually investigated via a thermodynamic approach, where refractory grains condense out from a hot cloud. However, in the innermost regions of the PSN the migration timescale of grains can exceed the evaporation timescale of refractory species.
We investigate the role played by rocklines (condensation/sublimation lines of refractory materials) in the innermost regions of the PSN to compute the composition of drifting and evaporating grains. To do so, we compute the evolution of the PSN using a 1D viscous accretion disk model [1]. The disk is initially filled with dust that is a mixture of several refractory species of protosolar composition. This dust exists in the form of refractory grains and their vapors. The radial transport of grains is computed by solving an advection-diffusion equation, and phase transitions are accounted for by computing sublimation and condensation rates for each species. We then compare the composition of the PSN computed by our model with the composition of meteoritical bodies collected on Earth.
We find that the compositional gradient in the PSN that is created by rocklines, shown in Figures 1 and 2, matches the composition of cosmic spherules, chondrules, and chondrites. Moreover, our model shows that solid matter is concentrated in the vicinity of these sublimation/condensation fronts. Although our model only focuses on the most abundant refractory species (olivine, represented in our model by its end members forsterite and fayalite; enstatite and ferrosilite pyroxenes; kamacite and taenite metal; and iron sulfide), it suggests that rocklines heavily processed refractory matter in the PSN, which has important consequences for the composition of small and large bodies in the innermost regions of the solar system. The local increase of the iron abundance close to rocklines of iron alloys could have contributed to the high Fe-content in Mercury.
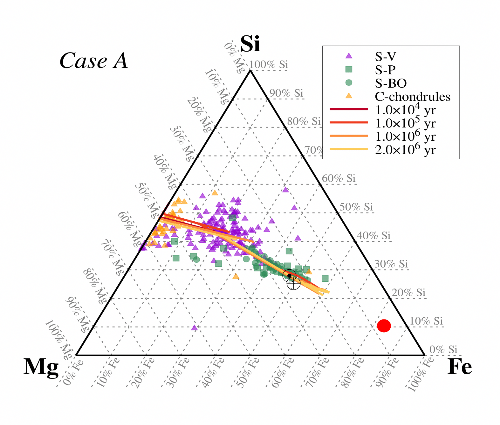
Figure 1. Composition profiles of the PSN in a Mg-Fe-Si ternary diagram (expressed in mass fraction) at different times, with composition of glass cosmic spherules (S–V type), barred olivine spherules (S-BO type), porphyritic spherules (S-P type) and C-chondrules. Protosolar and Earth’s compositions are represented by Sun’s and Earth’s symbols, respectively, and Mercury’s composition is represented by a red circle.
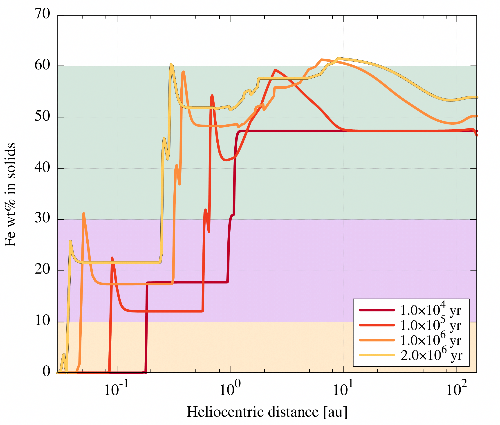
Figure 2. Same as Figure 1, but here the Fe wt% is represented as a function of heliocentric distance. Color boxes correspond to typical compositions of chondrules (0%–10%), glass cosmic spherules (10%–30%), and porphyritic and barred olivine cosmic spherules (30%–60%).
[1] Aguichine, A., Mousis, O., Devouard, B., and Ronnet, T. 2020, ApJ, 901, 97.
How to cite: Aguichine, A., Mousis, O., and Devouard, B.: Processing of refractory species in the vicinity of rocklines, Europlanet Science Congress 2022, Granada, Spain, 18–23 Sep 2022, EPSC2022-358, https://doi.org/10.5194/epsc2022-358, 2022.
SB7 | Laboratory measurements of returned Hayabusa2 samples, meteorites and planetary analogues
Introduction
Astrophysical ices were observed in various environments with different compositions : from the icy grains of the interstellar medium (ISM, [1]), to various bodies of the solar system such in icy moons of Jupiter or Saturn systems, or in comets. In such environments, ice is subjected to various alterations ranging from a wide range of UV doses, different physicochemical alterations [2], thermal alterations [3] and various primitive ice composition [4]. As inferred by laboratory experiments, these ice alterations are now known to generate a large molecular diversity ( [5], [6]). This organic matter is well observed in certain meteorites where up to 4 % of the total matter is organic (carbonaceous chondrites [7]), but this number can grow up to 45 % in interstellar dust particles and comets [8]. Laboratory experiments suggest that grain chemistry from primitive ices composed of H2O, NH3, methanol (MeOH) or other molecules is the main source of this astrophysical organic matter ([9], [10]). The reactivity occurring during the alteration of such an ice is a two step mechanism: First, energetic processes form radicals such as H•CO or •CH2OH which directly produces molecules such as CO or CO2 [14]; Then, thermal reactivity can occur to form more complex organic compounds. During this second phase, radicals diffuse, which allows their recombination forming more complex molecules such as hexamethylenetetramine (HMT), polyethyleneimine (PMI) or polyoxymethylene (POM) [15].
The refractory [16] and volatile [17] compositions of the final organic pool is thus highly influenced by the initial ice composition ratio. In the present work, we investigate the influence of the heating rate, the residual pressure or of the photon/molecule ratio on this final organics.
Method
All the experiments were monitored in the MICMOC experiment already described in [11]. It is a cryogenic vacuum chamber (~10-7 mbar) with a finger cooled down up to 77 K using liquid nitrogen. The cold finger contains IR transparent MgF2 windows on which primitive moieties H2O, NH3 and methanol (MeOH) are deposited within a fixed 3:1:2 ratio (H2O:MeOH:NH3). The irradiation at Lyman α (121 nm) is concomitant to the ice formation during 70 h and then warmed up to ~300 K. The following experiments were performed :
- Various irradiation rates (1,5.103, 141, 5 photon/MeOH), by modifying the flux of matter;
- Fixed irradiation (~80 photon/MeOH) and various heating rates (0.5, 4, 8 K/min) monitored by a heating resistance after the irradiation phase;
- Fixed irradiation and various pressures of Ar added during the heating phase.
All samples were then analyzed using both fourier-transform infrared spectrometry (FT-IR) and electrospray fourier- transform ion cyclotron resonance mass spectrometry (ESI-FT-ICR [18]).
Preliminary results and conclusions
Preliminary results are displayed Figure 1. First, infrared spectroscopy measurements show weak impacts of heating rate and residual pressure during the warming phase: The main IR features present similar intensities implying no significant evolution of the final organic products. The only significant influence observed is the lower FT-IR intensity recorded at lower heating rate (0.5 K/min). Regarding the irradiation rate, it shows the highest evolution on the IR signatures : for low irradiation rates (5 photon/MeOH) ν(OH) at 3242 cm-1 vs νas(CH) at 2923 cm-1 ratio is significatively modified and ω(CH2) at 1458 cm-1 and νas(COO-) at 1598 cm-1 are significatively exhausted. This suggests the presence of salts, polyoxymethylene (POM), hexamethylenetetramine (HMT) and polyethyleneimine (PMI) in higher quantities in this sample. On the contrary, the FT-IR spectrum of the higher irradiated sample shows no features because of a decrease in the yield of organic production implying a lack of sensitivity with FT-IR.
To obtain complementary information on the molecular evolution ESI-FT-ICR analysis was recorded on the same samples. The ESI-FT-ICR confirmed the preliminary results observed with FT-IR with a better insight on the molecular processes impacting the final organic composition. All together the influence of those three parameters are the following :
- Irradiation has a high impact on the molecular content of the sample, mostly on the DBE, but also on the molecular diversity and abundance;
- The increase of the residual pressure during the heating phase has a weak influence, even if it increases a higher experimental dispersion regarding the molecular abundance while the molecular diversity is not impacted;
- Finally, the heating rate has a very weak influence on the final organic composition.

Figure 1 Comparison of FT-IR spectra or ESI+ FT-ICR mass spectra of the residue for each sample series (A, B, C). Global shape of both ESI+ and ESI– of FT-ICR analysis are showing similar properties.
Bibliography :
[1] D. H. Wooden et al., “Composition and Evolution of Interstellar Clouds,” in Comets II, University of Arizona Press, pp. 33–66, 2004.
[2] G. M. Muñoz Caro et al., ACS Earth Space Chem, vol. 3, no. 10, pp. 2138–2157, 2019.
[3] O. Mousis et al., Astrophys. J., vol. 819, no. 2, p. L33, 2016.
[4] M. J. Mumma and S. B. Charnley, Annu. Rev. Astron. Astrophys., vol. 49, no. 1, pp. 471–524, 2011.
[5] G. Danger et al., GCA, vol. 118, pp. 184–201, 2013.
[6] A. Ruf et al., Life, vol. 9, no. 2, p. 35, 2019.
[7] S. Pizzarello and E. Shock, Cold Spring Harb. Perspect. Biol., vol. 2, no. 3, pp. a002105–a002105, 2010.
[8] J.-L. Bertaux and R. Lallement, MNRAS, vol. 469, no. Suppl_2, pp. S646–S660, 2017.
[9] A. Gutiérrez-Quintanilla et al., MNRAS, vol. 506, no. 3, pp. 3734–3750, 2021.
[10] G. Fedoseev et al., MNRAS, vol. 448, no. 2, pp. 1288–1297, 2015.
[11] L. d’Hendecourt and E. Dartois, Spectrochim. Acta A Mol. Biomol. Spectrosc., vol. 57, no. 4, pp. 669–684, Mar. 2001.
[12] P. Schmitt-Kopplin et al., PNAS, vol. 107, no. 7, pp. 2763–2768, 2010.
[13] F. Duvernay et al., ApJ, vol. 791, no. 2, p. 75, 2014.
[14] K. I. Öberg, Chem. Rev., vol. 116, no. 17, pp. 9631–9663, 2016.
[15] V. Vinogradoff et al., A&A, vol. 551, p. A128, 2013.
[16] A. Fresneau et al., ApJ, vol. 837, no. 2, p. 168, 2017.
[17] N. Abou Mrad et al., ApJ, vol. 846, no. 2, p. 124, 2017.
[18] P. Schmitt-Kopplin et al., Anal. Chem., vol. 82, no. 19, pp. 8017–8026, 2010.
How to cite: Javelle, T., Ruf, A., Schmitt-Kopplin, P., and Danger, G.: Impacts of residual pressure, heating rate and photon to molecular ratio on the molecular composition generated by the processing of astrophysical ices, Europlanet Science Congress 2022, Granada, Spain, 18–23 Sep 2022, EPSC2022-102, https://doi.org/10.5194/epsc2022-102, 2022.
Micro- and nano-scale computed tomography (µ-CT, n-CT) is a relatively fast method for studying, among others, textural and physical properties of solid materials. For example, we are using micro- and nano-CT techniques to study chondrules and CAIs from primitive meteorites. If properly calibrated, CT studies can also help obtaining (qualitative) chemical information. However, there was always the question whether or not CT-techniques are non-destructive. We tested for this by using matrix material from the CV3 chondrite Allende. We prepared a powdered matrix sample and divided them into five aliquots; three aliquots were irradiated using a Bruker SkyScan 1272 µXCT-Scanner, at the Anatomy department at the university of Bern, operating at 70 keV, 50 keV, or 30 keV. Two samples served as non-irradiated standards. We investigated if the irradiation has any effect on the noble gas concentrations. We found that that there is no effect, i.e., the noble gas concentrations are indistinguishable between irradiated and non-irradiated samples. Since there is no effect for the very fine-grained matrix material, we can conclude that there is also no effect for larger objects like chondrules and CAIs.
How to cite: Ghaznavi, P., Kadlag, Y., Leya, I., and Haberthuer, D.: The effects of irradiation on the noble gases in matrix of Allende (CV) meteorite, Europlanet Science Congress 2022, Granada, Spain, 18–23 Sep 2022, EPSC2022-115, https://doi.org/10.5194/epsc2022-115, 2022.
- Introduction
The characterization of the complex magnetic susceptibility (real and imaginary parts) of rocks is an unexplored tool to constrain the composition, structure and geological history of rocks in surface planetary exploration. We propose the NEWTON susceptometer for the determination of the complex magnetic susceptibility, to provide valuable information about the regolith and surface rocks in rocky bodies of the solar system, to be used as a selection criterion of rocks for sample return missions or for the in-situ scientific studies of the magnetic properties during planetary missions [1]. The instrument is based on AC - inductive methods, and its dynamic range of the real susceptibility covers magnetic susceptibility values for rocks from the Earth, Moon and Mars [2, 3, 4]. The sensor is suitable to be placed on board rovers, or to be used as a portable device during field campaigns and by astronauts in manned space missions. This sensor provides a great advantage compared to available commercial susceptometers due to its robustness, compatibility with the planetary environments and that it does not require sample preparation, but only minimum sample dimensions (~50 x 20 x 20 mm).
The aim of this work is to test the capability of the instrument in two different scenarios with distinct types of samples representative of a wide susceptibility range: 1) the in-situ real magnetic susceptibility determination in Cerro Gordo volcano, considered as a terrestrial analogue [5]; and 2) the characterization of meteorites from the collection of the Museo Geominero (Madrid, Spain).
The first study case consists of an intraplate volcano, with potential similar composition and structure of volcanoes from Mars. The second study case comprises various meteorite samples of different origins.
2.1 Terrestrial analogue: Cerro Gordo volcano
Cerro Gordo volcano was proposed as a Martian analogue due to its structural similarities with Martian volcanoes. It lies to the SW of Almagro (38°49’13”N/3°44’37”W), within the Campo de Calatrava volcanic region in Spain [6], and is emplaced among Paleozoic host rocks where the Armorican quartzite yields the topographic heights.
Cerro Gordo is part of a volcanic lineation, all of olivinic nefelinite composition and thought to have erupted coevally (1.5 ± 0.3 Ma [7]), that follows a NNE-SSW fracture [8]. Its eruptive style varied with time from phreatomagmatic to strombolian and phreatomagmatic again to end with an effusive phase [9]. For this reason the deposits found in the field (pyroclastic surge deposits, lahar facies, scoria and pyroclastic deposits, a lava flow, tuffs, breccias and spatter deposits) are varied in composition and structure, and therefore comprise a large range of magnetic susceptibility values, making Cerro Gordo an excellent scenario for a demonstration campaign of the susceptometer prototype.
2.2 Meteorites
A total of 16 meteorites of different compositions, and therefore varied susceptibility ranges, have been measured for this work, 10 aerolites and 6 siderites. The criteria followed was that their volume accomplished the minimum size stated in the introduction. The samples were divided into faces and measured twice in each of them. In the case of the siderites showing a flat polished face with Widmanstätten structures, the polished face was measured in two orthogonal directions to test the possible influence of the internal structural ordering.
- Conclusions
Previous results from Cerro Gordo showed the capability of the magnetic susceptibility results to distinguish between different rock deposits. The ongoing work on the collected samples analysis and geological description of the study location is intended to relate the magnetic susceptibility values with the mineral composition of the rocks, enhancing the comprehension of the susceptibility measurements and the structure of the volcano. The measurements on meteorites are currently under analysis, and aim to classify the measured samples as a function of their magnetic susceptibility [10].
Acknowledgements:
This work has been funded by the Spanish Programme for Research, Development and Innovation under the grants of references ESP2017-88930-R and PID2020-119208RB-I00: MagAres and MINOTAUR, respectively, as well as the European Union Project NEWTON, of grant agreement 730041. JSO is funded by the European Union’s Horizon 2020 research and innovation programme under the Marie Sklodowska-Curie grant agreement SIGMA no 893304.
References:
[1] Díaz Michelena et al. 2017, Sensor Actuat A-Phys, vol. 263, pp. 471-479
[2] Rochette et al. 2005, Meteoritic and Planetary Science, 40 (4): 529–540
[3] Rochette 2010, Earth Planet. Sci. Lett., 292: 383–391.
[4] Hunt et al. 2013, Wiley. Online Library. DOI: 10.1029/RF003p0189.
[5] Monasterio et al. 2021, Terrestrial Analogs Conference (LPI Contrib. No. 2595)
[6] Becerra-Ramírez et al. 2020, Geosciences, 10, 441.
[7] Ancoechea & Huertas 2021, J. Iberian Geology (47): 209-223.
[8] Ancoechea 1999, Enseñanza de las Ciencias de la Tierra (73): 237-243.
[9] González et al. 2010, Aportaciones Recientes en Volcanología 2005-2008: 57-65.
[10] Rochette et al. 2003, Meteoritics & Planet. Sci., 38: 251-268.
How to cite: Mesa Uña, J. L., Losantos, E., Oliveira, J. S., G. Monasterio, Ó., and Díaz Michelena, M.: Testing the applicability of NEWTON Susceptometer for fast and in-situ determination of the magnetic susceptibility, in meteorite samples and a Martian terrestrial analogue., Europlanet Science Congress 2022, Granada, Spain, 18–23 Sep 2022, EPSC2022-827, https://doi.org/10.5194/epsc2022-827, 2022.
Introduction
Comets are the most primitive bodies of the solar system [1]. They are composed of low density material: mainly dust and ice. A better understanding of their composition is of particular interest to improve the comprehension of the composition of the material composing the forming solar system. Nevertheless, because of detection issues, the composition of its nucleus is only poorly known even eight years after the landing of the Philae probe from the European Space Agency (ESA) Rosetta mission. Most insights on the organic composition of 67P/Churyumov-Gerasimenko are coming from indirect analysis estimating that around 45 % of a comet is composed of organic matter ([2],[3]).
Laboratory experiments show similarities with the organic matter observed in comets [4]. Astrochemical experiments are thus a promising approach to cover this lack of data. Experiments simulating the chemical reactivity occurring on icy grains initially composed with volatile molecules such as H2O, NH3, methanol (MeOH) give information into the refractory [5] and volatile [6] organic composition that are formed in such astrophysical environments. Those experiments suggest the presence of a large organic diversity [7]. Previous work showed the correlation between the initial composition of these ices and either the volatile organic compounds (VOCs) composition [8] or the refractory organic material [9]. In this presentation, we will give the first experimental description of the correlations that exist between both three phases: the primitive ice composition, the refractory and the gas phase.
Method
All samples were synthesized using the MICMOC experiment [10]. It is a vacuum chamber (~10-7 mbar) where different ice compositions of H2O, NH3 and methanol (MeOH) were irradiated at Lyman α (121 nm) at 77 K for 5,5 h at a fixed irradiation rate of ~7 photon/MeOH. Then, 92 mbar of argon were added before the sample was warmed up to ~300 K. Four ice compositions were tested : a benchmark experiment (Ref.) with ratio 3:1:2 (H2O:MeOH:NH3); a H2O-rich sample, 8:1:2; a NH3-rich sample, 2:1:5; and a MeOH-rich sample, 2:5:3.
VOCs are recovered using an extra cryogenic trap coupled to a valve system for GC-EI-FT-Orbitrap analysis [11]. Three replicates are made for each ice composition. The cumulation of the three residual phases from all samples is then extracted and dissolved 10 times into methanol before positive ESI-FT-ICR. More details on the apparatus characteristics can be found in [12].
To extract correlations between all three phases (initial ice, refractory and gas), principal component analysis (PCA) were performed on the dataset standardized by variable with following characteristics :
- For the gas phase (Figure 1A): individuals are the triplicates of GC-EI-FT-Orbitrap analysis with 150 chromatographic peak areas as variables;
- For the refractory phase (Figure 1B): individuals are the analysis of methanol solubilized refractory material injected using positive ESI-FT-ICR with between 4126 to 12814 extracted exact mass peak area as variables.
Preliminary results and conclusions
PCA is a mathematical tool to find the smartest plan to differentiate individuals in a multiple variable hyperspace. Figure 1 displays the plan with highest differences from those two datasets. Axes 1 and 2 are mostly enough to discriminate samples according to their initial composition for both gas phase (Figure 1A) and residual phase (Figure 1B). As most individual ices are present in different zones, it proves the organic composition of each phase allows to find correlation between them.
More specifically, in the gas phase (Figure 1A) only three zones can be determined : the first one contains only NH3-rich ices, the second one MeOH-rich ices and the third one both the benchmark experiment (Ref.) and H2O-rich ices. Consequently, H2O, NH3 and MeOH seem to have different impacts on the volatile organic compounds: H2O seems to be less impactful on the first and second principal axes while only the third axes can discriminate it from the other zones.
Finally, all three parameters can be separated using ACP on residual phase, proving significant differences extracted from the intensity and compound nature detected by positive ESI-FT-ICR. All together, this suggests a high correlation between all three phases regarding their organic compound composition.
Shortly :
- On the gas phase : NH3 hinders all volatile productions including nitriles, H2O has little impact on the gas composition with respect to the benchmark experiment.
- On the refractory phase : NH3 and H2O are changing the nature of organics produced and making global ESI-FT-ICR intensity. H2O is the ice that’s producing the smaller organic diversity (tree time less compounds detected).
- In both gas and residual phase : MeOH has little impact on the final organic compound type, but enhances the total amount of them.
A) |
B) |


Figure 1. Principal component analysis (PCA) of results from each sample. In A) individuals are the triplicates of GC-EI-FT-Orbitrap analysis with chromatographic peak areas as variables. In B) individuals are each four analyses of methanol solubilized refractory material injected using positive ESI-FT-ICR with exact mass peak area as variables. Samples are labeled according to the compound exhausted in the initial composition of the ice with respect to the benchmark experiment (Ref.); H2O for the H2O-enriched sample; NH3 for the NH3-enriched sample and a MeOH for the MeOH-enriched sample.
Bibliography :
[1] M. J. Mumma and S. B. Charnley, Annu. Rev. Astron. Astrophys., vol. 49, no. 1, pp. 471–524, 2011.
[2] J.-L. Bertaux and R. Lallement, MNRAS, vol. 469, no. Suppl_2, pp. S646–S660, 2017.
[3] K. Varmuza et al., J Chemom, vol. 34, no. 4, 2020.
[4] F. Duvernay et al., ApJ, vol. 791, no. 2, p. 75, 2014.
[5] G. Danger et al., GCA, vol. 118, pp. 184–201, 2013.
[6] N. Abou Mrad et al., Anal. Chem., vol. 86, no. 16, pp. 8391–8399, 2014.
[7] A. Ruf et al., Life, vol. 9, no. 2, p. 35, 2019.
[8] N. Abou Mrad et al., ApJ, vol. 846, no. 2, p. 124, 2017.
[9] A. Fresneau et al., ApJ, vol. 837, no. 2, p. 168, 2017.
[10] L. d’Hendecourt and E. Dartois, Spectrochim. Acta A Mol. Biomol. Spectrosc., vol. 57, no. 4, pp. 669–684, Mar. 2001.
[11] T. Javelle et al., J. Chromatogr. A, vol. 1652, p. 462343, 2021.
[12] P. Schmitt-Kopplin et al., Anal. Chem., vol. 82, no. 19, pp. 8017–8026, 2010.
How to cite: Javelle, T., Schmitt-Kopplin, P., and Danger, G.: Correlations between cometary ice composition and their refractory and gas organic diversity: clues from laboratory experiments, Europlanet Science Congress 2022, Granada, Spain, 18–23 Sep 2022, EPSC2022-1018, https://doi.org/10.5194/epsc2022-1018, 2022.
Introduction: Primitive asteroids that accreted beyond the snowline in the protoplanetary disk likely played a crucial role in the delivery of water and organic matter to Earth and other terrestrial planets. The surface of the Cb-type asteroid 162173 Ryugu has low overall reflectance and an absorption feature at ~2.7 µm consistent with the presence of carbonaceous materials and phyllosilicates [1]. The spectral characteristics of Ryugu’s surface are most similar to the highly altered CI (“Ivuna-like”) and/or dehydrated CY (“Yamato-like”) carbonaceous chondrites [2].
In December 2020, JAXA’s Hayabusa2 mission successfully returned to Earth with >5 g of sample collected from the surface of Ryugu. The initial investigation of the samples suggested a close affinity with the CI chondrites [3], which consist of abundant phyllosilicates (~80 vol.%), plus minor amounts of magnetite (~10 vol.%), and dolomite (<5 vol.%), having experienced low temperature (<100°C) aqueous alteration [4]. In contrast, the CY chondrites contain dehydrated phyllosilicates and/or recrystallized olivine (~70 vol.%), Fe-sulphides (up to ~20 vol.%), and sometimes metal (~1 vol.%) following post-hydration metamorphism at temperatures >500°C [5]. Here, as part of the Hayabusa2 “Stone” preliminary examination team, we have characterised the modal mineralogy of a Ryugu particle to further constrain its aqueous and thermal history.
Methods: A powdered sub-sample of Ryugu particle C0002 (plates 3 and 4) was analysed using position-sensitive-detector X-ray diffraction (PSD-XRD) at the Natural History Museum (NHM), London. XRD patterns were acquired from the Ryugu powder using a high-intensity micro X-ray source for 6 hours, with the sample rotated throughout the analysis. Pure standards of each phase detected in the Ryugu powder were analysed under exactly the same conditions for 15 minutes. The modal mineralogy of the Ryugu powder was then determined using an established peak fitting method [4, 5].
Results & Discussion: Ryugu particle C0002 (plates 3 and 4) contains a mixture of Mg-rich serpentines and smectites that are present at an abundance of ~84 (± 2) vol.%. Other phases identified from the XRD pattern include magnetite (~8 vol.%), pyrrhotite (~7 vol.%), and dolomite (~2 vol.%). This mineralogy is broadly consistent with our petrographic observations of polished Ryugu sections (C0025-01 and C0103-02). Diffraction peaks from anhydrous olivine and pyroxene were not observed suggesting that their abundance is ≤1 vol.% in the analysed fraction of C0002. If we assume a maximum anhydrous silicate abundance of 2 vol.%, then the phyllosilicate fraction (PSF = total phyllosilicate abundance / [total anhydrous silicate + total phyllosilicate abundance]) of the Ryugu powder is 0.98, which corresponds to a petrologic sub-type of 1.1 on the alteration scale of Howard et al. [6].
The XRD pattern and modal mineralogy of Ryugu particle C0002 (plates 3 and 4) is very similar to the CI chondrites [4]. However, the Ryugu powder does not contain sulphates and ferrihydrite, which are common in the CI chondrites and thought to be terrestrial weathering products [7]. The Ryugu powder also has a comparable mineralogy to the recent C2ung fall Tarda, which appears to be related to the Tagish Lake (C2ung) meteorite [8]. However, Tarda retains partially altered chondrules and has a relatively high abundance of anhydrous silicates (~10 vol.%) [9]. In addition, the XRD pattern and modal mineralogy of the Ryugu powder is clearly distinct from the CY chondrites, which contain dehydrated phyllosilicates that lack coherent diffraction, and abundant poorly crystalline troilite and secondary olivine [5].
The modal mineralogy of Ryugu particle C0002 (plates 3 and 4) is consistent with having formed through low temperature aqueous alteration. The fluid-rock reactions reached near-completion, resulting in a secondary assemblage of phyllosilicate, sulphide, magnetite, and Mg-carbonate that was not overprinted by a later episode of thermal metamorphism at temperatures >~400°C.
References: [1] Kitazato et al. (2019) Science. 364:272. [2] Kitazato et al. (2021) Nature Astronomy. 5:246. [3] Yada et al. (2022) Nature Astronomy. 6:214. [4] King et al. (2015) Geochimica et Cosmochimica Acta. 165:148. [5] King et al. (2019) Geochemistry. 79:125531. [6] Howard et al. (2015) Geochimica et Cosmochimica Acta. 149:206. [7] Gounelle & Zolensky (2001) Meteoritics & Planetary Science. 36:1321. [8] Marrocchi et al. (2021) The Astrophysical Journal Letters 913:L9. [9] King et al. (2021) 52nd LPSC, abstract #1909.
How to cite: King, A., Russell, S., Nakamura, T., Yurimoto, H., Noguchi, T., Okazaki, R., Yabuta, H., Naraoka, H., Sakamoto, K., Tachibana, S., Watanabe, S., and Tsuda, Y.: The modal mineralogy of asteroid 162173 Ryugu and its relationship to carbonaceous chondrite meteorites, Europlanet Science Congress 2022, Granada, Spain, 18–23 Sep 2022, EPSC2022-1264, https://doi.org/10.5194/epsc2022-1264, 2022.
SB8 | Surface and interiors of small bodies, meteorite parent bodies, and icy moons: thermal properties, evolution, and structure
Internal structure models of dwarf planets and giant planets’ moons previously assumed essentially Earth-like silicate-metal cores surrounded by ice. Inner density models of the rocky cores of differentiated Ganymede and Titan, the largest icy moons in the solar system indicate the presence of a low-density component in addition to silicates and metal sulfide. Carbonaceous matter akin to coal formed from abundant organic matter in the outer solar system is a likely low-density component. Progressive gas release from coal may sustain up to present-day the replenishment of ice-oceanic layers in organics and volatiles. This accounts for widespread observation of nitrogen as well as light hydrocarbons to complex organic molecules at the surface, in the atmospheres, or in plumes emanating from moons and dwarf planets. Analysis of available density of rocky cores of other icy moons and dwarf planets also suggests the presence of a low-density carbonaceous component. We tested this hypothesis and found that rocky core densities in dwarf planets and icy moons are consistent with a mixture of chondritic silicate-sulfide rocks and a rock-free precursor composed of ices and carbonaceous matter in near-solar proportions. Thermal models taking into account the presence of carbonaceous matter is performed to evaluate its effects on the present-day structure of icy moons and dwarf planets.
How to cite: Reynard, B. and Sotin, C.: Carbon-rich icy moons and dwarf planets, Europlanet Science Congress 2022, Granada, Spain, 18–23 Sep 2022, EPSC2022-11, https://doi.org/10.5194/epsc2022-11, 2022.
Triton, the largest satellite of Neptune, represents a unique body in our Solar System. One of the few satellites in Solar System with ongoing geological activity, Triton, which likely originated in the Kuiper’s Belt [1], underwent a troubling evolution, passing through Neptune’s capture [2], subsequent prolonged orbit circularization, which was followed by an enhanced thermal heating and internal differentiation. The predicted differentiated interior includes an outer ice shell, a possible internal ocean, a rocky deep interior, and a putative metallic core [3].
We model the mineral assemblages of the deep interior of Triton, considering a chondritic-like bulk composition. We describe three different evolutionary scenarios and their related mineral assemblages: anhydrous, completely hydrated, and dehydrated. Finally, we show that further investigations of Triton’s gravity field may provide new insights into the present mineral assemblage of its deep interior.
Methods
We used Perple_X software [4] to model three mineral assemblages for Triton’s deep interior at thermodynamical equilibrium, as a function of pressure (P) and temperature (T). We choose as a precursor material a chondritic bulk composition (CM, Mighei group), following a largely adopted approach in literature [5].
Discussion and conclusions
Our modelling provides three distinct mineral assemblages for Triton’s deep interior. Figure 1 shows the anhydrous mineral assemblage, which is dominated by common mantle-forming silicates (olivine, pyroxenes, and accessory phases). Figure 2 shows the hydrated mineral assemblage, formed by completely hydrated silicates (antigorite, amphiboles, chlorite, talc) which results from the water-alteration of rocks, as frequently revealed by chondritic samples [6].
Finally, we describe a dehydrated scenario (Figure 2, orange shaded area), which occurs when the hydration of a silicate shell, composed of amphiboles, olivine, pyroxenes, and accessory phases has been followed by a thermal event.
Therefore, we suggest an internal layering of the rocky core of Triton, which may imply a density-dependent distribution of minerals with increasing lithostatic pressure, with relevant implications for the global internal structure of Triton and its geological processes. The measurement of the degree two of the gravity field would constrain the present mineral assemblages of the deep interior of Triton to a higher degree of certainty.
Acknowledgments
G.M. and C.C. acknowledge support from the Italian Space Agency (2020-13-HH.0).
References: [1] McKinnon, W. B. (1984). Nature, 311(5984), 355-358. [2] Agnor, C. B., & Hamilton, D. P. (2006). Nature, 441(7090), 192-194. [3] McKinnon, W. B. and Kirk R.L. (2014), Chapter 40, Triton, Encyclopedia of the solar system, Third Edition, Elsevier, 861-881. [4] Connolly, J.A.D.(2005). Earth Planet Sci Lett, 236.1-2.524-541. [5] Néri, A., et al., (2020). Earth Planet Sci Lett, 530, 115920. [6] Brearley, A. J. (2006). Meteorites and the early solar system II, 943, 587-624.
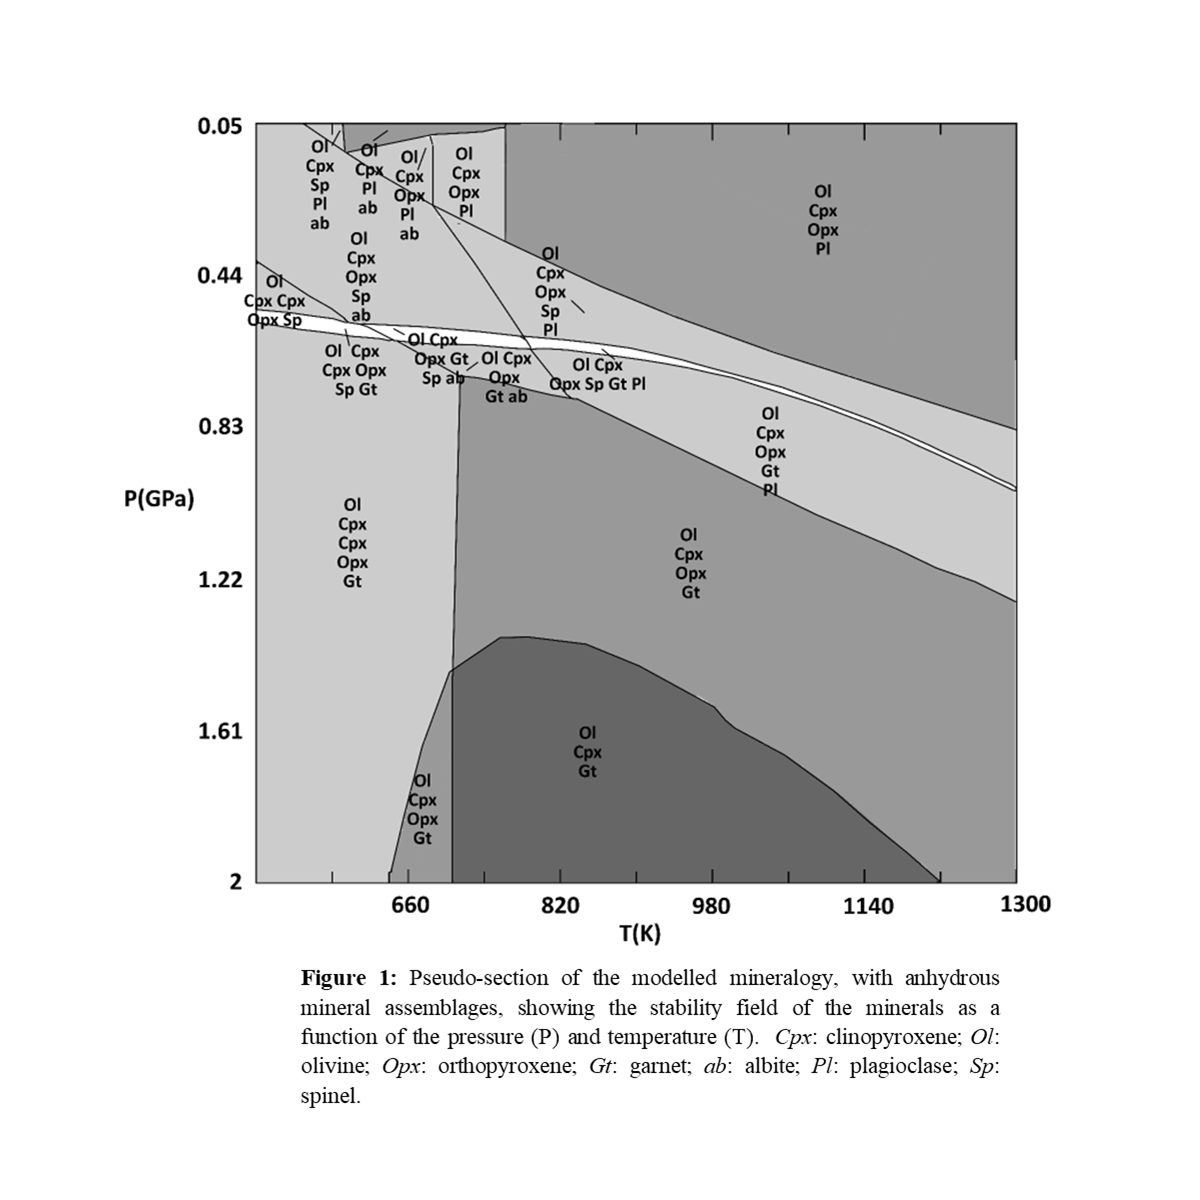
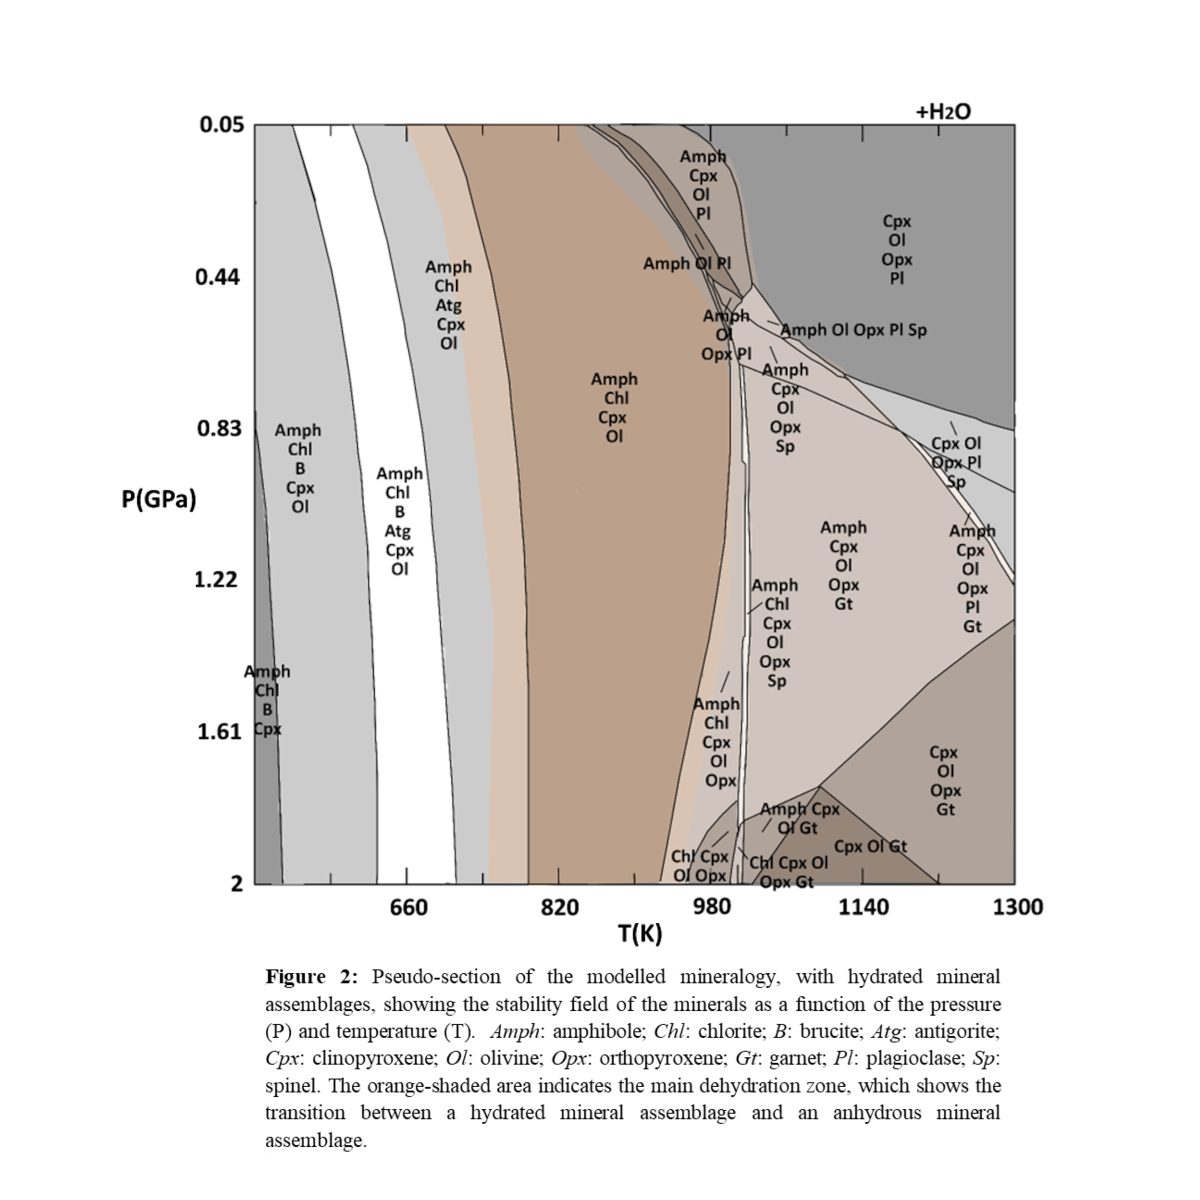
How to cite: Cioria, C. and Mitri, G.: Model of the mineralogy of the deep interior of Triton, Europlanet Science Congress 2022, Granada, Spain, 18–23 Sep 2022, EPSC2022-492, https://doi.org/10.5194/epsc2022-492, 2022.
As seen by the Hayabusa spacecraft the regolith on the surface of asteroid Itokawa shows strong segregation by particle size [1].
Approaches to explain this segregation are either focused on the bulk material, like the Brazil Nut Effect, as obeserved in agitated granular media [2, 3]. Or the explanations stems from the idea of impact driven segregation, as proposed by Sinbrot with the Ballistic Sorting Effect [4]. Both kinds of effect may even contribute concurrently [5].
We designed an experiment to investigate impact driven segregation. To experimentally recreate the surface of an asteroid [6], we utilize the microgravity of the Bremen drop tower. Inside the 10^-6 m/s² microgravity environment in the drop tower capsule, we use a linear stage to accellerate a vacuum chamber containing a granular bed (e.g. our asteroid surface) at a constant acceleration of 2*10^-4m/s². A launcher mechanism then hauls a basalt impactor onto this surface. The outcome of the impact is tracked using three cameras, enabling us to determine the coefficient of restitution (COR), defined as the ratio of the impactor's absolute velocities before and after the impact.
This ratio is a good measurement for the energy disspiation happening during the impact and therefore the relative mobility of the impactor after rebounding. The COR measured in our experiments shows an interesting behaviour, especially for finely powdered beds. While the BSE proposed by Shinbrot only requires a decline of the COR with rising bed particle size, we observe an increased COR for very fine particles as well. Using numerical simulations we find this effect to be caused by inter-partilce cohesion. In detail, we show that without cohesion no such non-monotonic behavior is possible.
From our experimental and numerical results we conclude that in a low gravity environment like asteroids cohesion is important for the size-depended COR and furthermore that its non-monotonic behavior should enhance size segregation for certain particle sizes.
[1] A. Fujiwara, J. Kawaguchi, D.K. Yeomans, M. Abe, T. Mukai, T. Okada, J. Saito, H. Yano, M.Yoshikawa, D.J. Scheeres et al., Science 312, 1330 (2006)
[2] S. Matsumura, D.C. Richardson, P. Michel, S.R. Schwartz, R.L. Ballouz, Mon. Not. R. Astron. Soc. 443, 3368 (2014)
[3] C. Maurel, R.L. Ballouz, D.C. Richardson, P. Michel, S.R. Schwartz, Mon. Not. R. Astron. Soc. 464, 2866 (2016)
[4] T. Shinbrot, T. Sabuwala, T. Siu, M.V. Lazo, P. Chakraborty, Phys. Rev. Lett. 118 (2017)
[5] E. Wright, A.C. Quillen, J. South, R.C. Nelson, P. Sanchez, J. Siu, H. Askari, M. Nakajima, S.R. Schwartz, Icarus 351 (2020)
[6] K. Joeris, L. Schönau, L. Schmidt, M. Keulen, V. Desai, P. Born, J. Kollmer, EPJ Web of Conferences 249, 13003 (2021)
How to cite: Joeris, K., Schönau, L., Keulen, M., Born, P., and Kollmer, J. E.: Slow Impacts on Rubble Pile Asteroids: The Influence of Cohesion on Restitution, Europlanet Science Congress 2022, Granada, Spain, 18–23 Sep 2022, EPSC2022-541, https://doi.org/10.5194/epsc2022-541, 2022.
The project “Deciphering compositional processes in inner airless bodies of our Solar System”, selected in the framework of the ISSI-Call for proposal 2019, set out to answer two scientific questions. First, why do chemical changes induced by space weathering in the surface regolith appear to be different on Vesta, Mercury and the Moon, and what is the role and importance of mineralogy and composition? Second, bearing in mind that olivine has been identified on the Moon and on the large asteroid Vesta, whereas it has not yet been found on Mercury: what are the implications for all of these three planetary bodies?
Vesta is the parent body of the howardite, eucrite and diogenite (HED) clan of meteorites [1]. Its surface is characterized by the presence of orthopyroxenes [2], and several geological features such as impact craters, grooves, troughs, and some tholi [3]. VIR revealed that all the Vesta spectra show the typical pyroxene bands centered at 0.9 µm and 1.9 µm [4], and allowed for determining the distribution of the HED lithologies across its surface. Like Vesta, the Moon spectra also display pyroxene spectral signatures, but suggest a composition more compatible with low-Ca pyroxenes rather than orthopyroxenes, with shallower band depths and surfaces characterized by “redder” spectral slopes (reflectance increasing with the wavelengths) [5]. Conversely, unlike Vesta and the Moon, Mercury spectra appear featureless and with a steep positive spectral slope, significantly different from the other two bodies [6].
For the spectral and geological analysis of Vesta, we processed data acquired by two instruments onboard the Dawn spacecraft: the Visible and Infrared mapping spectrometer (VIR) [7] and the Framing Camera (FC) [7]. All these datasets are publicly available on the Planetary Data System [8]. We calibrated and removed the artifacts, such as in [9] and [10], then we applied the Akimov photometric correction [11] and a log-linear phase function correction to obtain the reflectance spectra. For the Moon, we used data obtained by Chandrayaan-1/Moon Mineralogy Mapper (M3) and available at [12], then we calibrated and photometrically corrected the data following standard procedures [13, 14]. Regarding Mercury, we used the MESSENGER/Mercury Dual Imaging System (MDIS), publicly available high level products [15], and the MESSENGER/Mercury Atmospheric and Surface Composition Spectrometer instrument - Visible and InfraRed Spectrometer data [16].
To simulate space weathering effects on Vesta’s surface, we performed several irradiation experiments on HED samples at the Institut d'Astrophysique Spatiale (Orsay, France). The HED analogues are provided by the Museo di Storia Naturale dell’Università degli Studi di Firenze (Florence, Italy) and Museo di Scienze Planetarie di Prato (Prato, Italy). In particular, we have 4 HED samples, the olivine-diogenite NWA6232, and the eucrites NWA4968, NWA7234, and NWA6909 (Figs. 1 and 2). The samples are chips and powders with a grain size up to 75 µm to simulate Vesta regolith. The HEDs were put in the INGMAR vacuum chamber and bombarded with He+ atoms with a 40 keV energy, to emulate space weathering conditions.
Space weathering effects are linked to several factors, such as impacts (shock, vaporization, fragmentation, heating, melting, and ejecta formation), radiation damage, and sputtering (due to cosmic rays or solar wind), diurnal thermal cycling, and ion implantation [17, 18]. These phenomena cause the formation of nanophase iron particles (npFe0) in both the agglutinates and in the accreted rims on individual grains [17, 18], inducing spectral reddening and the reduction of band depths [18]. On the Moon, all these effects are evident in the spectra. Mercury has featureless spectra with steep, positive spectral slopes, varying with the terrain type, while on Vesta the band depth reduction is mainly due to the presence of opaque mineralogical phases, and the redder surfaces are observed in the so-called “orange material” units, corresponding to the Oppia and Octavia crater regions. The application of multivariate statistical methods to the Vesta global spectral maps, shows no evidence of diffuse olivine regions, in agreement with previous results [19, 20, 21]. A detailed analysis of Vesta, the Moon and Mercury is the key for understanding how the space weathering processes influence planetary bodies located in different regions of the Solar System, while the olivine distribution has deep implications for their origin and evolution.
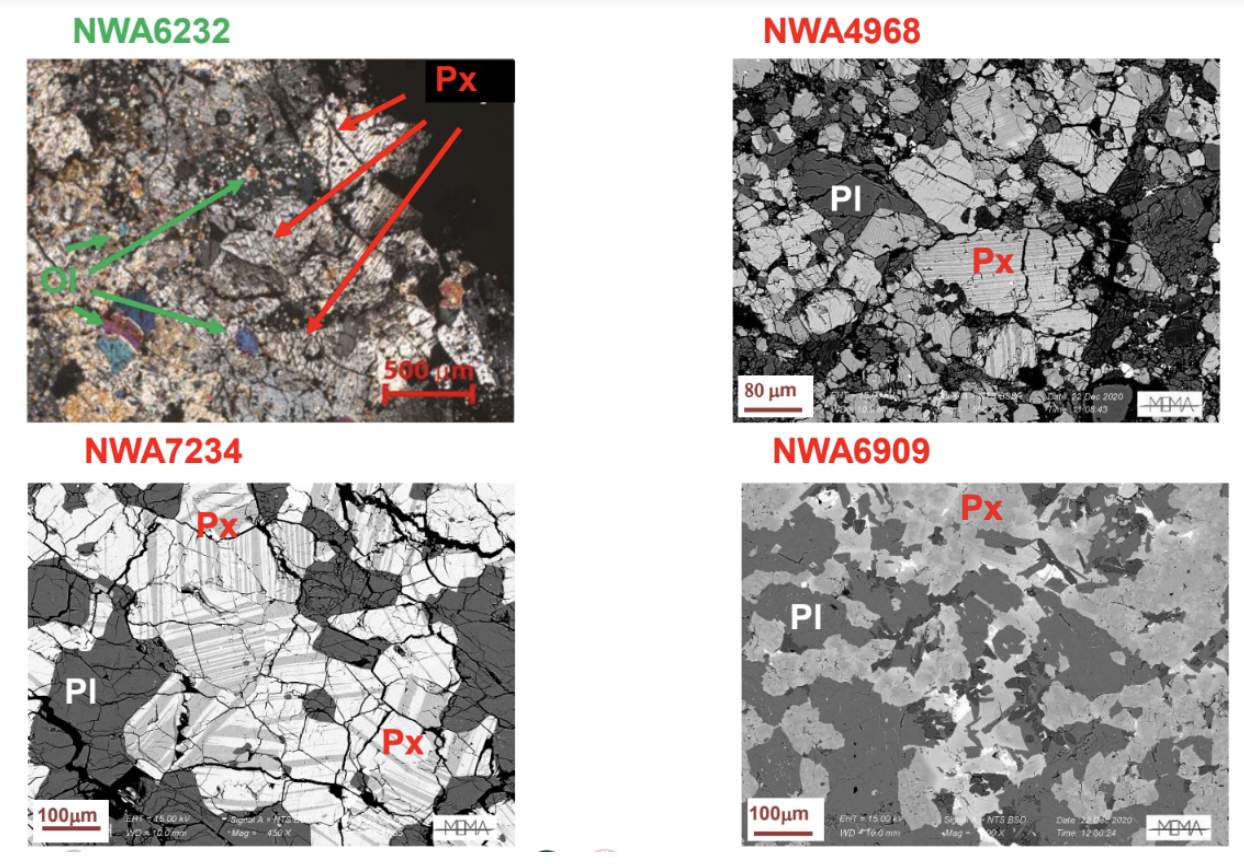
Figure 1: Close up of the HED analogues considered for our study.
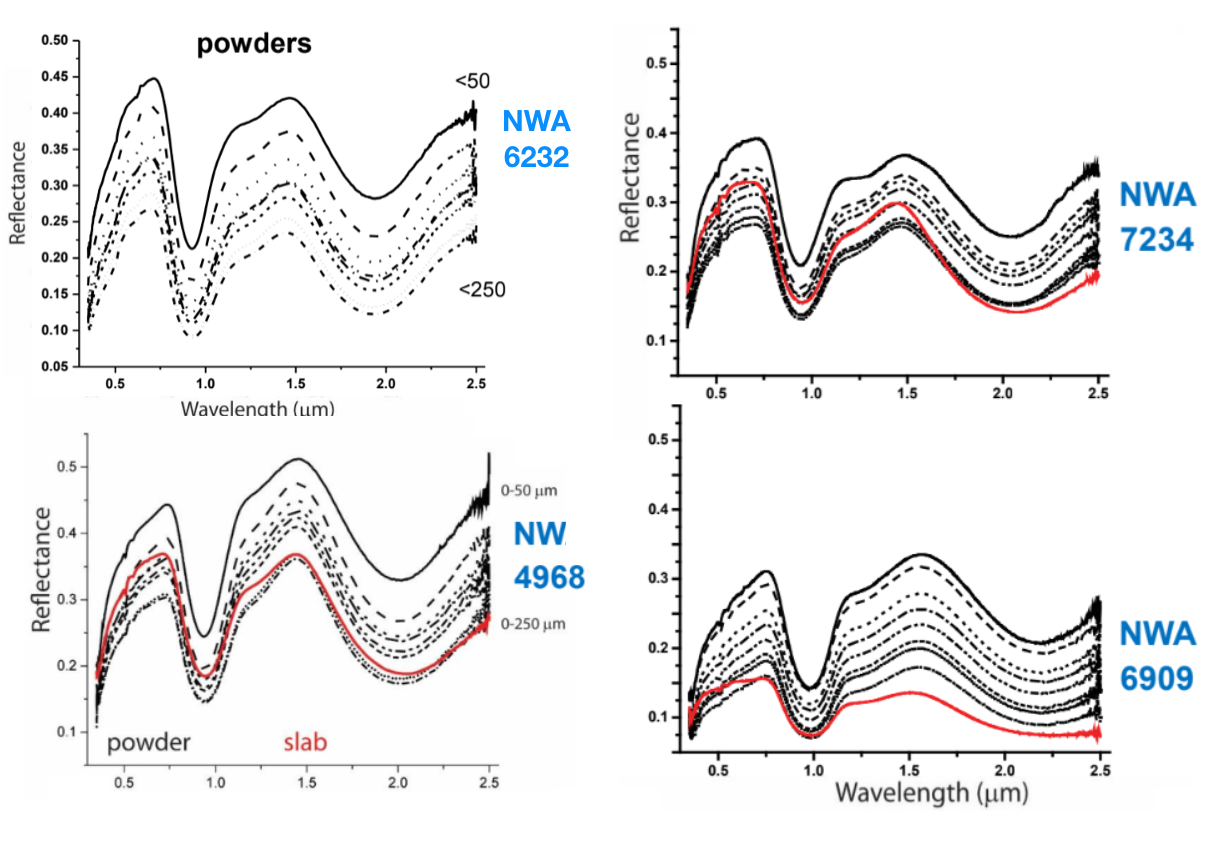
Figure 2: Reflectance spectra of the HED samples considered for this project.
Acknowledgements: This work is supported by the International Space Science Institute (ISSI) - Bern (Switzerland), project n°485, “Deciphering compositional processes in inner airless bodies of our Solar System” selected in the framework of the ISSI-call for proposal 2019.
References: [1] Feierberg, M.A., Drake, M.J., 1980, Science 209. [2] McCord, T. B., et al., 1970, Science 168. [3] Special Issue: The Geology of Vesta, Icarus 244. [4] De Sanctis et al., 2012, Science. [5] Sivakumar, V., 2017. Geoscience Frontiers 8. [6] Izenberg, N., et al., 2014, Icarus 228. [7] Sierks, M. et al., 2011, Space Sci. Rev. 163. [8] De Sanctis et al., 2011, Space Sci. Rev. 163. [9] https://pds-smallbodies.astro.umd.edu/data_sb/target_asteroids.shtml#4_Vesta. [10] Carrozzo, F. G., et al., 2016, Rev. of Sci. Instr. 87. [11] Rousseau, B. et al., 2020, Rev. of Sci. Instr. 91. [12] Schröder, S. E., et al., 2013, Planetary and Space Science 85. [13] https://ode.rsl.wustl.edu/moon/. [14] https://pds-imaging.jpl.nasa.gov/documentation/Isaacson_M3_Workshop_Final.pdf. [21] Besse, S. et al., 2013, Icarus, 222. [15] https://messenger.jhuapl.edu/Explore/Images.html#global-mosaics. [16] https://pds-geosciences.wustl.edu/missions/messenger/mascs.htm. [17] S. Noble et al., 2005, MAPS, [18] C.M. Pieters and S.K. Noble, 2016. JGR. [19] Ammannito, E., et al., 2013, Nature, [20] Ruesch, O., et al., 2014, JGR 119, [21] Palomba, E. et al., 2015, Icarus 258.
How to cite: Zambon, F., Brunetto, R., Combe, J.-P., Klima, R., Rubino, S., Stephan, K., Tosi, F., Besse, S., Barraud, O., Carli, C., Donaldson-Hanna, K., Krohn, K., Nava, J., Pratesi, G., and Rothery, D.: New updates from ISSI project n° 485, Deciphering compositional processes in inner airless bodies of our Solar System, Europlanet Science Congress 2022, Granada, Spain, 18–23 Sep 2022, EPSC2022-666, https://doi.org/10.5194/epsc2022-666, 2022.
Past, present and future small body missions include onboard accelerometers that are used either by main spacecraft during surface interactions such as sampling or touching the surface [1-2], or by lander packages deployed to the surface [3-6]. All surface interactions provide a wealth of information about the behaviour and the properties of surface materials but accelerometer data is particularly valuable. However, particular care must be taken to correctly account for the low gravity environment when interpreting the measurements. As long as the proper (Froude number) scaling is applied, the collision duration and penetration depth derived from the acceleration data can be used to infer surface properties such as the internal friction angle or the bulk density of the material [7].
Previous work has demonstrated the link between collision velocity and peak acceleration in both terrestrial and low-gravity experimental trials [8-9]. Here we will present recent experimental results investigating the link between accelerometer data and the surface properties. The collision velocity is adjusted by modifying the drop height of the projectile and impacts are performed into several different surface materials (Fig. 1).
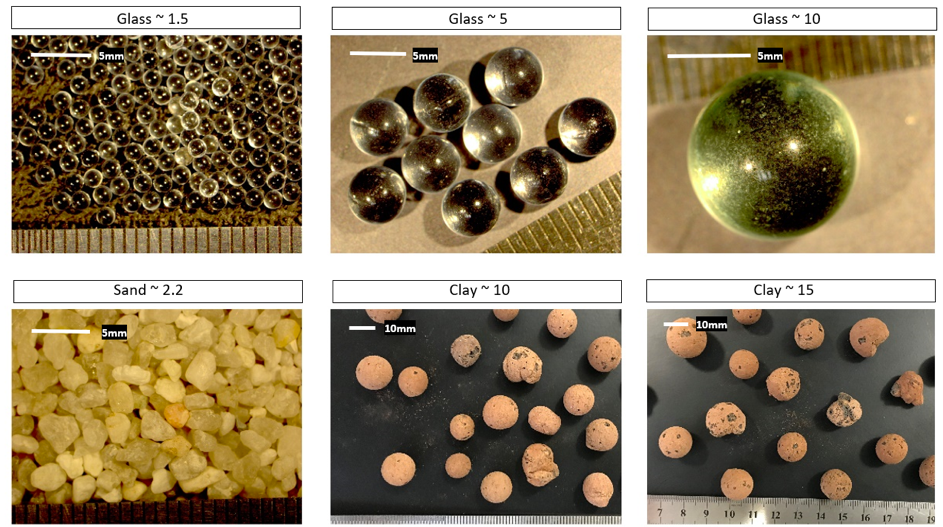
Figure 1. The granular materials used in the experimental trials
To obtain the in-situ acceleration profile during the collision, we use a projectile that contains an accelerometer. We apply the same data processing for the accelerometer measurements as used in previous work [8-9] to extract the drop height (zdrop), the collision velocity (vc), the collision duration (tstop) and the peak acceleration (apeak). In addition, we also extract the time between the instant the projectile makes contact with the ground and the moment when the projectile is at its peak acceleration (tpeak), the mean amplitude of acceleration fluctuations after the peak acceleration, and the frequency of these fluctuations (Fig. 2). As noted in previous work [10,11], the acceleration profiles have a clear dependence on particle size (Fig. 3). In this talk we will present new experimental results and discuss the information that can be extracted from accelerometers about the surface properties during .
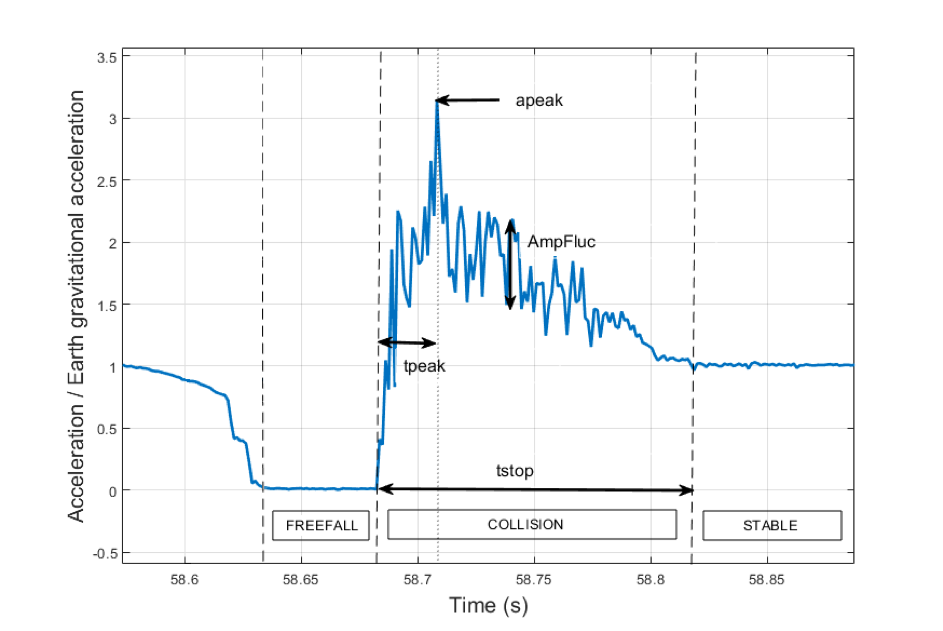
Figure 2: Typical profile measured by an in-situ accelerometer in a spherical projectile during an impact into granular material. See text for description of the variables indicated.
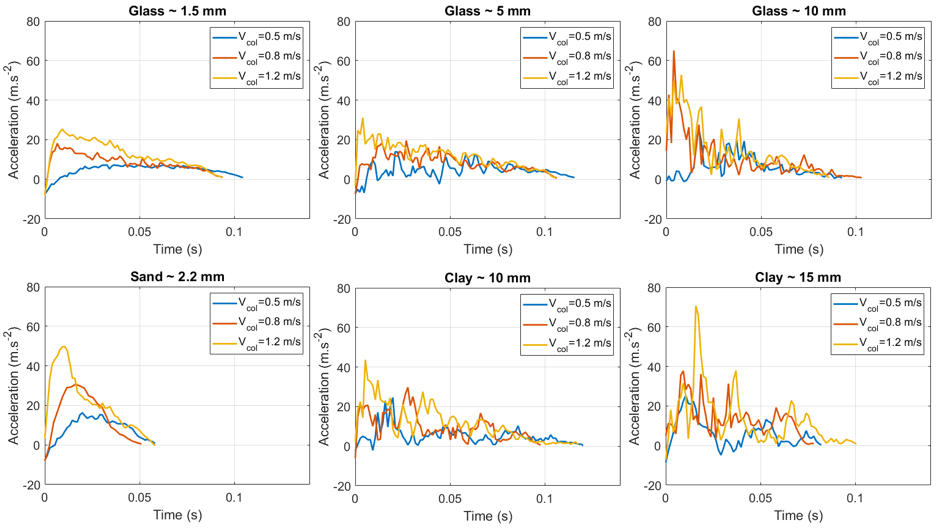
Figure 3: Acceleration profile during the impacts with different granular materials, and different collision velocities: 0.5 m/s (blue), 0.8 m/s (red), 1.2 m/s (yellow).
Acknowledgements
The authors acknowledge funding support from the European Commission's Horizon 2020 research and innovation programme under grant agreement No 870377 (NEO-MAPP project). This project also received funding from the Centre National d'Etudes Spatiales (CNES) and CS acknowledges PhD research grant funding from ISAE-SUPAERO.
References:
[1] Lauretta, D.S. and the OSIRIS-REx Team, 2021, March. The OSIRIS-REx Touch-and-Go Sample Acquisition Event and Implications for the Nature of the Returned Sample. In Lunar and Planetary Science Conference (No. 2548, p. 2097).
[2] DellaGiustina D., et al. 2022, OSIRIS-APEX: A PROPOSED OSIRIS-REX EXTENDED MISSION TO APOPHIS, Apophis T-7 Years 2022 (LPI Contrib. No. 2681)
[3] Lorenz, R.D., et al. 2009. Titan surface mechanical properties from the SSP ACC–I record of the impact deceleration of the Huygens probe.
[4] Biele, J., Ulamec, S., Maibaum, M., Roll, R., Witte, L., Jurado, E., Muñoz, P., Arnold, W., Auster, H.U., Casas, C., Faber, C., and others, 2015. The landing (s) of Philae and inferences about comet surface mechanical properties. Science, 349(6247), p.aaa9816.
[5] Michel et al., 2022, The ESA Hera mission: Detailed characterisation of the DART impact outcome and of the binary asteroid (65803) Didymos, The Planetary Science Journal (accepted)
[6] Michel, P., et al. 2022, The MMX rover: performing in situ surface investigations on Phobos. Earth Planets Space 74, 2
[7] Sunday, C., et al. 2022. The influence of gravity on granular impacts-II. A gravity-scaled collision model for slow interactions. Astronomy & Astrophysics, 658, p.A118.
[8] Murdoch, N., et al. 2017. An experimental study of low-velocity impacts into granular material in reduced gravity. Monthly Notices of the Royal Astronomical Society, 468(2), pp.1259-1272.
[9] Murdoch, N., et al. 2021. Low-velocity impacts into granular material: application to small-body landing. Monthly Notices of the Royal Astronomical Society, 503(3), pp.3460-3471.
[10] Clark et al., 2013, Granular impact dynamics: Fluctuations at short time-scales, AIP Conference Proceedings 1542, 445-448
[11] Duchêne, A., et al. 2022, A Machine Learning Approach For Estimating Asteroid Surface Properties from Accelerometer Measurements, Lunar and Planetary Science Conference 2022, no. 1563
How to cite: Murdoch, N., Duchêne, A., Segovia-Otera, J., Drilleau, M., Stott, A., and Sunday, C.: What can we learn from an in-situ accelerometer during surface interactions?, Europlanet Science Congress 2022, Granada, Spain, 18–23 Sep 2022, EPSC2022-910, https://doi.org/10.5194/epsc2022-910, 2022.
SB9 | Latest Science Results in Planetary Defence
The impact processes are ubiquitous in the solar system, as one of the fundamental mechanisms driving the evolution of asteroids and comets[1]. From small meteorite impacts to gigantic Moon-forming collisions[2], the impact cratering formation holds key insights pointing out the dynamic history of our solar system from 4.5 billion years ago. Thanks to the rapid progress in numerical modeling and computational resources, high-resolution numerical models offer a powerful framework for expanding our knowledge of the impact cratering phenomena. Meanwhile, planetary defense missions have steeply advanced in characterizing Near-Earth Objects (NEO), such as NASA's upcoming DART mission[3], which will deflect the orbit of Dimorphos through a kinetic impactor. A few years after the DART impact, the Hera mission by European Space Agency (ESA)[4] will rigorously portray the consequences of the collision, from cratering to exploring the interior and dynamics. Several numerical efforts have recently provided significant insights on impact cratering and ejecta dynamics in response to the DART impactor. Raducan et al. (2019)[5], for example, have comprehensively reported several factors that affect the Dimorphos' response, from target layering and strength[6] to the projectile obliquity[7]. In the present study, after verifying our results using the impactor/target constraints[5-7], we have further examined the consequences of DART impact, focusing more on the impact-generated porosity and gravity anomalies. To accomplish this, we performed hypervelocity impact simulations by the iSALE2D shock physics code[8-10] set up for a variety of target scenarios, ranging from low-cohesion gravity-dominated to high-cohesion stress-dominated regimes. Our simulation results shed new light on the detailed picture of cratering formation in the aftermath of the DART impact.
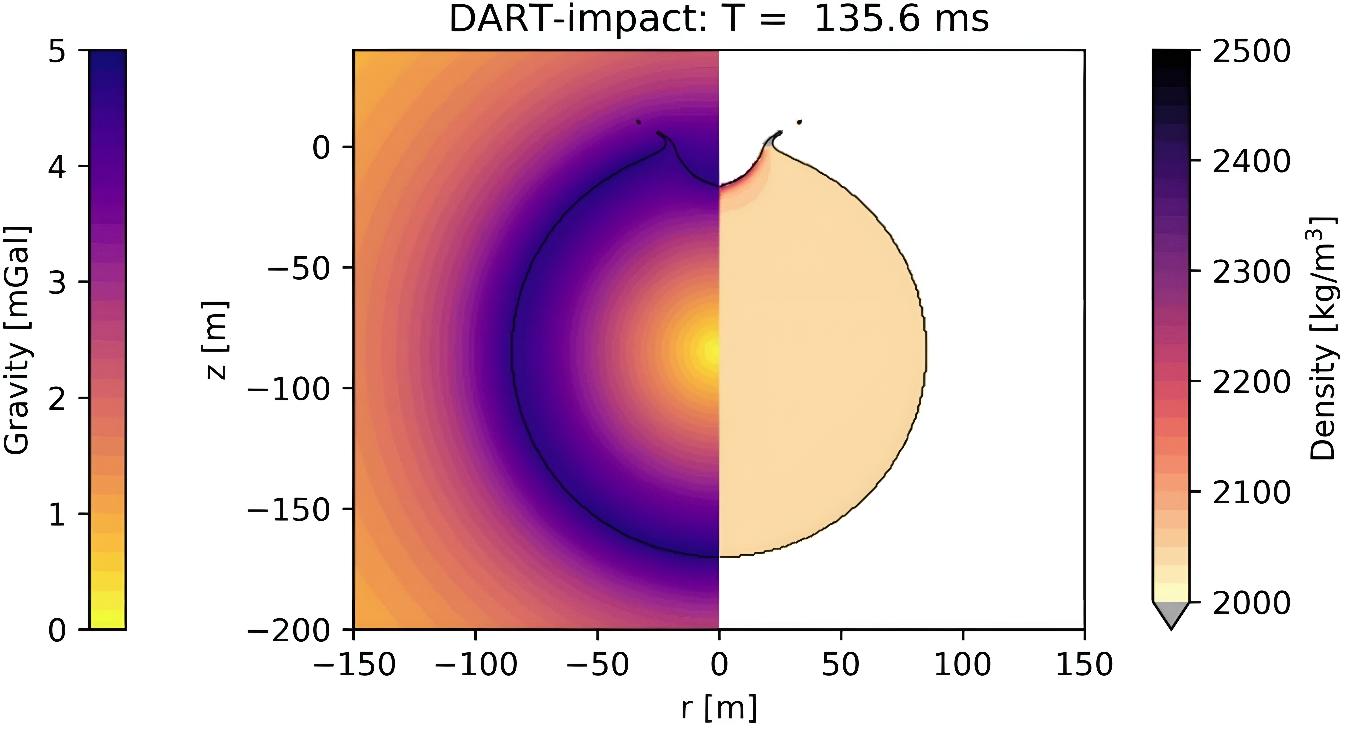
Figure 1: DART impact-generated gravity and density distribution on asteroid Dimorphos.
References
[1] Holsapple, K. A. (1993). The scaling of impact processes in planetary sciences. Annual review of earth and planetary sciences, 21(1), 333-373.
[2] Wada, K., Kokubo, E., & Makino, J. (2006). High-resolution simulations of a Moon-forming impact and postimpact evolution. The Astrophysical Journal, 638(2), 1180.
[3] Michel, P., Küppers, M., & Carnelli, I. (2018). The Hera mission: European component of the ESA-NASA AIDA mission to a binary asteroid. 42nd COSPAR Scientific Assembly, 42, B1-1.
[4] Cheng, A. F., Rivkin, A. S., Michel, P., ... & Thomas, C. (2018). AIDA DART asteroid deflection test: Planetary defense and science objectives. PSS, 157, 104-115.
[5] Raducan, S. D., Davison, T. M., Luther, R., & Collins, G. S. (2019). The role of asteroid strength, porosity and internal friction in impact momentum transfer. Icarus, 329, 282-295.
[6] Raducan, S. D., Davison, T. M., & Collins, G. S. (2020). The effects of asteroid layering on ejecta mass-velocity distribution and implications for impact momentum transfer. PSS, 180, 104756.
[7] Raducan, S. D., Davison, T. M., & Collins, G. S. (2022). Ejecta distribution and momentum transfer from oblique impacts on asteroid surfaces. Icarus, 374, 114793.
[8] Amsden, A., Ruppel, H., and Hirt, C. (1980). SALE: A simplified ALE computer program for fluid flow at all speeds. Los Alamos National Laboratories Report, LA-8095:101p. Los Alamos, New Mexico: LANL.
[9] Collins, G. S., Melosh, H. J., and Ivanov, B. A. (2004). Modeling damage and deformation in impact simulations. Meteoritics and Planetary Science, 39:217--231.
[10] Wünnemann, K., Collins, G., and Melosh, H. (2006). A strain-based porosity model for use in hydrocode simulations of impacts and implications for transient crater growth in porous targets. Icarus, 180:514--527.
How to cite: Senel, C. B. and Karatekin, O.: Hypervelocity impact simulations of DART on asteroid Dimorphos: Impact-generated porosity and gravity anomalies, Europlanet Science Congress 2022, Granada, Spain, 18–23 Sep 2022, EPSC2022-404, https://doi.org/10.5194/epsc2022-404, 2022.
Science rationale: Our knowledge of the internal structure of asteroids entirely relies on inferences from remote sensing observations of the surface combined with theoretical modeling [1]. Is Apophis a rubble-pile, as expected, or a monolithic rock, and how high is the porosity? What is the typical size of the constituent blocks? Are these blocks homogeneous or heterogeneous? If Apophis is bilobed, how does the material differ between each lobe?
After many asteroid rendezvous and fly-by missions from different nations, these crucial and yet basic questions remain open. Direct measurements of the deep interior structure and composition are needed to better understand the accretion and dynamical evolution of asteroids in general. These measurements at Apophis in particular will directly improve our ability to understand and predict stability conditions as well as to interpret the response of Apophis to the tidal forces induced by its close approach to the Earth. This information is also crucial to plan any interaction of a spacecraft with Apophis and other similar asteroids, especially for Planetary Defense purposes.
Direct observations of asteroid subsurfaces in general are also required to better model the dynamics of granular materials in low gravity, and to determine material composition and mineralogy, while space weathering and thermal cycling alter surface properties as observed by optical remote sensing.
DROID mission concept: Radar observation of Apophis from a spacecraft is the most mature technique capable of achieving these objectives, by providing a direct measurement of its interior. This is the goal of DROID – (Distributed Radar Observations of Interior Distributions), a mission concept developed in collaboration between NASA JPL and CNES [2] and discussed in more detail in the accompanying presentation [3].
The DROID mothership will release two CubeSats each carrying a low-frequency radar. The radar will be a version of JuRa (60 MHz) [4], modified to operate in a bistatic mode and using an inter-satellite link as a synchronization channel. The mothership and the two CubeSats (daughtercraft) will also have cameras for both science and navigation.
Radar observation: Each daughtercraft radar can operate in a monostatic mode, or in a bistatic mode using the two platforms to measure the signal transmitted throughout Apophis, as CONSERT did onboard Rosetta orbiter and Philae lander [1,5,6,7].
Monostatic radar. A radar at 60 MHz offers a larger penetration (up to 100 meters or more) with a limited resolution (≈5 m). It corresponds to the instrument under implementation for the Juventas Cubesat on the Hera/ESA mission [4].
Furthermore, multi-pass processing allows us to build a 3D tomographic image of the interior to identify internal structure like layers, voids and sub-aggregates, to bring out the aggregate structure and to characterize its constituent blocks in terms of size distribution and heterogeneity at different scales (from sub-metric to global). Initial dynamics modeling of the two Cubesats orbiting Apophis at 3 body radii indicates that 20% full Doppler coverage is possible in 40 days [2,8].
Shallow subsurface characterization and radar images to support the shape modeling are also possible in this configuration, but with degraded performance due to a limited resolution.
Bistatic radar. The bistatic radar will firstly measure the signal in transmission, allowing us to achieve a direct measurement of the dielectric permittivity, which is related to composition and microporosity [6]. This objective is less demanding in terms of data volume and operation compared to full bistatic coverage. Partial transmission coverage will provide slices of the body with average characterization and its special variability. With dense coverage, benefiting from a larger diversity of observation angles, the bistatic mode will allow a complete 3D tomography [8,9]. In general, multi-angular acquisition allows for a better decorrelation of the size effect and permittivity contrast in the return power.
Ground-to-space: In addition to radar observation at close proximity, there is the possibility for joint ground-to-space radar observations at the epoch of the Apophis close approach. [10]. Such measurements would make use of high-power transmitters or sensitive radio astronomy observatories on Earth [11]. Ground-to-space configurations would be used to collect echoes in unique bistatic configurations or to collect echoes during spacecraft maneuvers at close approach (e.g., required spacecraft stand-off).
Acknowledgement: The research was carried out in part at the Jet Propulsion Laboratory, California Institute of Technology, under a contract with the National Aeronautics and Space Administration (80NM0018D0004).
References:
[1] A. Herique et al. (2018) ASR 62, 2141‑2162., [2] R. Amini et al. (2022) Apophis T-7, #2012, [3] C. Raymond et al. (2022) this meeting., [4] A. Herique et al. (2022) JuRA radar, EPSC, [5] W. Kofman et al. (2015) Science 349, aab0639.,[6] Herique et al. (2016) MNRAS 462, S516‑S532., [7] A. Herique et al. (2019) A&A 630, A6., [8] M. Haynes et al. (2021) ASR 68 (9), [9] M. Haynes et al. (2021) LPSC #1295, [10] A. Herique et al. (2019) Apophis T-9 #2029, [11] M. Haynes et al (2022) Apophis T-7 #2020
How to cite: Herique, A., Adell, P., Amini, R., Davidsson, B., Haynes, M., Fesq, L., Lorda, L., Michel, P., Raymond, C., and Verdier, N.: DROID: Bistatic low-frequency radar sounding of 99942 Apophis in 2029, Europlanet Science Congress 2022, Granada, Spain, 18–23 Sep 2022, EPSC2022-474, https://doi.org/10.5194/epsc2022-474, 2022.
The ESA HERA mission approved by the last ESA council Space19+ will be launched in 2024 to deeply investigate the Didymos binary system and especially its moonlet [1]. Onboard the Juventas small platform, The Juventas Radar -JuRa- will fathom Didymoon and provide the first direct observation of an asteroid deep interior. The characterization of the asteroids’ internal structure is crucial for science, planetary defense and exploration [2].
In 2022, DART/NASA will impact the moonlet to quantify the mechanical response of the body, mainly from ground-based observation [3]. Five years later, HERA/ESA is a unique opportunity to observe in detail the bodies, the crater and the ejecta in order to better constrain mechanical models providing a global characterization of the binary system: shape, density, dynamic properties, thermal properties and composition [4]. The Hera mothercraft will carry two CubeSats, Juventas and Milani. The small spacecraft Juventas will investigate the asteroids’ internal structure. Information about the internal structure is crucial for science, planetary defense and exploration since our current knowledge relies entirely on inferences from remote sensing observations of the surface and theoretical modeling [2].
JuRa is a monostatic radar, BPSK coded at 60MHz carrier frequency and 20MHz bandwidth, inherited from CONSERT/Rosetta [5], [6] and redesigned in the frame of the AIDA/AIM phase A/B [4], [7]. The instrument design is under validation for a flight model delivery end of 2022.
JuRa maps the backscatter coefficient (sigma zero - s0) of the surface or subsurface, which quantifies the returned power per surface or volume unit. It is related to the degree of heterogeneity at the scale of the wavelength and to the dielectric contrast of heterogeneities, giving access to both, the sub-meter texture of the constituent material and larger scale structures.
- The first objective of JuRA is to characterize the moonlet’s interior, to identify internal geological structure such as layers, voids and sub-aggregates, to bring out the aggregate structure and to characterize its constituent blocks in terms of size distribution and heterogeneity at from submetric to global scale.
- The second objective is to estimate the average permittivity and to monitor its spatial variation in order to retrieve information on its composition and porosity. Radar bypasses the near surface alteration by space-weathering and thermal-cycling as observed with optical remote sensing. The observation of the structure and composition of the moonlet will provide constraints on the mechanical model of the impact process.
- The same characterization applied to the main asteroid of the binary system is among the secondary objectives, to detect differences in texture and composition. When compared to the observation of the moonlet, it will constraint the model of binary system formation to discriminate between progressive versus catastrophic process and more generally on the stability conditions of the system.
In this talk, we will review the JuRa science objectives and the instrument development status. We will show the results of the model end-to-end tests and the corresponding instrument performances. Then we will present the proposed operation strategy and the developed approaches for data processing.
Acknowledgments
- Hera is the ESA contribution to the AIDA collaboration.
- Juventas and JuRa are developed under ESA contract supported by national agencies.
- JuRa is built by Emtronix (LU), UGA/IPAG (FR), TU Dresden (DE), Astronika (PL) and FZ (CZ). Juventas is built by Gomspace (LU). Juventas navigation plan is developed by GMV (RO)
- This project has received funding from the European Union’s Horizon 2020 research and innovation program under grant agreement No 870377 (project NEO-MAPP).
References
[1] P. Michel et al., « European component of the AIDA mission to a binary asteroid: Characterization and interpretation of the impact of the DART mission », Advances in Space Research, vol. 62, no 8, p. 2261‑2272, oct. 2018, doi: 10.1016/j.asr.2017.12.020.
[2] A. Herique et al., « Direct observations of asteroid interior and regolith structure: Science measurement requirements », Advances in Space Research, vol. 62, no 8, p. 2141‑2162, oct. 2018, doi: 10.1016/j.asr.2017.10.020.
[3] A. F. Cheng et al., « Asteroid Impact & Deflection Assessment mission: Kinetic impactor », Planetary and Space Science, vol. 121, p. 27‑35, févr. 2016, doi: 10.1016/j.pss.2015.12.004.
[4] P. Michel et al., « Science case for the Asteroid Impact Mission (AIM): A component of the Asteroid Impact & Deflection Assessment (AIDA) mission », Advances in Space Research, vol. 57, no 12, p. 2529‑2547, juin 2016, doi: 10.1016/j.asr.2016.03.031.
[5] W. Kofman et al., « The Comet Nucleus Sounding Experiment by Radiowave Transmission (CONSERT): A Short Description of the Instrument and of the Commissioning Stages », Space Science Reviews, vol. 128, no 1‑4, p. 413‑432, mai 2007, doi: 10.1007/s11214-006-9034-9.
[6] W. Kofman et al., « Properties of the 67P/Churyumov-Gerasimenko interior revealed by CONSERT radar », Science, vol. 349, no 6247, p. aab0639, juill. 2015, doi: 10.1126/science.aab0639.
[7] A. Herique et al., « A radar package for asteroid subsurface investigations: Implications of implementing and integration into the MASCOT nanoscale landing platform from science requirements to baseline design », Acta Astronautica, mars 2018, doi: 10.1016/j.actaastro.2018.03.058.
How to cite: Herique, A., Plettemeier, D., and Kofman, W. and the JuRa Team: JuRa: the Juventas Radar on Hera to fathom Didymoon, Europlanet Science Congress 2022, Granada, Spain, 18–23 Sep 2022, EPSC2022-487, https://doi.org/10.5194/epsc2022-487, 2022.
Asteroids have inhabited the Solar System since its formation, and some of them may pose risks to life on Earth due to the possibility of collision with our planet. The most emblematic case of a catastrophic impact, with very significant implications for life, is the asteroid that struck the Earth 66 million years ago, forming the Chicxulub crater in the Gulf of Mexico, and causing the extinction of about 75% of all life forms on Earth. But despite this and several other events that continue to occur on smaller scales, this theme is rarely addressed by sciences, especially in Brazil. When approached by the press, it is usually under an alarmist and poorly grounded from the point of view of science.
This research aimed to analyze the level of awareness related to the importance of planetary defense among university students, as well as on ways to properly communicate the characteristics and risks related to this phenomenon to society. Besides searching for ways to defend the Earth from a possible future cosmic impact, one of the main goals of Planetary Defense is to make the population aware of its characteristics, frequency of occurrence, risks and consequences.
We focused on this subject using Science communication strategies, such as the creation of an Instagram page, where it was sought and perfected to put together posts about Planetary Defense in a simple way to reach non-specialist audiences. Thus, forms and languages have been sought to convey the facts surrounding meteoritic impacts in a way that they can be understood by the population, thus attracting the necessary attention and avoiding possible misinformation and/or panic.
We employed a semi-quantitative methodology that begins by presenting what asteroids and comets are, showing simulations of large impact events, and detailing physical phenomena arising from encounters between asteroids and the Earth. Measures to protect the planet were also analyzed and how institutions such as NASA (National Space Agency, United States) and ESA (European Space Agency, European Community) have contributed with research and equipment for planetary defense.
In addition, we combined this methodology with a semi-structured survey questionnaire. The survey was aimed at investigating society's perception of the potential risks of impacts of celestial bodies against the Earth, using students enrolled at the State University of Campinas (Unicamp, Brazil). as a sampling population.
The survey´s results refer to a total 150 responses, Fig. 1 shows that the large majority of the UNICAMP’ students don’t have previous knowledge of the concept of Planetary Defense, and that they also do not consider the topic as relevant. This shows the need for awareness dissemination regarding the risk of asteroid impacts, the only natural disaster that can be predicted in advance.
Figure 1: Survey questionnaire about society's perception of the potential risks of impacts of celestial bodies against the Earth.
As part of the study, a series of activities were developed at the University of Campinas to mark Asteroid Day 2022, celebrated annually on June 30th. During two days, a number of guest speakers presented topics related to Planetary Defense to an audience comprising Unicamp´s students and faculty members, as well as the general public, mostly high-school students and school teachers. The results contributed significantly for raising the awareness about planetary defense and for disseminating the scientific knowledge on asteroid impacts and their risk to Earth and to humankind.
Still part of Asteroid Day 2022, a series of interactive activities were developed with children at the city of Campinas Planetarium. These included workshops on rocket launching towards "asteroids", for transmitting the concept of the DART Mission to the kids and their parents. Presentations were also made on general themes about planetary sciences, as well as an astrophotography workshop held at the Campinas Municipal Observatory.
Although the study is still in progress, our preliminary conclusions are that there is very scarce knowledge of what Planetary Defense is, or recognition of its importance, even among higher education students of one of the most prestigious universities in Brazil. This shows how much Planetary Sciences are undervalued, and particularly, the theme of Planetary Defense. We expect that, by the end of this study, adequate ways will be exploited for disseminating knowledge on these topics.
How to cite: Mistro, M. E. T., Crosta, A. P., Costa, J. O. P., and Schmidt, S. C.: Planetary Defense: Public Perception and How to Communicate, Europlanet Science Congress 2022, Granada, Spain, 18–23 Sep 2022, EPSC2022-682, https://doi.org/10.5194/epsc2022-682, 2022.
The NEO Coordination Centre (NEOCC) is one of the key components of ESA’s Planetary Defence activities. Among its goals, it has a mandate to coordinate, collect and analyse telescopic observations of NEOs. To reach this objective, we developed a wide network of observational assets. In this contribution, we discuss some of the latest results obtained thanks to this unique global network.
In the recent years, ESA has strengthened its network of follow-up telescopes. It now has direct access to the Optical Ground Station (Tenerife, Spain) and the Calar Alto Schmidt telescope (fully dedicated to NEOCC activities - Spain). Via dedicated contracts, it also has allocated time in the LCO network, as well as telescopes in Australia (Zadko), Namibia (6ROADS), Reunion and India. Scientific collaboration & agreements granted time with ESO’s VLT and Korean’s BOAO and SOAO facilities.
Regarding future observational means, ESA is currently continuing the construction of the Flyeye telescope. This is a 1-meter class telescope with an ultra-wide field of 7º by 7º that will be installed on top of Monte Mufara (Italy). The Flyeye will be a remote-controlled telescope, while data will be automatically analysed by a dedicated pipeline, with the overall objective of reducing to a minimum the human intervention.
The mentioned observational assets available to our observers are used for a variety of observations. The main goal is of course the acquisition of follow-up observations, both on short notice and at the faint end of an object's observability window. We employ our smaller but geographically-distributed telescopes to quickly react to discoveries of possible new high-priority objects, such as imminent impactors. Larger assets, such as VLT, are instead routinely scheduled to obtain astrometry of risk list objects, down to magnitude ~27. With some specific telescopes we are also focusing on twilight and low-elongation observations, which are essential to track and characterize specific classes of objects, such as Atiras or Earth Trojans.
In addition to these regular observations, we also use some of the telescopes to attempt challenging or innovative observation techniques. For example, we are experimenting with the possibility to use modest sub-meter-size telescopes to obtain detections of important objects down to magnitude ~24, by observing the same target for an entire night and then stacking hundreds of frames on the motion of the object. These capabilities are made possible by recent advancements in GPU processing, which are also opening the way to new image analysis modes, such as synthetic tracking. We are also pioneering the so called "negative recovery" technique, using targeted non-detections of risk list objects to exclude their impact solutions, even without recovering the object itself.
Finally, we are active players in international campaigns dedicated to specific NEOs or observational challenges. This includes both our participation in internationally-led efforts, such as those managed by IAWN, and the organization of our own campaigns, such as a recent one dedicated to the astrometric coverage of the Earth fly-by of BepiColombo as a proxy to test the observational capabilities of our network on very close approachers.
All those observations are supplemented by the operations of our own orbit determination and impact monitoring software system (so-called AstOD) that allows constraining with the best possible accuracy the orbits of the observed objects and the possible impact chances with the Earth in the next 100 years. In what regards the threat monitoring over imminent impactors, we count on the Meerkat tool, which bases its automated operation on the use of systematic ranging and allows detecting and warning our staff of those cases, as recently occurred with 2022 EB5.
How to cite: Cano, J. L., Micheli, M., Conversi, L., Fohring, D., Moissl, R., Koschny, D., Faggioli, L., Gianotto, F., Kresken, R., Ramirez Moreta, P., Oliviero, D., Petrescu, E., Rudawska, R., and Frühauf, M.: Recent observational highlights from ESA’s Planetary Defence Office, Europlanet Science Congress 2022, Granada, Spain, 18–23 Sep 2022, EPSC2022-1084, https://doi.org/10.5194/epsc2022-1084, 2022.
Understanding of shallow angle impacts (termed "oblique") comes from planetary bodies other than Earth, and also comes from modelling published by various workers over the past two decades or so. Another comparator source is the Southern Mt Lofty Ranges and Kangaroo Island impact in South Australia, which has not been dated other than being >35 mya. At previous conference attendances the case has been built that the oblique impact in SA was from the south rather than in the plane of the ecliptic, which raises the new question how common is such an event in the solar system. A digital elevation model from the Mars Orbiter Laser Altimeter has here been used to assess the occurrences of oblique impacts on Mars, focussing on the northern hemisphere. A large impact crater at 7 degrees N / 178 degrees E on Mars matches the criteria and additionally has the same impact approach direction as the Southern Mt Lofty Ranges craters, implying that the orbital plane of that impactor may have been similar or the same as that of the latter. The large scale of the particular crater identified on Mars forces a reassessment of the sizes of additional candidate Australia craters beyond the Southern Mt Lofty Ranges and Kangaroo Island impact sites. A digital elevation model of a central band of Australia, some 600 km wide, is analysed for candidate sites, while indicators of meteorite disintegration during oblique impacts are used to inform the study and to shortlist candidate sites.
How to cite: Moore, R.: Linking a large oblique-impact crater on Mars to the Southern Mt Lofty Ranges multiple impact event in South Australia – inference for latter event size and scope, Europlanet Science Congress 2022, Granada, Spain, 18–23 Sep 2022, EPSC2022-1201, https://doi.org/10.5194/epsc2022-1201, 2022.
SB10 | Observing and modelling meteors in planetary atmospheres
Abstract
In this paper we present the results obtained from the spectral analysis using the wavelet technique of a time series of brightest fireballs to look for periodicities associated with other bodies of our Solar System. The spectra show four periodicities at 106.2 days, 12.7 days, 2.5 days, 10.3 years and 4.6 years. In particular the periodicities around 12.7 and 2.5 days could be related to the Carrington rotation period.
Introduction
One of the main problems of Planetary Sciences is to understand the dynamical behavior of asteroids, meteors and meteoroids inhabiting near our planet, mainly those that fall on terrestrial surface. These bodies feel the planetary and solar gravitational influence when they travel across the interplanetary medium or mainly when they are in the terrestrial neighborhood of one of those bodies. The detection of meteoroids falling on Earth using several instruments has been important because it has permitted to obtain very useful data. The analysis of these data can help to identify the physical interactions that occur between these bodies and the rest of the bodies in the solar system. Additionally in recent decades, multiple modeling and numerical simulation works have been carried out to fully understand the origin of such interactions.
The spectral method
A time series of brightest fireballs from January, 1998 to December, 2020 was spectrally studied using the wavelet technique to look for periodicities related with Solar System bodies relationships. The data were taken from the Near Earth Object Program (https://cneos.jpl.nasa.gov/fireballs). Because of this time series has gaps, the wavelet transform was used to do the spectral analysis. The method was applied using the Morlet function (eq. 1) [1] to analyze the power spectral density (PSD) of brightest fireball meteors [1], [2], [3].
![]() (1)
(1)
Where ω0 and η are both non-dimensional frequency and time parameter respectively
Results and discussion
Five periodicities were identified from the wavelet spectral analysis (figure 1). They are located at 2.5 days, 12.7 days, 106.2 days, 4.6 years and 10.3 years. The figure 1 shows the power spectral density spectra (PSD) where these periodicities can be seen on the right side of the plot. They are inside the cone of influence (COI) and were obtained with a confidence level of 85%. The uncertainties of every peak position were obtained from the peak full width at half maximum.
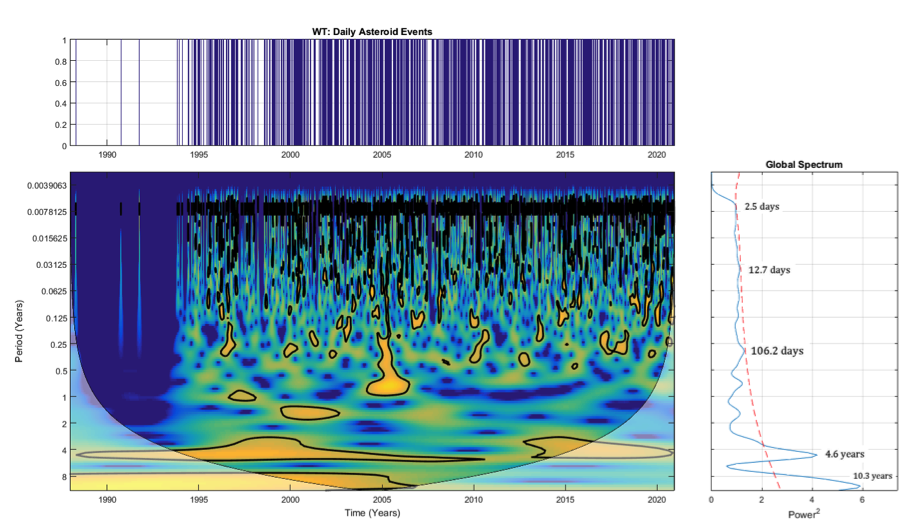
Figure 1: PSD of a time series of brightest fireballs from January, 1998 to December, 2020. On the right side of the plot, five peaks at 2.5, 12.7 and 106.2 days and at 4.6 and 10.3 years are shown.
In particular the periodicity around 12.7 days could be the first harmonic of the Carrington rotation period (27 days), [4] indicating that the solar gravitational force could be modulating the meteoroids entrance on the Terrestrial atmosphere. Carrington rotation has been detected in several time series as is the case of solar spots, storm sudden commencements, cosmic rays, among others. The periodicity around 2.5 days, it could be a small harmonic of the solar rotation period.
The mechanism behind the relationship between the variable solar radiation (due to its rotation and the solar cycle) and the fall of small asteroids to Earth´s atmosphere could be associated to the Yarkovsky and /or YORP effects. Several works have shown that the solar radiation is able to modify asteroidal orbits and rotational periods [5, 6], and it is possible that the periodicity in the variability of this radiation be the cause of periodicities in the falling of asteroidal material observed in this work. Respect to the periodicities around 4.6 and 10.3 years, they could be related to the magnetic solar cycle. The 4.6 years periodicity could be related to Jupiter too. According to NASA (https://solarsystem.nasa.gov/planets/jupiter/overvie w/), the Jupiter orbital period is 4333 Earth days, so the ratio between this period and 1679 Earth days (̴ 4.6 year period) is almost 13/5.
Summary and Conclusions
1. The Sun could be a gravitational trigger of meteoroids from their neighborhood to Earth.
2. The periodicity around 12.7 days is possible associated with the Carrington rotation as well as the 2.5 days periodicity.
References
[1] Torrence, Ch., Compo, G. P.: A practical guide to wavelet analysis, Bulletin of American Meteorogical Society, vol. 79, No. 1, pp. 61-78, 1998. https://doi.org/10.1175/1520-0477(1998)079<0061:APGTWA>2.0.CO;2
[2] Soon, W., Dutta, K., Legates, D. R., Velasco, V., Zhang, W.: Variation in surface air temperature of China during the 20th century, J. Atmos. Sol-Terr. Phy. 73, pp. 2331-2344, 2011.
[3] Velasco Herrera, V. M., Soon, W., Velasco Herrera, G., Traversi, R., Horiuchi, K.: Generalization of the cross-wavelet function, New Astronomy, 56, pp. 86-93, 2017.
[4] Nayar, S. R. P.: Periodicites in solar activity and their signature in the terrestrial environment, ILWS Workshop 2006, Goa, India, February 19-24, pp. 1-9, 2006.
[5] Farnocchia, D., Chesley, S. R., Takahashi, Y., Rozitis, B., Vokrouhlický, D., Rush, B. P., Mastrodemos, N., Kennedy, B.M., Park, R. S., Bellerose, J., Lubey, D. P., Velez, D., Davis, A.B., Emery, J. P., Leonard, J. M., Geeraert, J., Antreasian, P.G., Lauretta, S.: Ephemeris and Hazard Assessment for Near-Earth Asteroid (101955) Bennu Based on OSIRIS-REx Data, Icarus, 369, https://doi.org/10.1016/j.icarus.2021.114594, 2021.
[6] Zegmott, T. J., Lowry, S. C., Rozek, A., Rozitis, B., Nolan, M. C., Howell, E.S., Green, S. F., Snodgrass, C., Fitzsimmons, A., Weissman, P. R.: Detection of the YORP Effect on the Contact Binary (68346) 2001 KZ66 from Combined Radar and Optical Observations, Monthly Notices of the Royal Astronomical Society. 507, pp. 4914-4932, https://doi.org/10.1093/mnras/stab2476, 2021.
How to cite: Maravilla, D., Pazos, M., and Cordero, G.: Are fireballs fall on Earth modulated by our star?, Europlanet Science Congress 2022, Granada, Spain, 18–23 Sep 2022, EPSC2022-26, https://doi.org/10.5194/epsc2022-26, 2022.
1. Introduction
The Fireball Recovery and Inter Planetary Observation Network (FRIPON) network [1] uses all-sky cameras in order to detect fireballs. The FRIPON network comprises over 150 cameras installed all over Europe [1]. In this work we focus on the results obtained by the Meteorite Orbits Reconstruction by Optical Imaging (MOROI) [2] component of the FRIPON network in Romania. As of May 2022, the MOROI network detects the events with the use of 13 all-sky cameras.
2. Methods
The method for computing the fireball trajectory used by FRIPON is presented in [3].
The height, velocity and slope γ of the meteoroid are the input data for computing the ballistic coefficient α and the mass-loss parameter β. We select the candidates that are likely to produce meteorites of the ground using the α-β algorithm presented in [4], [5], [6], [7].
3. Results
Starting from January 2021 (the starting moment of data fusion of the MOROI network into the FRIPON network) until the present time (May 2022) over 100 meteors were detected. We present the most spectacular events that are likely to result on a meteorite production on the surface of the Earth.

Figure 1: The outcome of the FRIPON (MOROI) detections in Romania
In Figure 1 are represented the coordinates of the meteoroids with noticeable deceleration in the (ln(αsinγ),lnβ) coordinates system. The values of the shape parameter correspond to the cases when the meteoroid doesn’t rotate (µ=0) or rotates uniformly (µ=2/3).
The boundaries (‘likely fall’, ‘possible fall’, ‘unlikely fall’) are represented for meteoroids with final mass of 50 g.
We processed the 100 detections of the FRIPON (MOROI) network in Romania. From this amount of data, we found 15 fireball events with noticeable deceleration. We found one event in the ‘likely fall’ area and three events in the ‘possible fall’ area. The fireball that is likely to produce meteorites was detected by the MOROI network on 24.11.2021 at 19:20:57 UT.
We model the dark flight trajectory of the meteoroids with the ‘likely fall’ and ‘possible fall’ outcomes and determine their strewn field with the model presented in [8], [9]. We use the wind model from the European Centre for Medium-Range Weather Forecasts (ECMWF).
A meteorite recovery campaign will be organised to identify the strewn field area.
Acknowledgement.
The work of IB and MB was partially supported by a grant of the Romanian Ministry of Education and Research, CNCS-UEFISCDI, project number PN-III-P1-1.1-PD-2019-0784, within PNCDI III. The work of IB, MB, AN was partially supported by a grant of the Ministry of National Education and Scientific Research, PNIII-P2-1214/25.10.2021, program no. 36SOL/2021. JM and MG acknowledge the Academy of Finland project no. 325806 (PlanetS).
References:
[1] Colas F., Zanda B., Bouley S., Jeanne S., Malgoyre A., Birlan M., Blanpain C., Gattacceca J., Jorda L., Lecubin J., et al. (385 more) FRIPON: a worldwide network to track incoming meteoroids. Astronomy &. Astrophys. 644, A53. doi:10.1051/0004-6361/202038649. 2020.
[2] Nedelcu D.A., Birlan M., Turcu V., Boaca I., Badescu O., Gornea A., Sonka A.B., Blagoi O., Danescu C., Paraschiv P. Meteorites Orbits Reconstruction by Optical Imaging (MOROI) Network. Romanian Astronomical Journal 28(1), 57 – 65. 2018.
[3] Jeanne, S., Colas, F., Zanda, B., Birlan, M., Vaubaillon, J., Bouley, S., Vernazza, P., Jorda, L., Gattacceca, J., Rault, J. L., Carbognani, A., Gardiol, D., Lamy, H., Baratoux, D., Blanpain, C., Malgoyre, A., Lecubin, J., Marmo, C., Hewins, P. Calibration of fish-eye lens and error estimation on fireball trajectories: application to the FRIPON network. Astronomy and Astrophysics, 627:A78. 2019.
[4] Gritsevich, M. I. The Pribram, Lost City, Innisfree, and Neuschwanstein falls: An analysis of the atmospheric trajectories. Solar System Research.42, 372–390. 2008.
[5] Gritsevich, M.I., Stulov, V.P., Turchak, L.I. Consequences of collisions of natural cosmic bodies with the Earth's atmosphere and surface. Cosmic Research vol.50, no.1, 56-64. 2012.
[6] Sansom, E.K., Gritsevich, M., Devillepoix, H.A.R., Jansen-Sturgeon, T., Shober, P.,
Bland, P.A., Towner, M.C., Cupák, M., Howie, R.M., Hartig, B.A.D. Determining Fireball Fates Using the α-β Criterion. Astrophysical Journal 885(2):115. 2019.
[7] Boaca I., Gritsevich M., Birlan M., Nedelcu, A., Boaca, T., Colas, F., Malgoyre, A.,
Zanda, B., Vernazza P., to be submitted. 2022.
[8] Moilanen, J., Gritsevich, M., Lyytinen, E., Determination of strewn fields for meteorite falls, Monthly Notices of the Royal Astronomical Society 503, 3337–3350. 2021.
[9] Boaca I., Nedelcu A., Birlan M., Boaca T., Anghel S. Mathematical model for the dark-flight trajectory of a meteoroid, Romanian Astronomical Journal, Vol. 31, No. 2. 2021.
How to cite: Boaca, I. L., Moilanen, J., Gritsevich, M., Birlan, M., Nedelcu, A., Boaca, T., Colas, F., Malgoyre, A., Zanda, B., and Vernazza, P.: Analysis of the meteorite-producing fireballs registered by the MOROI component of the FRIPON network, Europlanet Science Congress 2022, Granada, Spain, 18–23 Sep 2022, EPSC2022-160, https://doi.org/10.5194/epsc2022-160, 2022.
Several meteor clusters were observed by the video cameras deployed within the Czech Republic in recent years. Moreover, we also obtained data on another cluster which was detected above the Southern America.
In this talk the basic data on the selected meteor clusters, their atmospheric trajectories, and 3D distribution of the fragments will be provided. For example, a cluster consisting from a fireball and four fainter meteors was observed on August 23, 2020. It was a relatively compact cluster with smaller meteoroids up to 30 kilometres from the main body. Possible origin of the clusters will be discussed, too.
How to cite: Koten, P. and Čapek, D.: Meteor clusters observed by the video technique, Europlanet Science Congress 2022, Granada, Spain, 18–23 Sep 2022, EPSC2022-420, https://doi.org/10.5194/epsc2022-420, 2022.