MITM11
Session assets
Orals: Thu, 22 Sep, 17:30–18:25 | Room Andalucia 1
I will give a brief overview of NASA's Planetary Data Ecosystem (PDE) Independent Review Board's activities and Report and will discuss the Findings and Recommendations related to international collaborations for improving accessibility of data from archiving and preservation, searching and acquiring, and using NASA's Planetary Data.
How to cite: Milazzo, M.: A Brief Overview of NASA's Newly-Instituted Planetary Data Ecosystem., Europlanet Science Congress 2022, Granada, Spain, 18–23 Sep 2022, EPSC2022-80, https://doi.org/10.5194/epsc2022-80, 2022.
Background: Visualizing Mastcam-Z Stereo Reconstructions on Global-to-Local Scale
Mars 2020 Mastcam-Z [1] 3D products enable the visualization and analysis of rocks, outcrops, and other geological and aeolian features. The Planetary Robotics Vision Processing framework PRoViP [2], among others, generates panoramas, textured meshes and derived products from Mastcam-Z sequences on tactical (Sol-by-Sol) time frame. OPCs (Ordered Point Clouds) [3] georeferenced by the cm-level accurate tactical rover localization provided by the Mapping Specialists on the Mars 2020 science team, are loaded in PRo3D (Planetary Robotics 3D Viewer; [4]) for interactive 3D exploration, measurement and annotation. A “scene” contains several OPCs, overlaid to textured HiRISE [5] Digital Terrain Models – DTMs – again OPCs – for large-scale spatial context (Figure 1).
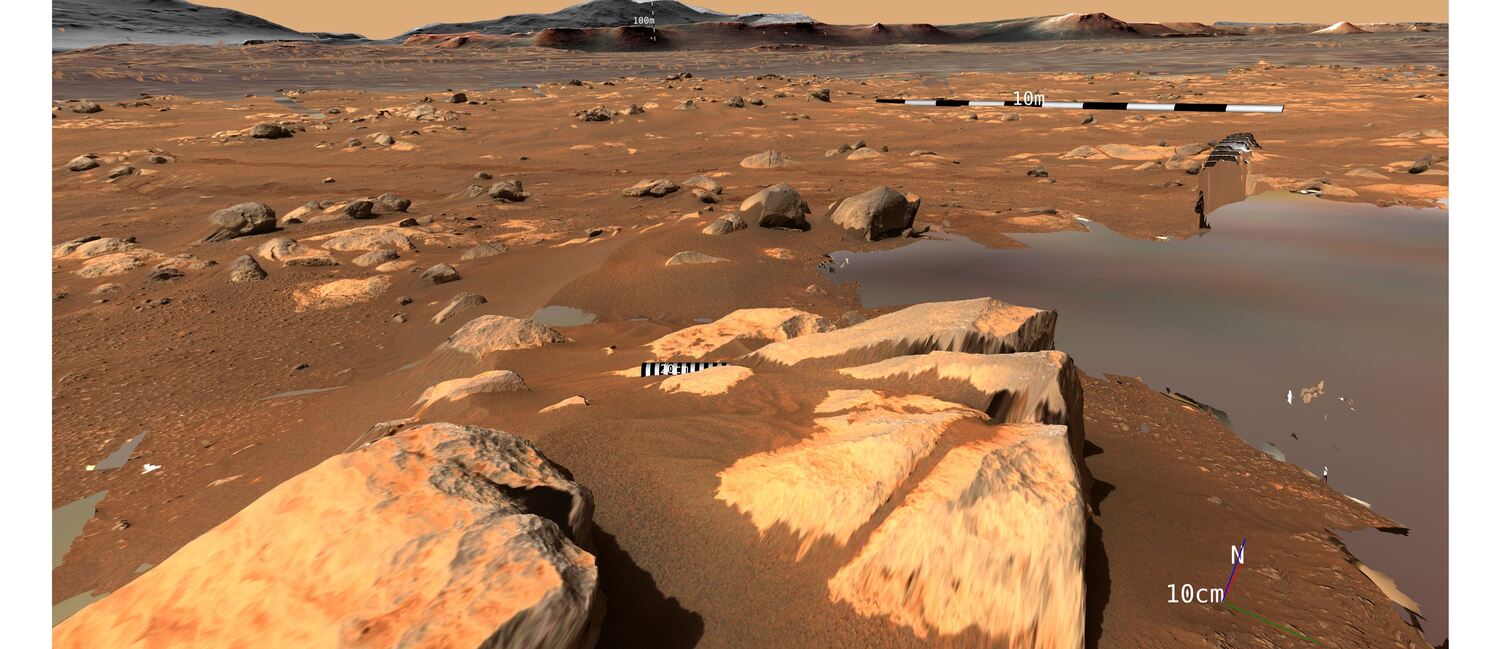
Figure 1: Mastcam-Z Sol 369 OPCs on HiRISE OPC. NASA/JPL/CalTech/USGS/ASU/MSSS/JR/VRVis
Narrative Videos for Immersive Story Telling of Scientific Rationales
A typical workflow to explain physical processes on a planetary surface based on its 3D virtual representation incorporates the following steps:
- A spatial and thematic overview shows the environment in large-scale context, typically in km-scale, involving also the mission progress such as Rover trajectory, local landmark features and scale bars. The latter is true of all steps to follow
- Moving towards a specific region, zooming-in, letting new surface layers appear, or annotating a target of interest attracts attention to a more focused part of the landscape
- Speed & timing of virtual motion (“Navigation” in the scene) varies tension, or allows time for spoken or annotated explanations
- Different viewpoints and smoothly transiting between them highlights specific features.
PRo3D’s Sequenced Bookmarks: Key for Efficient Video Production
PRo3D implements such a workflow in a repeatable way. “Bookmarks” define 3D viewpoints, their sequence, duration and the transition times between them (Figure 2). Disabling/enabling the display of scale bars, individual surfaces and annotations, rover tracks and stations, dip-and-strike annotations, measurements and sky projections of annotations, in conjunction with the embedding of photospheres and multi-temporal surface layers, realizes a comfortable production of highly informative yet ergonomic video stories launched by a “play” button. Up to 8k resolution offline rendering produces smooth videos even on low-budget graphics cards.
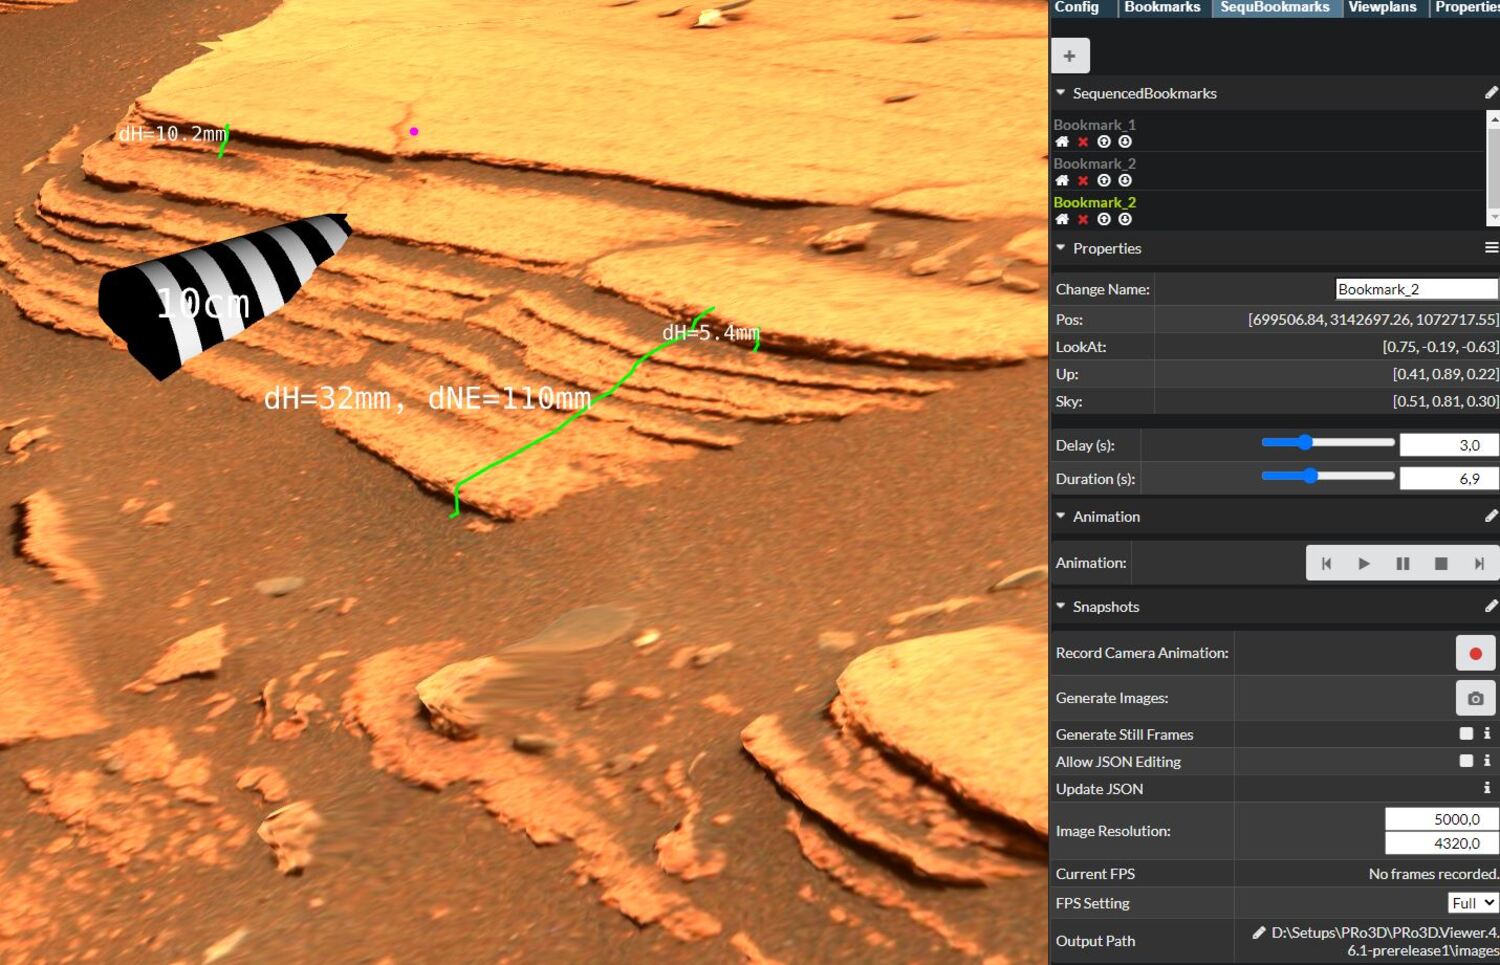
Figure 2: PRo3D Sequenced Bookmarks user interface (Mastcam-Z Sol 422) ASU/MSSS/JR/VRVis
Science Case 1: Explaining the 3D Assessment of Soil Crust
Understanding the Martian soil is critical for future human exploration, and samples that will be returned [6]. 3D observations of cracks, fractures and tracks sheds important light on the crust’s characteristics and extent of induration [7]. Figure 3 shows key frames from a PRo3D video explaining a soil crust assessment process. Important building blocks are the Rover tracks’ depth or the steepness of micro slopes. The viewing direction should be parallel to the rills of the rover tracks, the viewing distance from the Rover and the virtual viewing distance shall be small.
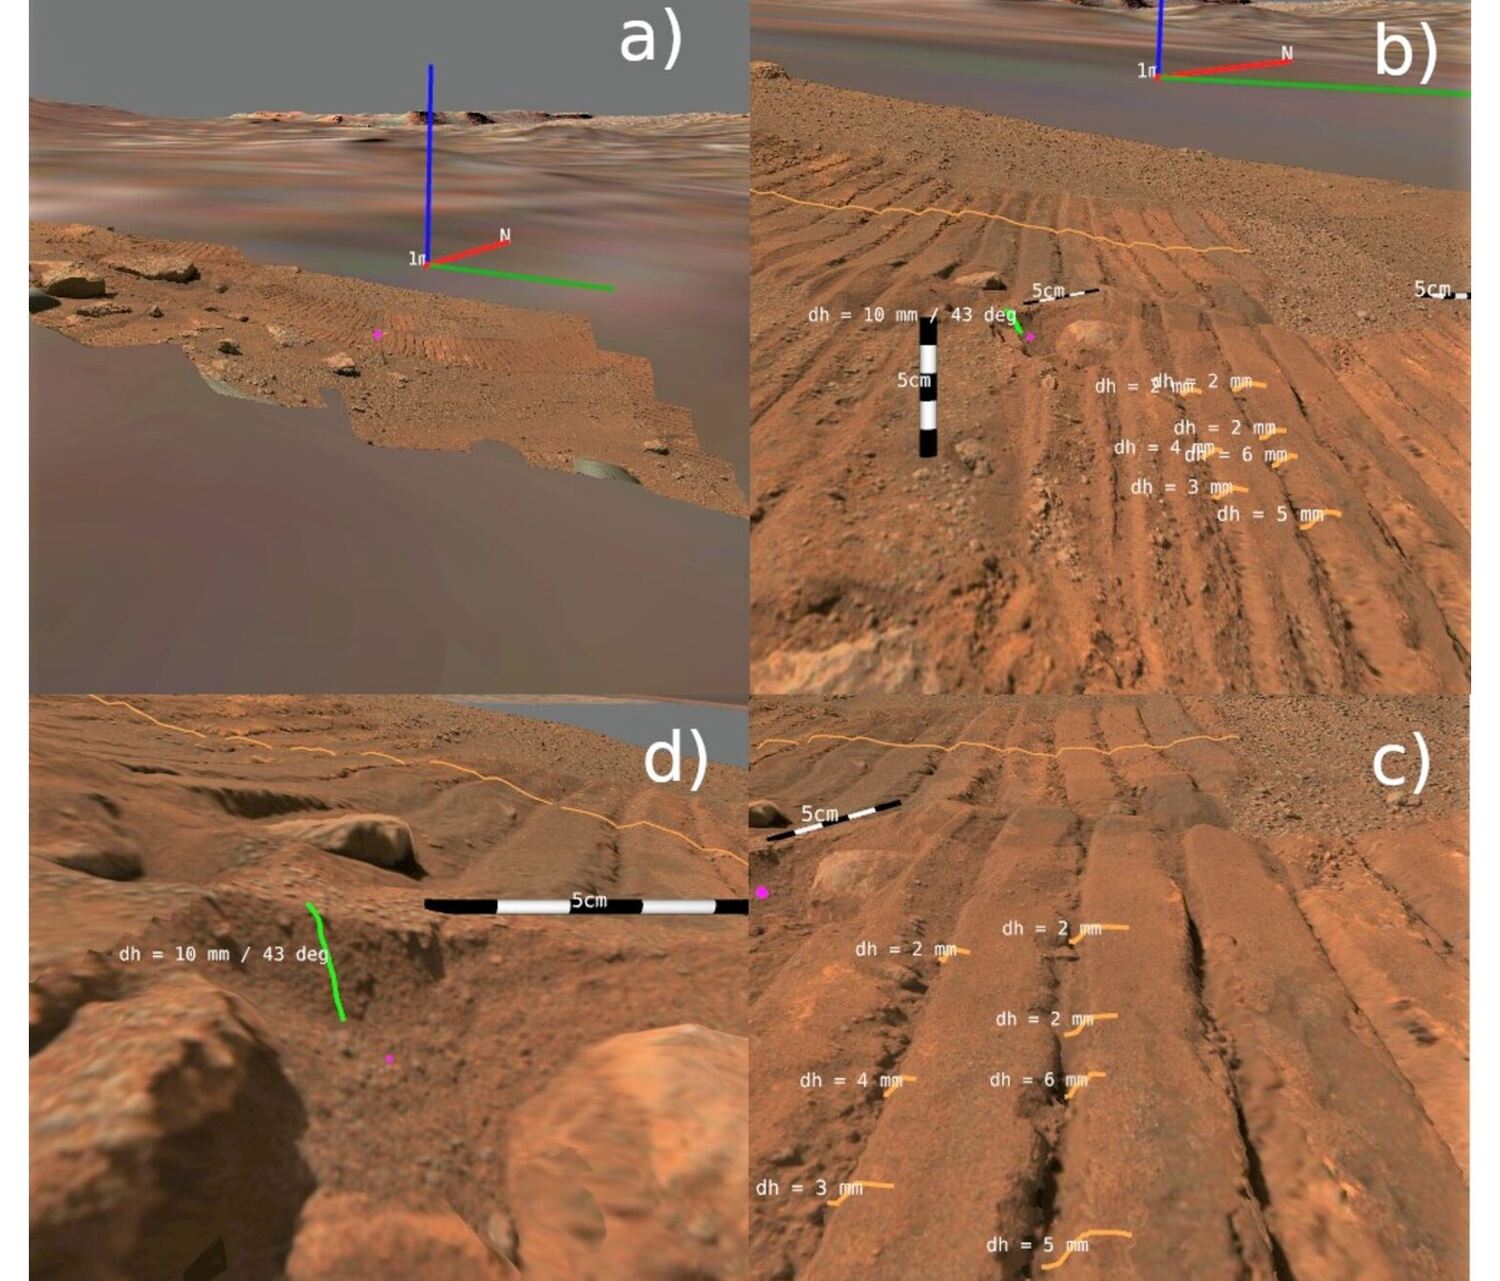
Figure 3: Soil crust evaluation stages documented using PRo3D’s Sequenced Bookmarks video-rendering. a) Environment, b) approaching the rover tracks, c) side view parallel to track rills with numeric assessments, d) close-range numeric assessments of a micro slope. Two Mastcam-Z OPCs from Sol 329 (zcam07106) and Sol 333 (zcam08354) overlain on HiRISE DTM/Ortho OPC. NASA/JPL/CalTech/ASU/MSSS/ÖAW/JR/VRVis
Science Case 2: Explaining the Result of a Geologic Annotation
A Digital Outcrop Model’s nature can be difficult to convey in simple 2D images, due to the different types of data collected – interpreting layering characteristics by lines, the orientation or dip and strike of exposed layers and bedding, thickness of layers, variation in thickness (up and down as well as laterally), and locations to build the interpretation on the spatial distribution of key textural and geometrical characteristics [4]. Collating such measurements carried out over multiple outcrops further increases the complexity of concisely sharing observations. Sequenced bookmarks allow for accessible visualisation of such multifaceted data presentation. This is highlighted in the interpretation of the Mure outcrop imaged by Mastcam-Z on Sols 168-169 (sequences 8180/8182/8183, Figure 4).
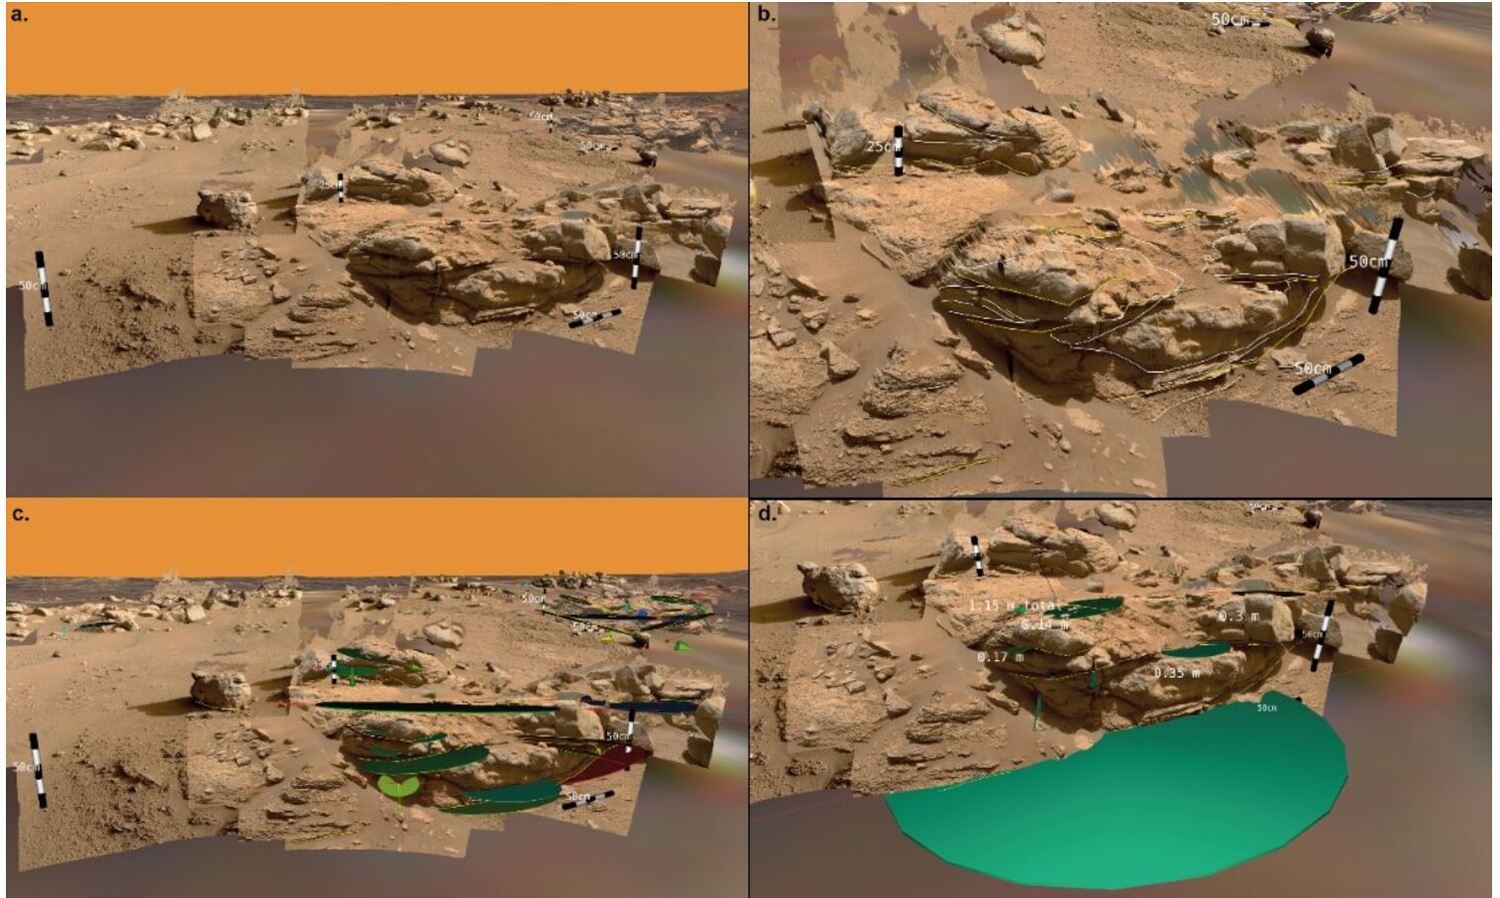
Figure 4: PRo3D’s Sequenced Bookmarks video rendering documenting geologic workflow stages. a. – Initial approach and (scaled) assessment of outcrop. b. – Layer contacts’ interpretation and annotation, visualizing geometry and dimensions. c. – Dip and strike of key surfaces. d. –Layer true thickness.
Outlook: Dynamically Adapting the Scene and Further Exploitation Cases
Functions for dynamic change of the scene whilst animating, sequenced toggling of surfaces, annotations and scale bars, and additional features such as color change in a predefined sequence are presently implemented. Such way, the 3D dynamic presentation of an exploration scenery will get a standard and low-effort means for immersively sharing observations and findings. Manifold application cases, not restricted to the Martian environment, contain the 3D explanation of dynamic processes such as landing [8], atmospheric processes (e.g. dust devils’ motion), the accumulation of measurements as the rover drives, or 3D change documentation [9].
Acknowledgements
JR, VRVis and ÖAW receive funding from ESA PRODEX Contract PEA4000117520 and FFG ASAP Projects 882828 and 885326. VRVis is funded by BMK, BMDW, Styria, SFG, Tyrol and Vienna Business Agency in the scope of COMET - Competence Centers for Excellent Technologies (879730) managed by FFG. We thank Rebecca Nowak for implementing the Sequenced Bookmarks suite.
References
[1] Bell et al., Space Science Reviews, 2021; [2] Traxler et al., 2022 https://doi.org/10.1002/9781119313922.ch3; [3] Ortner et al., Real Corp, 2010; [4] Barnes et al., ESS, 2018; [5] McEwen et al., JGR-Planets, 2007; [6] Beaty et al., MPS, 2019; [7] Hausrath, in submission, 2022; [8] Perseverance Descent Reconstruction in PRo3D, https://www.youtube.com/watch?v=-z1KySwtnuU; [9] QZCAM 0268 0255 ZCAM03258 8278 L0R0 110 034 HiRISE PRo3D Brac SampleHole1 E01, https://www.youtube.com/watch?v=5Sn4MpZdgpg
How to cite: Paar, G., Traxler, C., Bechtold, A., Barnes, R., Hausrath, E., Gupta, S., and Calef, F.: Flyover videos from annotated 3D Martian environments within minutes: The PRo3D Sequence Bookmark Facility, Europlanet Science Congress 2022, Granada, Spain, 18–23 Sep 2022, EPSC2022-40, https://doi.org/10.5194/epsc2022-40, 2022.
Introduction
Since 2015, the Japanese meteorological satellite Himawari-8 has been observing weather in the Asia-Pacific region every 10 minutes [1]. Scanning the full-disk Earth also covers space adjacent to the Earth, where celestial objects, such as the Moon, are occasionally included (Figure 1). Onboard Himawari-8 is an Advanced Himawari Imager (AHI), whose high spatio-temporal resolution can provide over 900 lunar images with 23 km/pix or better.
Furthermore, various AHI bands from visible to infrared wavelengths possibly provide multispectral information about planets. In particular, some of the nine infrared wavelength bands on AHI have not been used for observing the Moon by any other spaceborne telescopes. For example, within the AHI infrared coverage of 6–14 μm, the Diviner radiometer onboard Lunar Reconnaissance Orbiter (LRO) has only three channels around 8 μm [2].
Despite such potential, the AHI images have never been recognized as a useful dataset in planetary science. In order to demonstrate the possibility of utilization of AHI data, we investigate the lunar thermal environment with the AHI data. We develop the procedure to extract lunar multiband brightness temperatures. Then, we compare them with the Diviner measurements and numerical simulations, posing some constraints on lunar thermophysical conditions.

Figure 1. Synthesized images of the Moon captured within AHI.
Method
To derive lunar brightness temperatures, we use the Himawari Standard Data (HSD) published by the Japanese Meteorological Agency. First, we extract lunar images from all HSDs taken by the end of November 2021. Next, we manually choose 248 lunar images in which more than a half part of the Moon is captured (Figure 2). Then, we calculate the lunar orientation with SPICE to obtain the lunar longitude and latitude of each HSD pixel. Finally, after estimating background noise, we convert the radiance value to brightness temperatures at all nine bands.
To interpret the derived brightness temperatures, we employ a 1-D conductive model to simulate the temperature on the Moon. In this simulation, the material differences must be considered because the thermal inertia of the media influences the temperature prediction, particularly on the nightside. Thus, the calculation is conducted for both rock and regolith, using the Apollo data [3]. Moreover, surficial roughness is critical because of its effects on shadows, notably in the morning and evening. Thus, we incorporate the statistical model among incidence angle, emission angle, shadow ratio, and roughness parameterized by the RMS mean slope [4, 5].

Figure 2. (a, b) Images of the half-Moon and almost-new Moon taken on 2018/12/28 08:20 and 2015/11/09 13:10 in UTC, respectively.
Brightness temperatures
Lunar brightness temperatures derived from HSD are consistent with those measured by Diviner. Due to the similarity between band 11 on AHI (8.40–8.78 μm) and channel 5 on Diviner (8.38–8.68 μm), we compare HSD with the Diviner Global Cumulative Product (GCP) [6]. Although HSD is saturated at local times from 8 to 16 hours due to its dynamic range, the brightness temperatures from HDS match those from Diviner GCP in the morning and evening. In addition, HSD at Tycho crater also agrees with Diviner GCP even in the nightside, indicating the reliability of AHI for planetary science.
Multiband lunar images by AHI reveal differences in brightness temperature among wavelengths, so-called anisothermality. In the morning and evening, the brightness temperature differences among bands increase with the incident angle. Nightside temperature differences also exist in Tycho crater. These anisothermal features are consistent with the Diviner measurements and indicate the mixture of various temperatures even within a pixel of HSD.
Lunar thermophysical conditions
The anisothermality in the morning and evening is caused by the surface roughness of the Moon. Due to various slopes on millimetric to centimetric scales, the surface temperature on the Moon shows a wide-ranging distribution, increasing anisothermality with the incident angles. In addition, our radiance simulation with the RMS mean slope of 16–20 degrees is consistent with the observed values at incident angles lower than 70 degrees. These slope angles also match those at Apollo landing sites [7].
On the other hand, the nightside anisothermality reflects rock abundance. Because of the high thermal inertia of rocks, the midnight temperature of rocks is expected to be higher than that of regolith by over 100 K. As a result, only a slight mixture of rock in regolith can make brightness temperatures higher than regolith (Figure 3). Our mixture model of rock and regolith estimates the rock abundances at the equator and Tycho crater are 0.18–0.48 and 6.1–10.3%, respectively. These estimates are also consistent with the Diviner constraints [8].

Figure 3 Temporal temperature variations at the lunar equator after sunset. The black points are the HSD brightness temperatures at band 14. The black dashed and dotted lines show the rock and regolith temperatures in our simulation. The solid lines show rock-regolith mixture models with rock ratios of 0.2, 0.5, 2, 10, 25, and 50 %.
Conclusion
Consistencies between AHI and Diviner indicate that the quality of HSD is sufficiently high for planetary science. Despite the spatial resolution lower than Diviner, the unique wavelength coverages of AHI can provide new spaceborne infrared datasets. In addition, AHI sometimes captures other planets like Mercury, Venus, Mars, and Jupiter. Thus, HSD can be a valuable data source for calibrations and future planetary sciences.
Note
The contents of this presentation have been submitted by Nishiyama et al. to Earth, Planets, and Space.
Reference
[1] Okuyama, A. et al., 2018, Journal of the Meteorological Society of Japan 96B, 91.
[2] Paige, D.A. et al., 2010, Space Science Reviews 150, 125–160.
[3] Horai, K. & Simmons, G., 1972, Thermal Characteristics of the Moon. pp. 243–267.
[4] Bandfield, J.L. et al., 2015, Icarus 248, 357–372.
[5] Davidsson, B.J.R. et al., 2015, Icarus 252, 1–21.
[6] Williams, J.P. et al., 2017, Icarus 283, 300–325.
[7] Helfenstein, P. & Shepard, M.K., 1999, Icarus 141, 107–131.
[8] Bandfield, J.L. et al., 2011, JGR: Planets 116.
How to cite: Nishiyama, G., Namiki, N., Sugita, S., and Uno, S.: Utilization of the Japanese meteorological satellite Himawari-8 as an infrared space telescope for lunar and planetary science, Europlanet Science Congress 2022, Granada, Spain, 18–23 Sep 2022, EPSC2022-101, https://doi.org/10.5194/epsc2022-101, 2022.
We present the science planning tool for dust instrument observations that is currently under development within the DESTINY+ project. The JAXA-led DESTINY+ mission (Demonstration and Experiment of Space Technology for Interplanetary voyage Phaethon fLyby and dUst Science), set to launch in 2024, carries two camera instruments intended to study the active asteroid 3200 Phaethon during a flyby in 2028, as well as the Destiny+ Dust Analyzer (DDA), an impact ionization time-of-flight mass spectrometer which will sample Phaethon’s dust environment. During the 4-years voyage leading up to the flyby, DDA will also study interplanetary and interstellar dust particles as its second main science objective. For this phase, the science working team is preparing tools to produce suitable high-level science operations schedules.
As DESTINY+ relies on solar-electric propulsion to expand its Earth orbit and ultimately reach interplanetary space, a highly dynamic spacecraft attitude is required to achieve an optimal thrust vector and illumination of the solar panels. To maintain some pointing autonomy, DDA has a dual-axis pointing mechanism, granting a coverage of 1pi solid angle. The dynamic attitude combined with the flexibility of a pointing mechanism warrants elaborate planning to optimize coverage of directional dust fluxes, such as interstellar dust. Here we present the DDA Observation Planning Environment (DOPE), which is a graphical tool for intuitive campaign design, including visualizations such as spacecraft orientation or instrument footprint. Under the hood DOPE uses the SPICE toolkit for all geometric or time calculations, thus import of SPICE kernels for spacecraft trajectory, attitude, and clock is required. Here we describe the DDA science planning process to provide a contextual frame for the tool and demonstrate its functionality with emphasis on the geometrical capabilities.
How to cite: Sommer, M., Krüger, H., Srama, R., Hirai, T., Arai, T., Kobayashi, M., Sasaki, S., Moragas-Klostermeyer, G., Strub, P., and Simolka, J.: DOPE: A science planning tool for the Destiny+ Dust Analyzer, Europlanet Science Congress 2022, Granada, Spain, 18–23 Sep 2022, EPSC2022-928, https://doi.org/10.5194/epsc2022-928, 2022.
Spacecraft in the space environment plasma collect and emit charged particles ending charging themselves. Even with the best specification, the spacecraft potential charge to a potential of the order of the ambient electron temperature, which impact the instrument ability to investigate the thermal plasma characteristics. The most impacted instruments are the particle detector which see a distortion both in arrival direction and energy, and the plasma and field sensors which are perturbed by the electrostatic sheath around the spacecraft. In order to improve the space mission data analysis, the Spacecraft-Plasma Interaction Software (SPIS) has been developed by ONERA and Artenum, with support from the ESA, the CNES and the SPINE Community which gathers European academic and industrial partners and the charging issues. However, the precision of its modelings depends on the accuracy of its inputs, particularly concerning the plasma environment populations. In the frame of the Europlanet 2024 RI project funded by the European Commission, we developed a connection between SPIS and the main environment databases through the SPASE framework. Using the Simulation extension to SPASE, the IMPEX planetary environment simulation databases are also accesible. In addition, this extension allowed us to develop algorithms that allow to retrieve semi-automatically the data of interest (i.e. that can be exploited by software) in a whole database and to handle them properly. We will demonstrate the capability of the software - database connection to analyze instrument measurements and show the capability of SPASE to provide the metadata needed for the automatic processing of the data by client tools.
How to cite: Hess, S. and Leclercq, L.: Coupling the Spacecraft-Plasma Interaction Software to the Space Environment Databases, Europlanet Science Congress 2022, Granada, Spain, 18–23 Sep 2022, EPSC2022-347, https://doi.org/10.5194/epsc2022-347, 2022.
Orals: Fri, 23 Sep, 10:00–11:30 | Room Andalucia 1
VESPA (Virtual European Solar and Planetary Access) has focused for 10 years on adapting Virtual Observatory (VO) techniques to handle Planetary Science data [1] [2]. The objective of this activity is to build a contributory data distribution system both to access and publish data with minimum fuss. This system is responsive to the new paradigm of Open Science and FAIR access to the data, and is optimized to publish data from public-funded programmes with limited resources.
VESPA’s architecture was defined during the previous Europlanet-2020-RI program, incorporating concepts and standards from various areas: astronomy, Earth observation, space physics, heliophysics, etc. It relies on the VO infrastructure: data services are installed in any location but are declared in a system of harvested registries with identifiers, end-point (URL), mention of supported access protocols, and a rough description of content. Such services are interoperable via clients and tools, which also provide visualization and analysis functions.
The activity in Europlanet-2024-RI focuses on expanding this environment, enforcing sustainability, and opening new possibilities to improve data handling – such as workflows, cloud-based computation, and readiness for exploitation through Machine Learning techniques.
Data access. VESPA uses a specific access protocol called EPN-TAP, associated with a metadata vocabulary providing uniform description of datasets in the field. At the time of writing EPN-TAP is in the final stage of becoming a Recommendation of the International Virtual Observatory Alliance (IVOA) [3].
EPN-TAP is compliant with the general TAP protocol, allowing usage of existing VO tools and communication protocols with data services pertaining to Solar System studies. Some VO tools (TOPCAT, Aladin, CASSIS) are also adapted to improve handling of such data, e.g. visualisation of footprints (spatial or temporal), reflected light, or spectral cubes on planetary surfaces. In parallel, OGC-compliant definitions of planetary coordinate reference systems will facilitate the use of GIS tools in Planetary Science.
The VESPA portal, intended as a discovery tool to browse the EPN-TAP services, is being redesigned to improve the user experience (new version expected to be released for the conference). Other, more specific access modes (via script, web services, Jupyter notebook, VO tools, etc) are also available.
Data services. 67 EPN-TAP data services are currently searchable from the VESPA portal, and about 20 are in development phase. Contributions from space agencies have increased significantly this year, with now 25+ million files in ESA’s PSA, and 60 datasets from the NASA PDS PPI node (declared in the IVOA registry but not yet reviewed for the portal). New services include atmospheric modelling from GCM (Venus and Mars), surface and asteroid spectra, radio observations, solar databases, and tables from published articles at CDS/VizieR. Larger data infrastructures with EPN-TAP interface (AMDA, SSHADE, PVOL) also develop their content and capacities, e.g. this year band lists have been implemented in SSHADE, and support for long time series in AMDA. An implementation workshop associated to a call for data services from the community was held in Nov 2021, and two more workshops are scheduled in the course of the programme.
Service implementation support. The standard procedure to implement services has been greatly enhanced with new releases of DaCHS (a VO data server by Heidelberg University) and TOPCAT (a VO tool for tabular data by the University of Bristol). Both tools fully support the current version of EPN-TAP and greatly facilitate the set-up of new data services: DaCHS includes a predefinition of standard EPN-TAP parameters (with units and UCDs), while TOPCAT includes an EPN-TAP validator. A Docker version of DaCHS is available for assessment purposes. Existing data services have been reviewed for compliance, and most of them have been upgraded to benefit from the latest developments. In many cases, their content has been extended with new data and functions.
Service access. The recent upgrade also addresses low-level technical aspects, e.g. related to declaration in the IVOA registry. Most EPN-TAP services are now declared in compliance with recent evolutions of the VO, and are findable independently from the portal.
Sustainability. Definition files of all services are stored in a unique gitlab for preservation and maintenance by several VESPA teams. Gitlab authentication is granted by GÉANT/eduTEAMS. This is a simple and efficient way to share the technical expertise among services and teams, and to improve sustainability.
Implementation of data services on EOSC (the recent European Open Science Cloud) was assessed during the VESPA-cloud project supported by EOSC-Hub, through its 2nd Early Adopter Program (2020-21). EPN-TAP services can be deployed on EOSC inside Virtual Machines or Docker containers, from the same gitlab installation used to preserve the services. This will provide a workaround to services temporary unavailability, for performing cloud-based computation on data services, and a solution for data providers who are not able or not willing to host a VESPA server for a long period of time.
Coming data services. Data produced by other WP in Europlanet-2024 will distribute their results using the VESPA infrastructure: other VAs (SPIDER, GMap, ML), NA2 (telescope network and other pro-am projects), and TAs (lab experiments and field studies). VESPA is of course also available to distribute data from other H2020 programmes in the field. An interface with space agency archives will make use of the recent PDS4 dictionary for EPN-TAP (in addition to the existing EPN-TAP interface on ESA’s PSA).
Prospects. Detailed examples of recent VESPA developments are provided in this session and related ones. The focus will shift again next year to new data services, with the finalization of several projects, in particular related to the Moon, Mercury, and exoplanets. A workflow platform will also be connected to perform run-on-demand (the OPUS system also used by the ESCAPE H2020 programme) and cloud-based activity will expand.
The Europlanet-2024 Research Infrastructure project has received funding from the European Union's Horizon 2020 research and innovation programme under grant agreements No 871149.
[1] Erard et al 2018, Planet. Space Sci. 150, 65-85. 10.1016/j.pss.2017.05.013. ArXiv 1705.09727
[2] Erard et al. 2020, Data Science Journal 19, 22. doi: 10.5334/dsj-2020-022.
[3] https://ivoa.net/documents/EPNTAP/
How to cite: Erard, S. and the VESPA team: Virtual European Solar & Planetary Access (VESPA) 2022: Sustainability, Europlanet Science Congress 2022, Granada, Spain, 18–23 Sep 2022, EPSC2022-676, https://doi.org/10.5194/epsc2022-676, 2022.
The sample of Solar system objects has dramatically increased over the last decades. The amount of measured properties (e.g., diameter, taxonomy, rotation period, thermal inertia) has grown even faster. The benefit of all these developments has, however, not come to full fruition. While some catalogs are publicly available in machine-readable formats on, e.g., the Planetary Data System (PDS), or the Centre de Données astronomiques de Strasbourg (CDS), a significant fraction of results are only tabulated within articles. Furthermore, the designation of small bodies often evolves with time, from potentially several provisional designations, to a single number and finally an official name. Hence, the same object can be referred to by different labels in different studies, making its cross-identification over several sources a complex task. Accessing to all the characteristics of a given body, or a population, can thus be tedious, or even impractical. A universal access point for all measured properties of Solar system objects available in the literature and online databases is thus required.
We provide a practical solution to the identification of Solar system objects from any of their multiple names/designations. We also compile and rationalize their properties to provide an easy access to them. We aim to continuously update the database as new measurements become available. We built a Web Service, SsODNet, that offers four interfaces, each corresponding to an identified typical need in the community: name resolution (quaero), compilation of a large corpus of properties (datacloud), determination of the best estimates among compiled values (ssoCard), and statistical description of the population (BFT).
The name resolver quaero translates any of the 5 million designations of objects into their current official designation in a fraction of second. The datacloud compiles about a 100 million measurements of many parameters (osculating and proper element, pair and family membership, diameter, albedo, mass, density, spin, phase function, color taxonomy, thermal inertia, and Yarkovsky drift) from over 2,900 articles. Each parameter is associated with an object, and a complete bibliographic reference is linked with it. For each of the 1.2 million objects in the system, a ssoCard providing a single best-estimate for each parameter is available, and delivered in json format, again in a fraction of a second. Finally, the BFT large table compiles all these best-estimates into a single eCSV file for population-wide studies.
The four interfaces of SsODNet have a Web service with an application programming interface (API). The SsODNet interfaces are fully operational and freely accessible to everyone (https://ssp.imcce.fr/webservices/ssodnet/). We also propose a python package and command-line tool to acces the service: rocks (https://rocks.readthedocs.io/).
How to cite: Carry, B., Berthier, J., Mahlke, M., and Normand, J.: SsODNet: The Solar system Open Database Network, Europlanet Science Congress 2022, Granada, Spain, 18–23 Sep 2022, EPSC2022-184, https://doi.org/10.5194/epsc2022-184, 2022.
Introduction
The small bodies (also known as minor planets) in our solar system are usually discovered by telescopic surveys. The results of these observations are organised by the Minor Planet Center (MPC), which determines orbits from the astrometric observations of the surveys. As of May 15, 2022, the MPC has an orbit database of 1,193,635 minor planets. However, the MPC data do not tell us what a minor body actually is, as they not contain physical properties such as albedo, diameter, volume, shape, composition, mass, bulk density, period of rotation and direction in the sky of the axis of rotation. Asteroids have very diverse values of these physical properties, whose knowledge is important for scientific studies of our solar system and its origin, planetary formation and evolution, space exploration, and planetary defence.
The physical properties of small bodies are spread across many publications, several websites (e.g. the NASA planetary data service) and archives. Many compositionally diagnostic spectra are also presented in a series of publications, but their source files are not necessarily public. This poses a fundamental problem to our ability to massively exploit the physical properties of minor bodies. Moreover, the values of these physical parameters are extremely heterogeneous, obtained by several different groups, project teams and telescopic surveys, and even individual researchers, using different techniques. For example, thermal models are used to interpret observations in the mid-infrared (between 3.5 and 100 μm) from space and from the ground for the measurement of diameters and albedos. However, other techniques such as radar or the measurement of stellar occultation times provide measurements of diameters.
A centre of minor planets’ physical properties
The Minor Planet Physical Properties Catalogue, or MP3C for short, collects and organises in a single place and makes available to the community values of physical properties of asteroids and other small bodies of our solar system. The MP3C is designed for very heterogeneous and big amount data: as of March 2022 it contains 3,710,587 measured properties, all of which are fully referenced to their published sources. The MP3C offers two main interfaces to explore the data (Figs. 1 and 2), namely (i) a web portal (mp3c.oca.eu) that allows to perform extraction of physical properties values on the basis of a single or list of minor bodies identifiers (names, numbers), but also on ranges of physical and dynamical properties; (ii) a data server offering a Table Access Protocol (TAP), which is defined and compatible with the standards of the Virtual Observatory (VO). The data server is accessible at https://dachs.oca.eu. MP3C is registered as service of the Virtual Observatory and therefore searchable and accessible using Virtual Observatory tools such as TOPCAT (Fig. 2). Using TOPCAT and/or the TAP, a human or robotic user can perform queries in a standardised database language (ADQL). MP3C contains sizes, albedos, absolute magnitudes, masses and rotational period, along with osculating and proper orbital elements of 1,169,632 minor bodies. At the time of writing we are also implementing in the MP3C table of spectral classes, colours, rotation vector orientation, and later reflectance spectra of minor planets.
Interface with the Virtual European Solar and Planetary Access of EUROPLANET
In addition to the general TAP interface, the best current determinations of all parameters and objects are accessible via the EPN-TAP protocol. EPN-TAP, designed in Europlanet/VESPA, uses a specific metadata vocabulary to uniformly describe Solar System data, which facilitates cross-searches in various data services - for instance, several services providing spectra of small bodies are also accessible in this format. All EPN-TAP services can be queried from the VESPA portal (http://vespa.obspm.fr) or from scripts in various languages, e.g. for mass processing.
The future big data challenge
In the future, the problem of the spreading of small-body physical properties will become very important: Soon, the Near-Earth Object Surveyor Telescope, decided to be implemented by NASA's Planetary Defense Coordination Office in the fall of 2019, with a launch in 2026 will determine the sizes and albedos of nearly 8 million asteroids from observations of their thermal emission. At the end of 2022 LSST will be commissioned and will begin operations. About two years later, LSST will start publishing the data. In a single visit, LSST detects up to 5,000 solar system objects. Over its 10 year lifespan, LSST could catalog over 5 million Main Belt asteroids, almost 300,000 Jupiter Trojans, over 100,000 near-Earth objects, and over 40,000 trans-neptunian objects. Many of these objects will receive 100s of observations in multiple bandpasses. This amounts to an increase of at least 10× the known population, with similar increases in the number of objects with enough data to generate light-curves and colours. We therefore imagine a very significant increase in the physical properties of asteroids and comets. Clearly the latter is a major big-data problem, which will necessitate scientific and technical implementation skills.
Acknowledgments
M. Delbo and C. Avdellidou acknowledge support from the ANR Origins (ANR-18-CE31-13-0014). The work of C. Avdellidou was also partially funded by he French National Research Agency under the project “Investissements d’Avenir” UCAJEDI with the reference number ANR-15-IDEX-01 (2018-2020). The work of S. Erard for linking MP3C to EUROPLANET VESPA was supported by the the Europlanet-2024 Research Infrastructure project that received funding from the European Union's Horizon 2020 research and innovation programme under grant agreement No 871149.
Figure 1: (Left) HTML output of all properties listed by MP3C for Pallas. (Right) Search form by list of object identifiers and/or range of their physical and orbital properties.
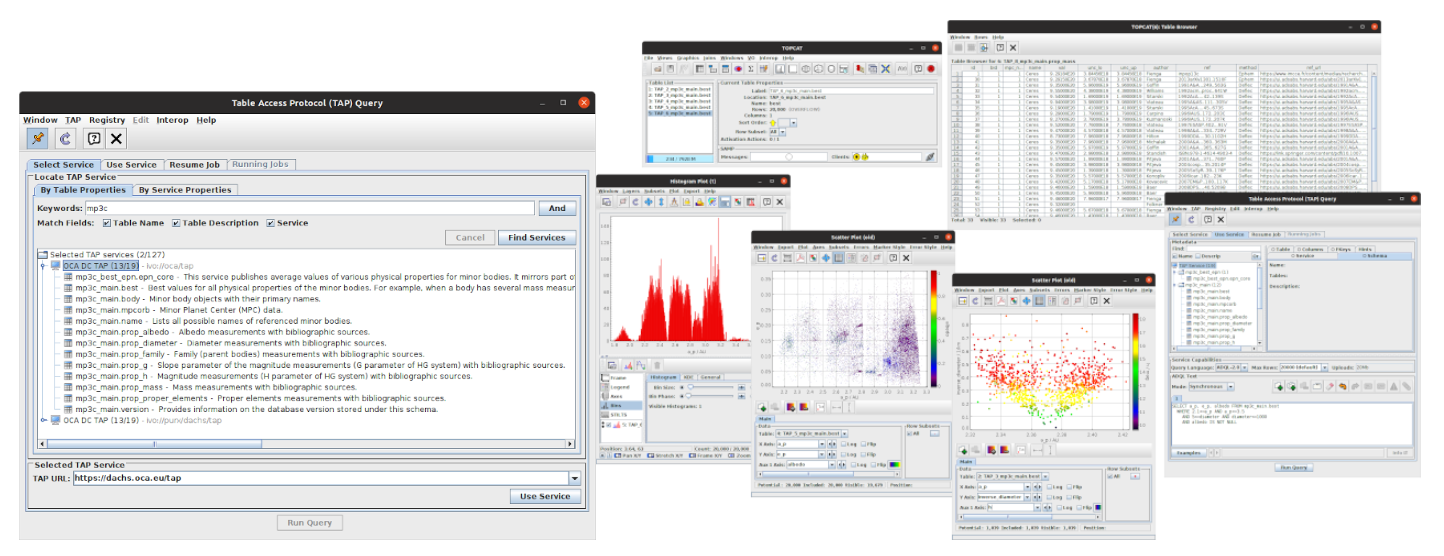
Figure 2: The MP3C service is accessible via the TAP protocol by the applications of the Virtual Observatory (here, TOPCAT). (Left) List of tables with their description, including the EPNCore table available in particular for the VESPA service. (Right) Graphs and tables obtained by submitting ADQL queries.
How to cite: Delbo, M., Avdellidou, C., Bruot, N., and Erard, S.: The Minor Planet Physical Properties Catalogue: Connection with the Virtual European Solar and Planetary Access of EUROPLANET and the big data challenge for planetary science, Europlanet Science Congress 2022, Granada, Spain, 18–23 Sep 2022, EPSC2022-323, https://doi.org/10.5194/epsc2022-323, 2022.
Introduction
The SSHADE database infrastructure (http://www.sshade.eu) hosts the databases of about 30 experimental research groups in spectroscopy of solids from 15 countries. It currently provides to all researcher over 5000 spectra of many different types of solids (ices, minerals, carbonaceous matters, meteorites…) over a very wide range of wavelengths (mostly X-ray and VUV to sub-mm)
However, although these data are invaluable for the community, one type of information is still critically missing to easily interpret laboratory, field or astronomical spectra: the list of the characteristics (band position, width, intensities, transition attribution, …) of the absorption bands of a given solid, called its ‘band list’.
This type of database is well developed for gases (see e.g. the VAMDC portal (2)), and it is even frequently the only type of spectral data available. But for solids (and liquids) there is currently almost no database which provides such information (only in some restricted fields, such as Raman spectroscopy of minerals, e.g. the WURM database (3)).
This critical lack triggered us to develop (within the Europlanet-2024 RI program) such a band list database containing the characteristics of electronic, vibration and phonon bands of various solids (ices, simple organics, minerals) of astrophysical interest to help:
- identify absorption or emission bands from solids observed in various astrophysical environments or in laboratory simulations
- determine the environment of the molecule or mineral (composition, isotopes, mixing, phase, T, P, …)
- select the best spectra in SSHADE to compare with observation, or to use in models
What is a band list of a solid?
A ‘band list’ is a list of band parameters and vibration modes of a molecule in a simple molecular constituent (3 species maximum), or of a mineral or a ionic/covalent solid, with a well-defined phase and composition (fixed or small range). It includes the bands of all isotopes (sub-bandlists) and can be provided for different environments (T, P, …).
The SSHADE 'band list' database provides the band parameters (position, width, peak and/or integrated intensity, and their accuracy, isotopic species involved, mode assignment, ...) of a progressively increasing number of solids and simple compounds (with different compositions) of astrophysical and planetary interest in various phases (crystallines, amorphous, ...) at different temperatures or pressures.
We are feeding this database through exhaustive compilations and critical reviews of all data published in various journals for pure ices and molecular solids and their simple compounds (solid solution, hydrates, clathrates, ...), including the own works of the SSHADE consortium partners. We will continue in a second step with band lists of minerals. However, this is a tremendous scientific work, expected to last many years… For example, the infrared spectrum of pure solid CO in its cubic α phase has been the subject of more than 35 papers scattered in 25 different journals over the period 1961-2020…
SSHADE band list database and interface
A specific data model, SSDM-BL (Solid Spectroscopy Data Model – Band List), has been first developed in order to accurately describe and link all the parameters necessary to describe both the solid constituent and the band list itself. A structured database storing all these data and metadata, has then be set up based on this data model. A data review tool (excel file), a data convertor to a XML import file, as well as a data import tool have been developed to feed the database.
Then an efficient search tool allows you to search either a band list or a specific band thanks to a combination between a ‘search bar’ and a set of filters on various parameters, such as band position, width and intensity, expected molecular or atomic composition, type of vibration, temperature and pressure. The search result are provided as a table with band list title or the main band parameters allowing the users to select the most relevant ones. He can then display the selected band list graphically, thanks to a simulator of ‘band list spectra’, with various unit and display options. The data can be exported as a table containing the main parameters of all the bands of the band list, as well as detailed metadata of the band list and all its bands. A data reference and a DOI will be associated with each band list.
SSHADE in Virtual Observatory
SSHADE-Bandlist will be later a service of the VESPA Virtual Planetary Observatory. It will be accessible via the EPN-TAP protocol, which will allow comparison with observational data and mass processing in the VESPA environment through a series of dedicated spectroscopy plotting and analysing tools.
Conclusion
This band list database should become a key tool for astronomers and planetary scientists to identify unknown absorption bands observed in the spectra of the surface or atmosphere of many astrophysical and solar system objects. Once the best candidate solid found by the user, the tool will link to the most relevant spectral datasets present in the SSHADE databases. These data can then be used for direct comparison with observations, or to model them through radiative transfer codes.
However its feeding will strongly depend on the scientific manpower available, and on the contribution of the SSHADE partners and of the community.
Acknowledgements
The Europlanet 2024 Research Infrastructure project received funding from the European Union's Horizon 2020 research and innovation programme under grant agreement No 871149. We also acknowledge OSUG, and INSU for additional financial supports.
References
- Schmitt, B., et al. (2018) SSHADE: "Solid Spectroscopy Hosting Architecture of Databases and Expertise" and its databases. OSUG Data Center. Service/Database Infrastructure. doi:26302/SSHADE
- Dubernet, M. L., et al. (2016). The Virtual Atomic and Molecular Data Centre (VAMDC) Consortium. Phys. B: At. Mol. Opt. Phys., 49, 074003 [doi:10.1088/0953-4075/49/7/074003]
- WURM project (http://www.wurm.info)
How to cite: Schmitt, B., Albert, D., Furrer, M., Bollard, P., Mandon, L., Gorbacheva, M., Bonal, L., and Poch, O.: SSHADE-BandList, the new database of spectroscopy band lists of solids, Europlanet Science Congress 2022, Granada, Spain, 18–23 Sep 2022, EPSC2022-778, https://doi.org/10.5194/epsc2022-778, 2022.
The European Space Agency’s Planetary Science Archive (PSA) is the home for all scientific data from ESA’s planetary missions. Adopting the NASA PDS standard (version 3 and 4) it is designed to make the data, meta-data and knowledge on how to use them available to the scientific community. As a multi-mission archive, the PSA supports (or will soon support) over ten missions and their associated instruments, with this number expected to grow significantly in the coming years.
The PSA has a long legacy of successfully preserving and distributing mission data to the community, and offers several services to fulfil this, including tabular, image-based and map-based interfaces, several APIs and traditional FTP. However, the entry barrier for new users is quite high, and moving forward there are new data access requirements coming from scientists wanting to perform more complex queries, run machine learning algorithms and so on. This presentation will describe the current infrastructure, recent updates and plans for the next few years which will try to address these changing needs.
In particular, the following key developments are foreseen:
- implementation of a new user interface, with a streamlined and more user-friendly design, which will also work well on mobile, and touchscreen displays,
- improvements to APIs to include more data (specifically instrument geometry), and to incorporate the new PDS API which will allow access to any meta-data in the data products, leveraging the full value of the effort put in by instrument teams and archive scientists to curate them,
- integration with ESA DataLabs, a project designed to “bring the code to the data” and allow data processing and analysis to be done in an interactive online environment hosted close to the data repository and allowing big data workflows without having to download the products,
- publication of data tutorials based on open-source tools and libraries, to give new users a “quick start guide” to using data from a given instrument, and
- a much higher frequency release cadence, responding to the needs of the scientific community in a timely manner.
Finally, community input is sought on other improvements which could be made, and which use cases are not fulfilled by the current infrastructure.
How to cite: Bentley, M., Breitfellner, M., Coia, D., Docasal, R., Heather, D., Grotheer, E., Lim, T., Merín, B., Oliveira, J., Osinde, J., Raga, F., Saiz, J., and Valles, R.: ESA’s Planetary Science Archive: current status and future plans, Europlanet Science Congress 2022, Granada, Spain, 18–23 Sep 2022, EPSC2022-111, https://doi.org/10.5194/epsc2022-111, 2022.
Introduction: SPICE is an information system the purpose of which is to provide scientists the observation geometry needed to plan scientific observations and to analyze the data returned from those observations. SPICE is comprised of a suite of data files, usually called kernels, and software -mostly subroutines [1]. The user incorporates a few of the subroutines into his/her own program that is built to read SPICE data and compute needed geometry parameters for whatever task is at hand. Some examples of geometry parameters typically computed are range or altitude, latitude and longitude, illuminations angles (phase, incidence and emission), instrument pointing and field-of-view calculations, reference frame transformations, and coordinate system conversions. SPICE is also very adept at time conversions.
The ESA SPICE Service: The ESA SPICE Service (ESS) leads the SPICE operations for ESA missions. The group generates the SPICE Kernel Datasets (SKDs) for missions in development (JUICE, ExoMars 2022, Hera, Comet-Interceptor, and EnVision), missions in operations (Mars Express, ExoMars 2016, BepiColombo, and Solar Orbiter) and legacy missions (Venus Express, Rosetta and SMART-1). ESS is also responsible for the generation of SPICE Kernels for INTEGRAL. Moreover, ESS provides SPICE support Kernels for Gaia and James Webb Space Telescope. The generation of SKDs includes the development and operation of software to convert ESA orbit, attitude, payload telemetry and spacecraft clock correlation data into the corresponding SPICE format. ESS also provides consultancy and support to the Science Ground Segments of the planetary missions, the Instrument Teams and the science community. The access point for the ESS activities, data and latest news can be found at the following site https://www.cosmos.esa.int/web/spice. ESS works in partnership with NAIF.
Providing the best data: The quality of the data contained on a SKD is paramount. Bad SPICE data can lead to the computation of wrong geometric quantities which can jeopardize science results. ESS, in collaboration with NAIF, is focused on providing the best SKDs possible. Kernels can be classified as Setup Kernels (FK kernels defining Reference Frames of a given S/C, IK kernels describing a given sensor field-of-view and other characteristics, PCK or Planetary Constants Kernels, LSK or Leapseconds Kernels, and DSK kernels defining Digital Shape models of S/C components and celestial bodies) and Time-varying Kernels (SPK and CK kernels providing Trajectory and Attitude data, SCLK providing Time Correlation Data, and MK or Meta-kernel). Setup kernels are iterated with the different agents involved in the determination of the data contained in those kernels (Instrument Teams, Science Ground Segments, etc.) while Time-varying kernels are automatically generated by the ESS SPICE Operational Pipeline to produce the Operational kernels that are used in the day-to-day work of the missions in operations (planning and data analysis). These Time-varying kernels are peer-reviewed a posteriori for the consolidation of SKDs that are archived in the PSA and PDS.
Status of the Kernel Datasets: The current status and latest developments of the SKDs for the before mentioned missions will be described in this contribution. In general, the ESS is reviewing the legacy and operational datasets and developing the ones for future missions. DOIs have been incorporated to both operational and archived datasets and shall be used for citing ESA missions SKDs.

SPICE Kernels Archived in the PSA. ESS is also responsible for the generation of PDS3 and PDS4 formatted SPICE Archives that are published by the PSA. ESS in close collaboration with NAIF, peer-reviews the operational kernels for the PSA [2] in order to publish being compliant with the Planetary Data System (PDS) standards and uses them in the processes that require geometry computations.
Extended Services: ESS offers other services beyond the generation and maintenance of SPICE Kernel Datasets, such as instances and configuration for WebGeocalc and Cosmographia for the ESA missions. Moreover, the complete SPICE Data Volume is now accessible at ESA Datalabs [3], allowing the implementation of SPICE applications without requiring a local copy of the SPICE Kernel Datasets. SPICE devoted Datalabs developed by the ESS will be presented in this work.
SPICE-Enhanced Cosmographia. NAIF offers for public use a SPICE-enhanced version of the open source visualization tool named Cosmographia. This is an interactive tool devoted to 3D visualizations of celestial bodies ephemerides and shape models, spacecraft trajectories and orientations, movable parts position, and instrument field-of-views and footprints. ESS provides the framework and configuration required to load the ESA missions in Cosmographia, this contribution will demonstrate its usage for the ESA Planetary missions [4].

WebGeocalc. The WebGeocalc tool (WGC) provides a web-based graphical user interface to many of the observation geometry computations available from the SPICE APIs. A WGC user can perform SPICE computations without the need to write a program; just a web browser is required. WGC is provided to the ESS by NAIF. This contribution will outline the WGC instances for ESA missions [4].
References: [1] Acton C. (1996) Planet. And Space Sci., 44, 65-70. [2] Bessel, S. et al., (2017) Planet. And Space Sci. [3] Navarro, V. et al., (2019) ADASS 2019. [4] Acton, C. et al., (2017) Planet. And Space Sci.
How to cite: Escalante, A., Valles, R., and Arviset, C.: Updates on SPICE for ESA Missions, Europlanet Science Congress 2022, Granada, Spain, 18–23 Sep 2022, EPSC2022-8, https://doi.org/10.5194/epsc2022-8, 2022.
Context:
The era of Big Data is transforming the way scientists approach their research, and ultimately how science progresses and discoveries are made. This is particularly true for both Space Sciences and Earth Observation, where current missions have highlighted a critical need for the creation and development of infrastructures capable of acquiring, processing, analysing and distributing Big Data from space. Current satellites have started to deploy customized systems for enabling preservation and to ensure easy access to processing systems, but despite having similar needs, these have been vertical approaches. Concomitantly, recent and newer missions, benefiting from technological progresses, have raised the level of collected data to unprecedented levels. Advances in observation systems and instruments require equal advances in data management and analysis.
The ESA Datalabs
The European Space Agency (ESA) is seeking to establish a reference framework for space mission exploitation by scientific communities: the ESA Datalabs [1] (see figure below). The fundamental principle of the ESA Datalabs is to move the user to the data and tools. The European Science Astronomy Center (ESAC) has started developing systems and building capacity to cater to the heterogeneous mission data exploitation system needs, while outlining also an umbrella architecture to aggregate generic functions, develop common sub-systems and interoperability concepts to rationalise and gather material and intellectual data assets.
The Science Application Store and datalabs
In this presentation we will present one of the modules of the ESA Datalabs, the Science Application Store (SCIAPPS). The SCIAPPS will enable users to publish so-called datalabs within a trusted environment (the ESA Datalabs [2]), close to the scientific data, and permitting the whole scientific community to discover new science products in an open approach.
A datalab includes an application (e.g. processors, codes, pipelines, analysis and visualisation tools) and its specific relationship with data assets which can be linked from the ESA Data Discovery portal also within the ESA Datalabs platform.
In a nutshell, the SCIAPPS provides scientific developers with a friendly, fast and guided process to publish datalabs in the ESA Datalabs platform, and provides a catalogue so that scientific users can search and run datalabs.
Datalabs
Each datalab has its own specific function and purpose as defined by their developers. Practically a datalab consists of the source files, the metadata file (which capatures a synopsis of the function, purpose, scope and relation to data assests if any), and the build Docker image. No knowledge of docker file/images is required, SCIAPPS takes all the complexity out from the user which will be able to create datalabs even from just Jupyter file.
While each datalab is self-contained, specified data assets (e.g. from specific missions in the ESA archive) which may be mounted at runtime.
SCIAPPS main functionalities
Scientific user will be able to search for datalabs of interest, query datalabs relevant to a specific data collection for a single mission or multi-mission or instrument/s. Users will be allowed to rate, leave feedback on datalabs, bookmarked datalabs of interest, and of course to run the datalabs (using resources from the ESA Datalabs platform).
Datalabs can be created by ESA Datalabs users with Scientific Developer permission. Developers can create, build, test, validate, and export their own datalabs. They can also share them with specific user/s or group/s or share them publicly with all users from the ESA Datalabs. To make a datalab public in the main catalogue, datalabs will undergo a moderation process transparent to the user.
Summary
In the era of big data and data-intensive analaysis, the ESA Datalabs brings you the opportunity to bring your code directly to ESA’s infrasutructure, the ESA Datalabs. Here we will present the Science Application Store on the ESA Datalabs, which provides with a simple, fast, and efficient way for users to publish applications close to the data, and provides a datalab catalogue for users to search and run datalabs.
[1] ESA DATALABS: Towards a collaborative e-science platform for ESA. C. Arviset, V. Navarro, R. Alvarez et al., 5th Planetary Data and PSIDA 2021 (LPI Contrib. No. 2549)
[2] https://datalabs.esa.int
How to cite: Bernard-Salas, J., Cox, N., Navarro, V., Marinic, F., and Daumas, O.: The Science Application Store of the ESA Datalabs, Europlanet Science Congress 2022, Granada, Spain, 18–23 Sep 2022, EPSC2022-1155, https://doi.org/10.5194/epsc2022-1155, 2022.
Abstract: The moon-coverage tool is a Python package currently used by ESA-SOC for the JUICE mission to plan and visualize Jupiter’s moons surface coverage. It supports instrument footprint projections and region of interest intersections.
Introduction: One of the key elements to assess the quality of an observation plan is to visualize its spatial coverage at different scales (global, regional and local). All the planetary missions, past, current and future use JPL/NAIF SPICE kernels to describe the position of the spacecraft and its orientation in space [1]. These files are usually produced by space agencies and require advanced users to interpret them to know when and how a given surface feature is visible on a planetary body.
A planning tool in Python: To simplify the identification of these opportunities, we developed the moon-coverage, a Python package built on top of spiceypy [2] that provides an object-oriented approach to perform spacecraft trajectory computations (Fig. 1), instrument field of view projections (Fig. 2) and region of interest intersections (Fig. 3). Originally developed for the ESA-JUICE mission, the tool can now handle any space mission (Europa-Clipper, BepiColombo, EnVision, Juno…).

Figure 1: JUICE temporal sequence of Europa flyby 7E1 (July 2nd 2032 with crema 5.0b23.1). The top panel represents the altitude of the spacecraft and the bottom the local incident angle. The orange color corresponds to the segment when the local incidence is lower than 90° (day side).
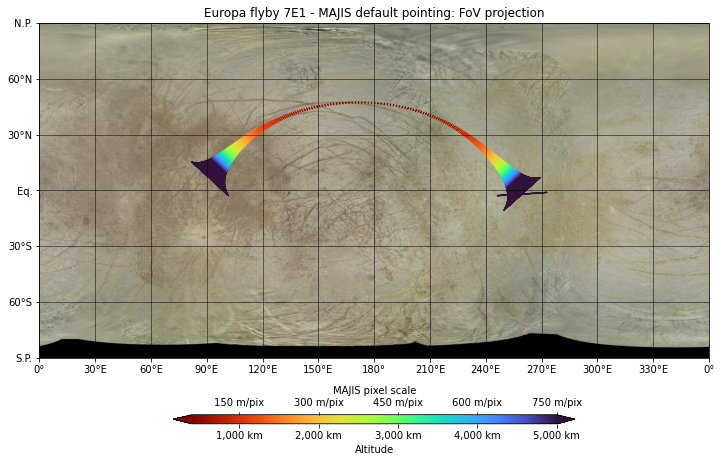
Figure 2: JUICE/MAJIS IR slit footprint during 7E1 flyby below 5,000 km. The trajectory is color-coded as a function of altitude and pixel scale.
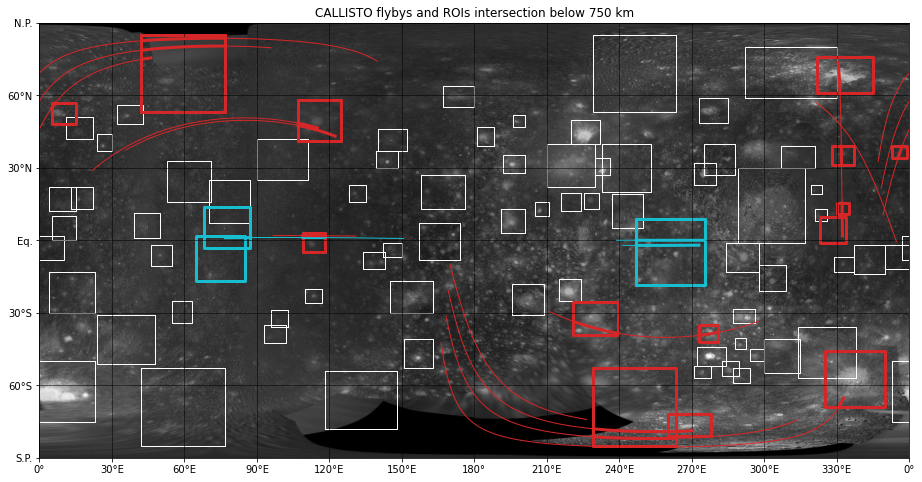
Figure 3: ESA/JUICE (red) and NASA/Europa Clipper (cyan) cumulative flybys over Callisto. The groundtrack below 750 km altitude are represented as solid lines. The large rectangles correspond to known regions of interest and are highlighted when the spacecraft groundtrack is intersecting them [3].
Resources: The source-code of the moon-coverage is publicly available on the JUICE Gitlab and distributed under open-source BSD license (https://moon-coverage.univ-nantes.fr). It is continuously tested on Python 3.8+ version and regularly deployed on PyPI. An extensive documentation is also available online with many examples than can be reproduced in Jupyter environments locally or ESA DataLabs.
Future developments: Currently the spacecraft/instrument pointing is based on the default camera kernels (ck). In a future release, we will allow the user to provide a Planning Timeline Request file (PTR) to perform custom adjustment of the attitude. We will also support planetary projections to display the result in polar/orthographic/sinusoidal views.
Acknowledgments: The moon-coverage is under active development at LPG (CNRS) and funded by ESA under 4000127262/19/ES/CM contract.
References: [1] Acton (1996) PSS, [2] Annex et al. (2020) JOSS, [3] Stephan et al. (2021) PSS
How to cite: Seignovert, B., Tobie, G., Vallat, C., Altobelli, N., and Belgacem, I.: The moon-coverage: a Python tool for mission and instrument planning, Europlanet Science Congress 2022, Granada, Spain, 18–23 Sep 2022, EPSC2022-341, https://doi.org/10.5194/epsc2022-341, 2022.
Please decide on your access
Please use the buttons below to download the presentation materials or to visit the external website where the presentation is linked. Regarding the external link, please note that Copernicus Meetings cannot accept any liability for the content and the website you will visit.
Forward to presentation link
You are going to open an external link to the presentation as indicated by the authors. Copernicus Meetings cannot accept any liability for the content and the website you will visit.
We are sorry, but presentations are only available for users who registered for the conference. Thank you.
Posters: Thu, 22 Sep, 18:45–20:15 | Poster area Level 1
- The GEM-Mars General Circulation Model
The GEM-Mars three-dimensional general circulation model [1-3] takes advantage of the operational framework and dynamical core of the Global Environmental Multiscale (GEM) model and is adapted for the simulation of the atmosphere of Mars. The model is operated on a horizontal resolution of 4° × 4° (45 by 90 grid points) and on 103 hybrid vertical levels ranging from the surface to about 150 km altitude, with a time step of 30.8246 min (1/48th of a Mars solar day or sol). GEM-Mars contains routines for radiative transfer through an atmosphere containing CO2 gas, dust, and water ice clouds, and also for subsurface heat transfer (including shallow subsurface ice at high latitudes), turbulent convection in the Planetary Boundary Layer, molecular diffusion and gravity wave drag. The model has a CO2 deposition/sublimation cycle and an interactive surface pressure correction. The vertical distribution of dust can be either self-consistently calculated from dust that is lifted from the surface by shear wind stress and dust devils or prescribed using a predefined vertical profile shape. In both cases, dust total optical depths and their spatiotemporal variation can also be chosen to be constrained by a dust optical depth climatology.
The atmospheric fields from the simulations can be used as a reference, for inputs to retrieval codes and other models, and for comparisons to observations from the surface or orbit. GEM-Mars is the main a priori provider for retrievals from NOMAD. Properties and composition of the simulated atmosphere are given over the whole planet with seasonal and diurnal cycles represented. Two simulated years are provided, one of which includes the global dust storm of 2018 (Mars Year 34) and the next year with lower dust conditions. The data provided are from simulations described in [3]. Global coverage of a single Martian day (sol) is provided every 10 solar longitudes so that seasonal and diurnal cycles are represented.
- The GEM-Mars data service
The data service is set up with DaCHS software [4] and is accessible through the VESPA portal (http://vespa.obspm.fr/) [5] and other TAP interfaces including, e.g., Jupyter notebooks. Coverages are provided by the EPN-TAP parameters which allow searches on specific conditions (Ls, local time, location, etc). The “granule uid” parameter is of the form “GEM-Mars_myearA_latB_lonC_lsD_lstE” where A is the Martian year (34 or 35), B is the latitude (degree), C is the longitude (degree), D is the solar longitude (degree) and E is the local solar time (0-24). The data can be provided for any combination of those coordinates and time. The “access_url” launches a python WSGI API that reads the user-supplied geometry (Mars Year, solar longitude, latitude, longitude, and local solar time) in the URL, processes the interpolation among the GEM-Mars data and returns a VOTABLE (XML document). Fields included in the VOTABLE are profiles of temperature, pressure, air density, mixing ratios of CO2, H2O (vapor and ice) and O3. Surface values of temperature, CO2, and H2O ice are also given with the local time and solar zenith angle. An example of “access_url” is https://gem-mars.aeronomie.be/vespa-gem?myear=34&lat=-88&lon=328&ls=0&lst=2 and follows the same nomenclature as the “granule_uid” described previously. The VOTABLE is generated “on the fly” at user request and can be read with VO tools like TOPCAT [6]. Figure 1 shows an example of quick plots that can be produced with TOPCAT and the data from a GEM-Mars VOTABLE.
The interpolation methodology is very similar to the one documented in the MCD user manual. Based on the year, the routine finds the 4 Ls and LST pairs that bound the user-supplied geometry. For each pair, the GCM fields are interpolated to the target latitude and longitude using bi-spherical interpolation. These 4 pairs are then interpolated to the target Ls and LST using bi-linear interpolation. Finally, the surface topography is interpolated from the MOLA database, and the final atmospheric altitude and pressure grid are adapted to the change in surface topography.


Figure1: Example of plots made with the TOPCAT software and some data from GEM-Mars for Martian year 35, a solar longitude of 350°, a local time of 14 h, a latitude of 4° North and a longitude of 180°.
References
[1]Neary, L., & Daerden, F. Icarus, 300, 458–476. 2018,
[2]Neary, L., et al. Geophysical Research Letters, 47, 2020,
[3]Daerden, F., et al. Geophysical Research: Planets 127, 2022,
[4]Demleitner, M. et al. Astronomy and Computing, 7-8, 27-36, 2014,
[5]Erard, S. et al., Planetary and Space Science, 150, 65-85, 2018,
[6]Taylor M., Astronomical Society of the Pacific Conference Series, 347, 2005.
How to cite: Trompet, L., Daerden, F., Neary, L., Erwin, J., Vandaele, A. C., and Erard, S.: GEM-Mars GCM products and tools available through the VESPA portal., Europlanet Science Congress 2022, Granada, Spain, 18–23 Sep 2022, EPSC2022-4, https://doi.org/10.5194/epsc2022-4, 2022.
Direct link to the interactive map: https://maps.planet.fu-berlin.de/jezero
Introduction: We welcome you to explore the landing site of the Mars 2020 Perseverance rover in an interactive hiking map loaded with orbital imagery, terrain data and virtual 3D panoramic views of Jezero crater and its surrounding area! The map allows fast zooming and panning for the exploration of the available data in several magnitudes of scale levels from far away until centimeter detail. It also seamlessly integrates several waypoints with pre-rendered virtual 360° panoramas and several real panoramas each stitched together from a multitude of single images of the MastcamZ instrument.
System Design: The general architecture follows the principles used for the HRSC Mapserver [1], see Figure 1. In contrast to the Mapserver’s intended use as a science-based data-portal and dissemination platform, the Jezero map was also planned as an public outreach application. But it serves as the first prototype of a next-generation infrastructure for disseminating upcoming data products from Freie Universität. Major parts of the existing set-up could be re-used but had to be updated. The layer menu had to be completely re-designed as it was implemented statically and hard-wired into the main code, which made it impossible to maintain and update its module dependencies. The most fundamental changes to the HRSC Mapserver are:
- Integrated A-Frame panoramic views, enabled switching between map views and 3D/VR/AR scenes
- Sidebar element for improved user experience on mobile devices and small screens, by Tobias Bieniek (https://github.com/Turbo87/sidebar-v2)
- LayerSwitcher element integrated into the sidebar, by Matt Walker (https://github.com/walkermatt/ol-layerswitcher)
- Transition from OpenLayers 3 to OpenLayers 5 involving a major migration from the underlying Google™ Closure compiler infrastructure to ES-based modules
- Usage of the Parcel packager to bundle the application for production
- IAU2015-based Mars spatial reference system as the base reference

Figure 1: Flow chart of the web-GIS application’s general system design outlining front-end (client) and back-end (server) components.
Data: The base layer of the customized map consists of a merged data-set from three different instruments. The Mars Express High-Resolution Stereo Camera (HRSC, [2]) Mars-Chart 30 data [3] are used as reference data-sets providing the geodetically controlled topography base and the seamless base imagery covering the complete landing site. 33 single images of the Mars Reconnaissance Orbiter (MRO) Context Camera (CTX, [4]), empirically corrected for their inherent ”smile” effect and bundle-adjusted with absolute geodetic control to the HMC-13E tile [5]. The single CTX images have then been radiometrically normalized using the HMC13 tile as brightness reference with the well-established methods from [6], re-implemented and adapted to CTX. To provide the orbital image data from the landing site in the highest available detail, we included image and topography data from the MRO High Resolution Imaging Science Experiment (HiRISE, [7]). We use the ortho-rectified image mosaic provided by the Terrain Relative Navigation (TRN) team of the JetPropulsion Laboratory (JPL) [8], which provided sufficient alignment to the underlying CTX and HRSC reference data. All three data-sets have been colourised by the HRSC color channels using pan-sharpening techniques and logarithmically stretched to Byte format.
Outlook: The new web-GIS client presented here will also serve as the prototype for the re-design of the HRSC Mapserver for data dissemination and download. Its unique features for single image visualization and download will be re-implemented and integrated into the new design. It will serve more image data products for time-series analysis and vizualitation, mainly the complete co-registered set of CTX images.
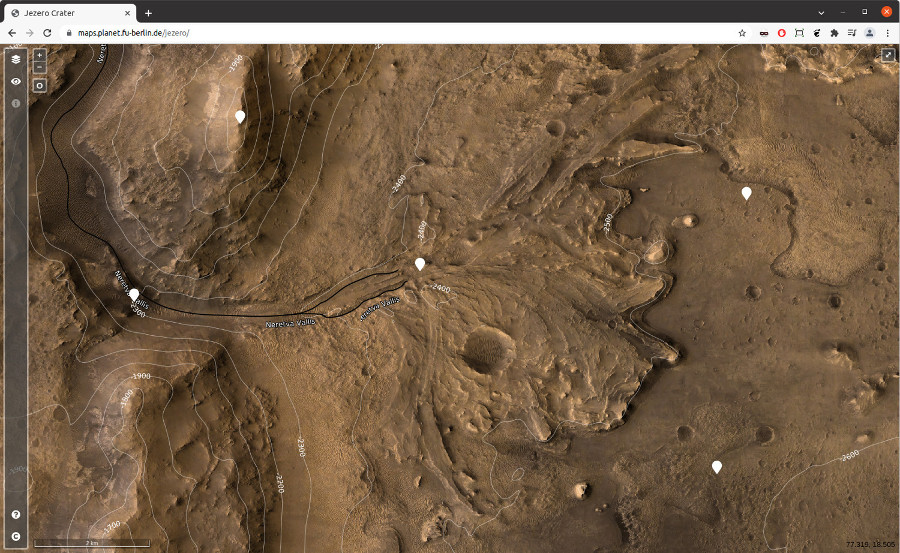
Figure 2: Jezero front-end showing the inflow-channel Neretva vallesJezero delta as a map frame. The droplet icons are clickable and switch the interface from the web-based view to the 3D-virtual panorama view as seen in Figure 3.
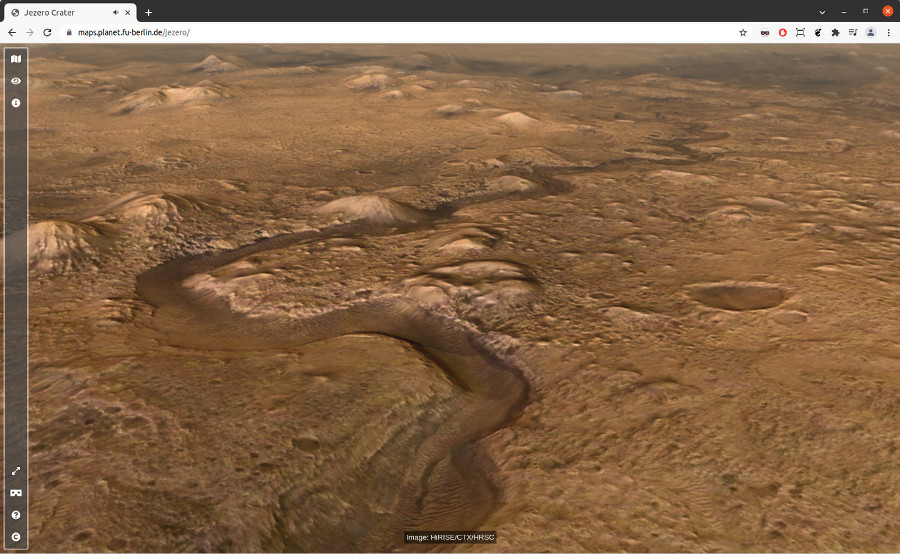
Figure 3: Jezero front-end showing the 3D-virtual panorama view of the ”Pliva Vallis” outflow channel. The underlying A-Frame library allows 360 degree-orientation in 3D or VR.
Acknowledgements: This work is supported by theGerman Space Agency (DLR Bonn), grant 50OO2204, on behalf of the German Federal Ministry for Economic Affairs and Climate Action.
References: [1] S.H.G. Walter et al., ESS 7 (2018). [2] R. Jaumann et al., PSS 55 (2007). [3] K. Gwinner et al., PSS 126 (2016). [4] M. C. Malin et al., JGR Planets (2007). [5] A. Neesemann et al., LPSC 52, 2021, #2509. [6] G. Michael et al., PSS 121 (2016). [7] A. S. McEwen et al., JGR Planets (2007). [8] R. L. Fergason et al., LPSC 51, 2020, #2020.
How to cite: Walter, S., Gross, C., Neesemann, A., Munteanu, R., Jaumann, R., Postberg, F., and Bell, J.: An Interactive Virtual Hiking Map for Jezero Crater, the Mars 2020 Perseverance Rover Landing Site, Europlanet Science Congress 2022, Granada, Spain, 18–23 Sep 2022, EPSC2022-32, https://doi.org/10.5194/epsc2022-32, 2022.
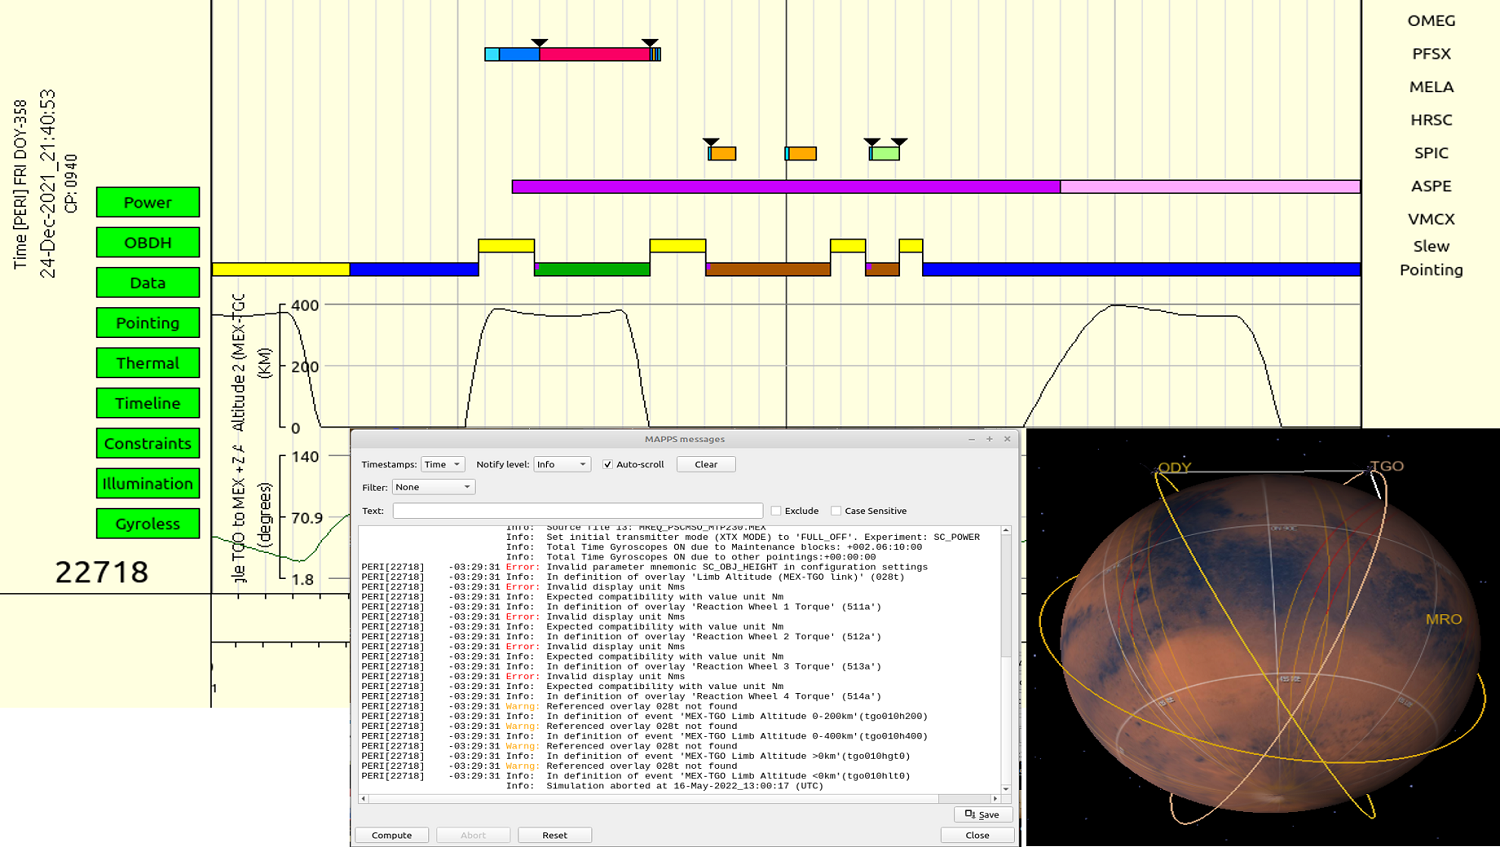
The Mission Analysis and Payload Planning System (MAPPS) is a multi-mission software system developed during the last 20 years to support the science operations planning for the ESA solar system missions at the European Space Astronomy Centre (ESAC) near Madrid.
Developed initially only to visualise the coverage of MEX experiments onto the Martian surface. The tool has been evolved progressively to satisfy planning requirements for the different missions that have been launched in the last two decades: SMART-1, Venus Express, Rosetta, Mars Express, Exomars TGO, Bepi Colombo, Solar Orbiter, Juice and EnVision.
The planning requirements sometimes are specific to a mission and on other occasions they are contradicting. As an example, consider the power and thermal requirements of a mission like Bepi Colombo, very close to the sun, in contrast to those same requirements for a mission like Juice, very far away. The complexity of these requirement implies that the software needs to be very configurable and continuously adapting to the needs of each mission.
In recent years, there has been the need to extend even further the tool to support multi-body and constellation coordination capabilities.
In the case of Juice, the spacecraft will spend many months orbiting Jupiter and three of its Jovian moons. This has required a big effort to modify the existing features and observations in MAPPS that were initially developed for a central body to be able to cope with several bodies.
In the case of Mars, the arrival of new spacecrafts and rovers has broadened what can be done scientifically as well as opening the international collaboration among agencies. MAPPS has been extended to facilitate the collaboration with other Mars missions, in particular the new radio-science experiment between MEX-TGO [1], various communication tests between ESA and NASA orbiters, and the regular data relays in support of all surface assets, including the new Chinese Zhurong mission.
Here we present how MAPPS has contributed and supports the Science Ground Segment teams in ESA to achieve their goal of planning scientific operations in an efficient and optimised way, together with the new features implemented for the ever more demanding needs of the new scientific missions.
[1] Cardesin Moinelo, A. et al: First year of coordinated science observations by Mars Express and ExoMars 2016 Trace Gas Orbiter, ICARUS 353, 2021
How to cite: Muñiz Solaz, C., Cardesin-Moinelo, A., Nespoli, F., Martin, P., Marin-Yaseli de la Parra, J., Merrit, D., Sierra, M., and Esquej, P. and the ESA Planetary Science Operations Centres: MAPPS as a multi-mission and multi-body Science Planning and Simulation Tool for ESA solar system missions, Europlanet Science Congress 2022, Granada, Spain, 18–23 Sep 2022, EPSC2022-294, https://doi.org/10.5194/epsc2022-294, 2022.
Introduction:
The Multi-Temporal Database of Planetary Image Data (MUTED) is a comprehensive web-tool to identify and to access orbital images of Mars, Moon, and Mercury. The database is available at https:\\muted.wwu.de and provides various tools for the identification of multi-temporal images of the major space missions as a basis for diverse surface change analyses [1, 2]. Multi-temporal images, i.e., images covering the same surface at different times, are essential for the analysis and understanding of short-term, long-term, and seasonal processes on the surface of Mars, Moon, and Mercury.
Tools and services:
The multi-temporal database combines several tools for the selection, visualization, and processing of planetary data. Users can explore the planetary bodies using diverse global base maps (spectral, topographic, geologic information). The planetary bodies are visualized as spheres or in Mercator map projection. On top of the global base maps, planetary data of various missions can be visualized globally or for a user-defined region of interest. The data can be filtered by various attributes (e.g., acquisition date or solar longitude). Additional information, e.g., data acquisition time, the temporal and spatial context, as well as preview images and raw data download links are available for each image.
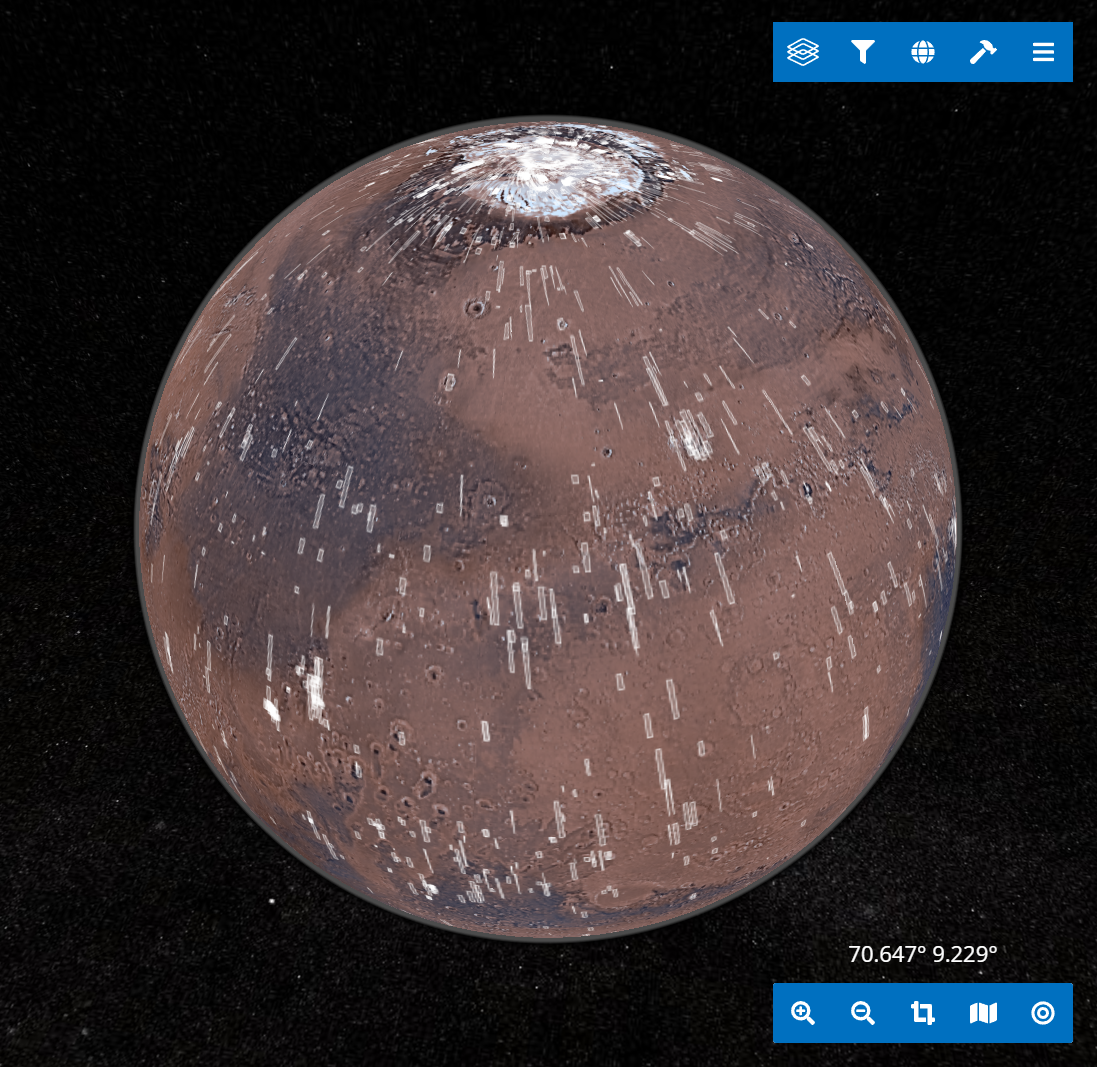
Figure 1: User interface of the multi-temporal database showing the intersections of CTX images with a temporal distance of 7 days (white polygons). Areas with a high temporal coverage, e.g., the pole regions as well as selected observation sites are ideal to study short-term surface changes, e.g., expansion and retreat of the seasonal surface ice and frost.
A key feature of the multi-temporal database is the intersection tool, that visualizes the intersection areas of overlapping images (Fig. 1). Based on user-defined parameters, such as datasets and the time interval between overlapping images, users are able to identify the spatial intersections on top of the global base maps. High-resolution previews as well as metadata, including e.g., download links of multi-temporal images provide the basis for diverse analyses of short- or long-term surface changes and processes.
The timeline tool is another key feature to explore the multi-temporal coverage of planetary surfaces. Images within an area of interest can be displayed in chronological order, allowing a quick overview of data availability and temporal context. Amongst others, it can be used to identify an overlapping dataset with the smallest or the longest time-interval (Fig. 2).
In addition to data identification tools the multi-temporal database offers a data processing service in order to facilitate the access to planetary image data. The processing service helps to reduce the amount of data as well as processing time by providing image data on demand, fitting to the user-defined research area and settings. After processing of the images which includes the calibration, georeferencing, and clipping of the images to the user-defined AOI, the processed images are available in a standard image file format (GeoTIFF).
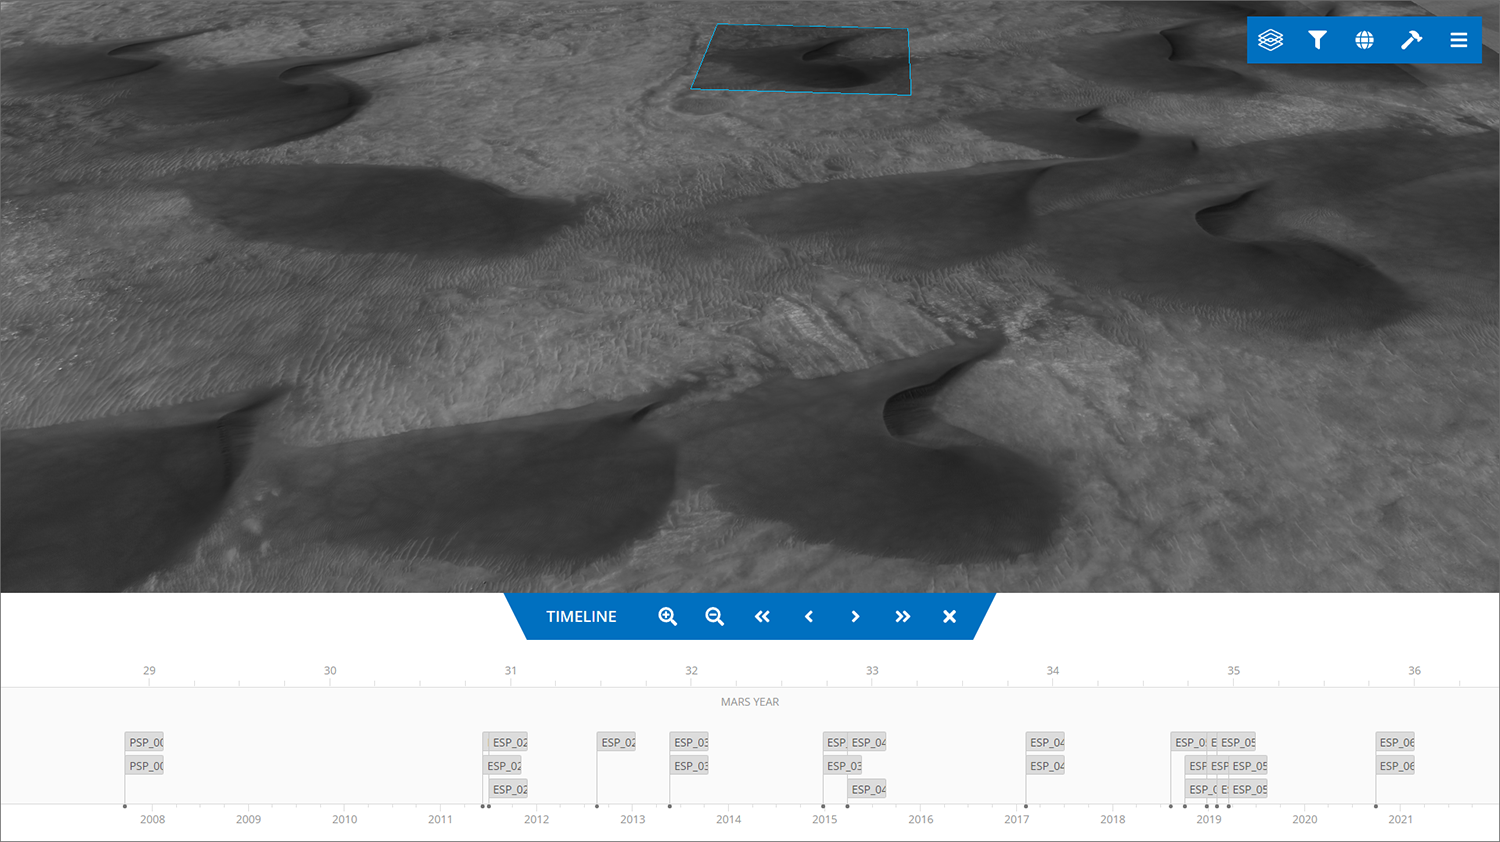
Figure 2: User interface of the multi-temporal database showing the temporal coverage of HiRISE images for a research area at Green Crater in the Noachis Terra region in the southern hemisphere of Mars. The timeline tool at the bottom reveals a good temporal coverage to analyze dune migration over several martian years.
Scientific applications:
The multi-temporal database enabled several studies on past and present-day changes of the surface of Mars [2-6]. In particular, the database has been used in recent projects on the contemporary activity of dark slope streaks [2-4] and martian gullies [5, 6]. Furthermore, the database has been used for data selection as a basis for geological mapping in several projects [e.g., 7, 8].
Acknowledgments:
This research has been funded and supported by the German Aerospace Agency (DLR) (Grant # 50 OO 2102).
References:
[1] Erkeling et al. (2016) PSS, 125, 43-61. [2] Heyer et al. (2018) PSS, 159, 56-65. [3] Heyer et al. (2019) Icarus, 323, 76-86. [4] Heyer et al. (2020) Icarus, 351, 113951. [5] Raack et al. (2020) Icarus, 350, 113899. [6] Sinha et al. (2020) Icarus, 352, 113979. [7] Bernhardt et al. (2019) PSS, 321, 171-188. [8] Cairns et al. (2020) LPSC 51, #1929.
How to cite: Heyer, T., Hiesinger, H., Iqbal, W., and Schmedemann, N.: The Multi-Temporal Database of Planetary Image Data (MUTED): A Web-Tool to Support Surface Change Analyses on Mars, Moon, and Mercury, Europlanet Science Congress 2022, Granada, Spain, 18–23 Sep 2022, EPSC2022-428, https://doi.org/10.5194/epsc2022-428, 2022.
Introduction: The present abstract is intended to show the current ESA’s Planetary Science Archive (PSA) [1] in terms of architecture/infrastructure and the future interfaces and technologies which will be used in the next generation archive.
These improvements range from a new graphical user interface developed in Angular to a TAP+ (Table Access Protocol) service as a single access to the data, through a new way of releasing new versions of the PSA more frequently to the scientific community.
The PSA development team expects to release this new generation of the PSA this summer 2022.
PSA current architecture: The PSA architecture and the technologies involved in its development have only undergone incremental updates in the last 6 years, and are now seen as somewhat obsolete. The front-end has been implemented using the Vaadin framework, which was initially a good strategy, but over time became onerous to maintain (e.g., dealing with JavaScript libraries, wasting time in wrapping some required extensions in Java).
Also, from the back-end point of view, there are many interfaces/libraries to access the database (JDBC, PDAP, Data Distribution, etc) forcing us to double the effort when changing the API (see Figure 1: PSA current architecture)
In addition, the PSA release approach has not followed a truly Agile approach, taking too long in releasing operationally. This is mainly due to the fact there is no a fully CI/CD strategy to be executed in the environments, leading to very manual release process with manual interventions. Also there are additional problems such as the synchronisation of the repositories when releasing, which strongly depends on the IT department.
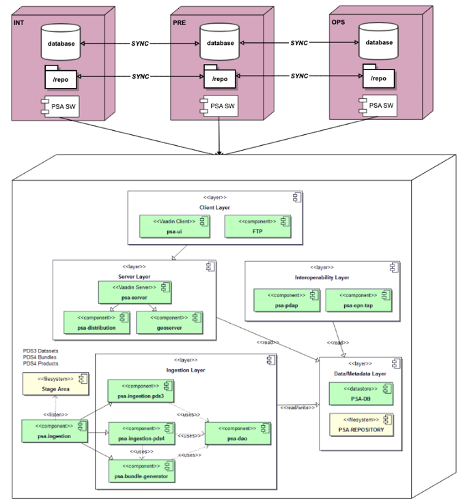
Figure 1: PSA current architecture
New interfaces, technologies and infrastructure at PSA: After one year and half of development, the PSA development team has been able to achieve several goals on the roadmap to a new archive. Mainly, we will rely on a new graphical user interface implemented under the Angular framework (see Figure 2: Future PSA Graphical User Interface). There have been various reasons to migrate to this new technology: Faster development for maps visualisation and 3D interfaces, alignment within the ESDC department in a common front-end framework and also, the discontinuation of Vaadin 8 from March 2022 on.
This future GUI will have a modern look and feel, with some relevant changes in line with the new ESA branding. Specially on the home view, where there are now card layouts to access the data from missions/instruments, targets and maps and a prototype traverse view for the ExoMars Rover mission, among other features. This new Angular framework has definitely sped the development up when modifying some JavaScript libraries, creating some end-to-end tests on top through Cypress, etc. This will also increase the performance on the client side consequently improving the user experience. In addition, this implementation is also mobile and tablet friendly/responsive.
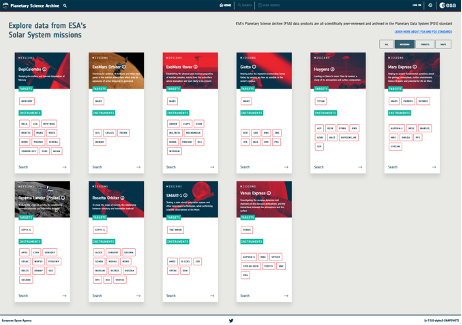
Figure 2: Future PSA Graphical User Interface
Also, the new PSA will count on a single access point to the data through TAP+ (even private data) to homogenise the access by offering a single API, instead of using different interfaces/protocols (JDBC, PDAP, etc.) to access the information.
In addition to these new interfaces, the PSA is making a huge effort to set up an infrastructure to support a faster deployment cycle in order to be more agile according to the scrum methodology. This implies integrating and deploying the software (after checking metrics in Sonar, passing the end-to-end tests, etc.) as nightly builds into a safe environment (pre-production) so that the Archive Scientists can test the latest features which, once approved, will go to the operational environment. This follows mostly a DEV-OPS infinite loop but having a middle environment (PRE) in which the scientists can safely test the features.
Conclusion: The current PSA development team along with the Science Lead and all of the Archive Scientists are working together to produce a new generation of the planetary archive, with these features:
- a more modern and responsive GUI based on a stable and well-known technology
- a single access route to the data with authentication and authorization for private products (TAP+)
- a new infrastructure of environments which allow a more efficient CI/CD so that the features can be validated earlier, allowing the PSA to offer releases in the operational environment more frequently.
References:
[1] Besse, S. et al. (2017) Planetary and Space Science, 10.1016/j.pss.2017.07.013, ESA's Planetary Science Archive: Preserve and present reliable scientific data sets.
Acknowledgments: The authors would like to thank everybody, especially the PSA development team, who have contributed to the development of the PSA in the recent years and the incoming new generation of the archive.
How to cite: Docasal, R., Felix-Redondo, F., Oliveira, J., Osinde, J., Raga, F., Saiz, J., Valles, R., Merin, B., Bentley, M., Coia, D., Grotheer, E., Heather, D., and Lim, T.: ESA’s Planetary Science Archive: present and future, Europlanet Science Congress 2022, Granada, Spain, 18–23 Sep 2022, EPSC2022-127, https://doi.org/10.5194/epsc2022-127, 2022.
Introduction: In this abstract we present a tool developed mainly in preparation of the ESA JUpiter ICy moons Explorer (JUICE) mission, scheduled to launch in April 2023 and arrive at the Jupiter system in July 2031, which however can be applied also to hyperspectral data acquired by past and ongoing missions such as Galileo, Cassini, and Juno.
Laboratory and telescopic spectroscopy measurements in the VIS—NIR are the primary observational data for identifying the composition and/or mineralogy of the icy satellites of giant planets. This technique allows one to discern between exogenous and endogenous compounds, and to identify the regions of the satellites in which the exchange of material between the surface and the shallow subsurface has been more frequent in the past.
We started from laboratory spectra of chemical compounds known or expected to exist on the surface of icy satellites and small icy bodies to build an interactive Excel database that provides a quick and easy way to derive spectral endmembers that can be used to perform spectral unmixing.
Methods: We consider multiple chemical species relevant for the surfaces of icy satellites, trans-Neptunian objects (TNOs) and comets, such as volatiles, mineral salts, organics, tholins, cyanide/nitrile compounds, and exogenous products. About 100 chemical compounds and over 1600 laboratory spectra were collected, and it is routinely updated once new laboratory data relevant for the icy surfaces are made available. This large amount of data is recovered from past literature focusing on laboratory measurements (mostly from the 1990s onward) and from multiple public databases such as SSHADE [1], Goddard Space Flight Center database [2, 3], RELAB [4] and USGS Spectral Library [5].
The Excel database is organized in different columns: sample name, reference, DOI, spectral range, measured quantity (e.g., reflectance, absorbance, transmittance, optical constants, etc.), lab/instrument, temperature, grain size, and comments.
Each spectrum has a hyperlink that directly opens the related ASCII file. This is important for a quick view and comparison of the spectra. To this aim, we also have made available spectral tools written in Visual Basic for Application (VBA). These tools are easily accessible by right-clicking on the hyperlink in the Excel spreadsheet, and need no installation of separate add-ons.
The Visualize tool permits the quick-look of the spectral profile as found in the database (Fig. 1). The Convolution tool convolves the original spectral profile to a specific instrumental function (currently available are: Galileo/NIMS, Cassini/VIMS, Juno/JIRAM, and JUICE/MAJIS). At the end of the processing spectral profiles pre and post-convolution are displayed (Fig. 2) and a TXT file and a CSV file are saved.
Conclusions: In the context of the future ESA JUICE mission, tools and techniques are needed to analyze the new hyperspectral data of the surfaces of the icy Galilean satellites. To this end, we have built a database of laboratory spectra extending from the visible to the near-infrared conceived and organized in an interactive Microsoft Excel environment in such a way as to make their visualization and use as simple and fast as possible by a large audience. A further advantage of this database is to be transversal to the analysis of the spectroscopic data of past and ongoing missions that have explored the external solar system, in particular Galileo, Cassini and Juno. Furthermore, our tool could be updated to perform convolution for other instrumental responses as well.
Acknowledgments: This work is supported by the Italian Space Agency under the ASI-INAF grant agreement n. 2018-25-HH.0: “Scientific activities for JUICE”.
References: [1] Schmitt B. et al. (2018), SSHADE: "Solid Spectroscopy Hosting Architecture of Databases and Expertise" and its databases. OSUG Data Center. Service/Database Infrastructure, DOI: 10.26302/SSHADE. [2] Gerakines P. A. and Hudson R. L. (2020), https://science.gsfc.nasa.gov/691/cosmicice/constants.html. [3] Hudson R. L. et al., https://science.gsfc.nasa.gov/691/cosmicice/spectra.html. [4] Milliken R. (2020), DOI: 10.17189/1519032. [5] Kokaly R. F. et al. (2017), USGS Spectral Library Version 7: U.S. Geological Survey Data Series 1035, 61, DOI: 10.3133/ds1035
How to cite: Cofano, A., Tosi, F., and Piccioni, G.: Assessing remotely sensed data of the icy bodies with a spectroscopic tool., Europlanet Science Congress 2022, Granada, Spain, 18–23 Sep 2022, EPSC2022-285, https://doi.org/10.5194/epsc2022-285, 2022.
In the low frequency domain, the electromagnetic signatures are tracers of energetic and unstable particle populations rather than atomic and molecular transitions. Such signatures are identified with their spectral-temporal shape in time varying spectrograms. Figure 1 shows a spectrogram including Solar radio bursts (related to energetic electron beams escaping from the Sun) and terrestrial auroral kilometric radiation (related to the magnetospheric activity), observed by the Cassini/RPWS instrument during its flyby of the Earth.
How to cite: Cecconi, B., Bonnin, X., Loh, A., Louis, C., and Taylor, M.: JSON Implementation of Time-Frequency Radio Catalogues: TFCat, Europlanet Science Congress 2022, Granada, Spain, 18–23 Sep 2022, EPSC2022-426, https://doi.org/10.5194/epsc2022-426, 2022.
Please decide on your access
Please use the buttons below to download the presentation materials or to visit the external website where the presentation is linked. Regarding the external link, please note that Copernicus Meetings cannot accept any liability for the content and the website you will visit.
Forward to presentation link
You are going to open an external link to the presentation as indicated by the authors. Copernicus Meetings cannot accept any liability for the content and the website you will visit.
We are sorry, but presentations are only available for users who registered for the conference. Thank you.
Please decide on your access
Please use the buttons below to download the presentation materials or to visit the external website where the presentation is linked. Regarding the external link, please note that Copernicus Meetings cannot accept any liability for the content and the website you will visit.
Forward to session asset
You are going to open an external link to the asset as indicated by the session. Copernicus Meetings cannot accept any liability for the content and the website you will visit.
We are sorry, but presentations are only available for users who registered for the conference. Thank you.