TP6
Session assets
Orals: Tue, 20 Sep, 15:30–16:55 | Room Albéniz+Machuca
We applied advanced light-scattering models on laboratory measurements to retrieve the scattering properties of Martian dust analogues JSC Mars-1, MMS-2, and MGS-1. The retrieval was performed in two parts: first, we computed the optical constants of the three samples. Then, the obtained values were used together with two different scattering databases to model the measured scattering matrices of the samples.
Optical constants are needed from modelling single-scattering within the atmospheric dust to simulating the global Martian climate. Reliable complex refractive indices of Martian dust are difficult to find in the literature. Previous studies by Wolff et al. (2009) & (2010) have obtained optical constants from analysing the observed dust storm spectra at 258-2900 nm region by using cylindrical particle shapes. However, these values could not be supported with direct laboratory measurements. In this work, we retrieved the complex refractive indices of the three Martian dust analogues at UV-vis-NIR wavelengths by using the measured size distributions, diffuse reflectance spectra, and an advanced light-scattering model with realistic particle shapes.
The scattering properties of the analogues were retrieved by utilizing the derived refractive indices, measured scattering matrices, and two databases of single scattering properties of triaxial ellipsoids (Meng et al. 2010) and hexahedral shapes (Saito et al. 2021) The databases have been developed by a combination of three computational methods: the T-matrix method, the discrete dipole approximation (DDA), and an improved geometric optics method. Each database consists of pre-calculated scattering properties over a broad range of complex refractive indices, particle sizes, particle shapes, and wavelengths. The modelled scattering matrices were then compared with those obtained using spherical shapes. Finally, the best-fit model gives us physical properties of the particles such as cross sections, single scattering albedos, extinction efficiencies, asymmetry factors, and Legendre polynomials used to mathematically calculate the phase functions.
References: Wolff et al. (2009), JGR Planets, 114, E00D04 ; Wolff et al. (2010), Icarus, 208, 143-155 ; Meng et al. (2010), J. Atmos. Sci., 41.5: 501-512 ; Saito et al. (2021), J. Atmos. Sci., 78, 2089-2111.
How to cite: Martikainen, J., Muñoz, O., Jardiel, T., Peiteado, M., Gómez Martín, J. C., and Team, T. R.: Retrieving scattering properties of Martian dust analogues by modelling light scattering, Europlanet Science Congress 2022, Granada, Spain, 18–23 Sep 2022, EPSC2022-75, https://doi.org/10.5194/epsc2022-75, 2022.
Polarimetry of sunlight that is reflected by a planet or that is transmitted through its atmosphere is a powerful tool for the characterisation of the planetary atmosphere and, if present, the surface. The main reason for the power of polarimetry is that the angular distribution of the degree of linear polarisation of sunlight that has been singly scattered by particles in the atmosphere or on the surface is very sensitive to the microphysical properties of these particles (their size, shape, and composition), indeed much more sensitive than the total flux is [see 1, 2, 3]. And because multiple scattered light usually has a low degree of polarisation, it might decrease the overall degree of polarisation of the light that emerges from the planetary atmosphere, but the angular pattern, which holds the crucial information about the scatterers, will remain. A classic example of the power of polarimetry was the derivation of the size distribution, composition, and altitude of the particles constituting Venus’s main cloud deck from Earth-based, disk-integrated polarimetry across a wide phase angle range and at a few wavelengths [4]. Since then, spectrometers with some polarimetric capabilities have flown on, for example, the Pioneer Venus, Galileo, and Cassini missions. The POLDER polarimeter has flown on various Earth observing missions, and NASA’s Earth remote-sensing PACE mission with SPEXone [5] onboard is scheduled for launch in 2024.
Mars, with its dust storms, its water and carbon-dioxide ice clouds, and dusty surface, appears to be an ideal target for polarimetry. The polarimetric attention for this planet has, however, been surprisingly limited. Two linear polarimeters have flown onboard the Soviet spacecraft MARS-5 and provided some information about mostly ice cloud particle shapes, sizes, and composition, even though they encountered a very clear Martian atmosphere during their short active measurement period [6, 7]. And, indeed, HST observations show linear polarisation variations that correlate with the presence of clouds and dust [8]. However, with HST orbiting the Earth, these observations were necessarily done with Mars at a small phase angle; the measured degrees of polarization are therefore very small and the angular range extremely limited. To truly enjoy the advantages of polarimetry for Mars remote-sensing, a polarimeter should either orbit the planet or be landed on the surface, because only then a range of scattering angles holding most of the information would be within reach.
We will describe the case for martian spectropolarimetry from an orbiter or a lander/rover, highlighting the potential for characterisation of the atmospheric dust and clouds and of the surface, and also covering the use of circular polarimetry for identifying chiral signatures [9,10] that on Earth are typical for life. Traditionally, polarimeters have been based on polarisers in rotating filter wheels. Such designs are neither robust nor do they achieve the accuracy that fully unlocks the power of polarimetry. We will present an innovative, compact, robust (no moving parts), and accurate type of spectropolarimeter [11] whose flexible design allows incorporation on various vehicles. Finally, the analysis and interpretation of martian spectropolarimetric measurements requires radiative transfer algorithms that fully include linear (and circular) polarimetry. We will describe a few available algorithms and discuss laboratory measurements of light scattering properties of various types of atmospheric particles and surfaces that would improve the radiative transfer computations and with that the interpretation of (future) spectropolarimetry of Mars.
References
[1] J. E. Hansen and L. D. Travis. Light scattering in planetary atmospheres. Space Sci. Rev., 16:527–610, 1974.
[2] M. I. Mishchenko and L. D. Travis. Satellite retrieval of aerosol properties over the ocean using polarization as well as intensity of reflected sunlight. J. Geophys. Res., 102:16989–17014. doi: 10.1029/96JD02425, 1997
[3] Y. Shkuratov, N. Opanasenko, E. Zubko, Y. Grynko, V. Korokhin, C. Pieters, G. Videen, U. Mall, and A. Opanasenko. Multispectral polarimetry as a tool to investigate texture and chemistry of lunar regolith particles. Icarus, 187:406–416. doi: 10.1016/j.icarus. 2006.10.012, 2007
[4] J. E. Hansen and J. W. Hovenier. Interpretation of the Polarization of Venus. J. Atmos. Sci., 31:1137–1160, 1974.
[5] F. Snik, J. H. Rietjes, G. Van Harten, D. M. Stam, C. U. Keller, J. M. Smit. SPEX: the spectropolarimeter for planetary exploration. Proc. SPIE 7731:77311B. doi: 10.1117/12.857941, 2010.
[6] R. Santer, M. Deschamps, L. V. Ksanfomaliti, and A. Dollfus. Photopolarimetric analysis of the Martian atmosphere by the Soviet MARS-5 orbiter. I - White clouds and dust veils. Astron. Astrophys., 150:217–228, 1985.
[7] R. Santer, M. Deschamps, L. V. Ksanfomaliti, and A. Dollfus. Photopolarimetry of Martian aerosols. II - Limb and terminator measurements. Astron. Astrophys., 158:247–258, 1986.
[8] Y. Shkuratov, M. Kreslavsky, V. Kaydash, G. Videen, J. Bell, M. Wolff, M. Hubbard, K. Noll, and A. Lubenow. Hubble Space Telescope imaging polarimetry of Mars during the 2003 opposition. Icarus, 176:1–11. doi: 10.1016/j.icarus.2005.01.009, 2005
[9] W. Sparks, J. H. Hough, Th. A. Germer, F. Robb, and L. Kolokolova, Remote sensing of chiral signatures on Mars, Planet. Space Sci. 72, doi: 10.1016/j.pss.2012.08.010, 2012
[10] W. Sparks, J. H. Hough, and L. E. Bergeron, The search for chiral signatures on Mars, Astrobiology, 5, doi: 10.1089/ast.2005.5.737, 2005
[11] D. M. Stam, E. Laan, F. Snik, T. Karalidi, C. Keller, R. ter Horst, R. Navarro, C. Aas, J. De Vries, G. Oomen, R. Hoogeveen, Polarimetry of Mars with SPEX, an innovative spectropolarimeter, Third International Workshop on The Mars Atmosphere: Modeling and Observations, LPI Contributions, Vol. 1447, 2008.
How to cite: Stam, D.: Spectropolarimetry of Mars: Why and how?, Europlanet Science Congress 2022, Granada, Spain, 18–23 Sep 2022, EPSC2022-675, https://doi.org/10.5194/epsc2022-675, 2022.
Introduction
The nature, size and content of aerosols in the atmosphere affect the energy budget on all planets, hence the atmospheric dynamic of the planet. Mars exhibits three types of atmospheric aerosol. Mineral dust, water ice and carbon dioxide ice. Martian aerosols nature and size distribution were observed using many different methods and experiments, from rovers to satellites. Exhaustive review scan be found in [1] and in [2]. Usually, dust effective radius, reff, ranges from 1 to 2 μm and its effective variance, νeff, from 0.2 to 0.4. H2O ice reff ranges from 1 to 5 μm and its νeff from 0.1 to 0.4. However, these two parameters and their variability are poorly constraint in the vertical to date. ExoMars TGO mission (ESA/Roscosmos) was primarily designed to study trace gases, thermal structure and aerosol content in Mars atmosphere with unprecedented vertical resolution [3].
NOMAD-SO Data processing
NOMAD (Nadir and Occultation for MArs Discovery) is suite of two infrared spectrometers onboard the ExoMars 2016 Trace Gas Orbiter (TGO) orbiter, covering the spectral range of 0.2 to 4.3 μm [4]. An Acousto-Optical Tunable Filter (AOTF) is used to select different spectral windows. The sampling of this channel is approximately of 1 second, allowing a vertical sampling about 1km. the SO channel is able to observe the atmosphere at a given altitude with 6 different diffraction orders. For this study, we selected a configuration of 5 diffraction orders (121,134,149,168,190) effectively spanning the overall spectral range of NOMAD.
In order to evaluate the local extinction due to aerosols, we use an inversion program called Retrieval Control Program (RCP). It is a multi-parameter non-linear least squares fitting of measured and modelled spectra [5]. Its forward model, KOPRA, was recently adapted to limb emissions on Mars [6] and for solar occultation data on Mars for the first time. RCP solves iteratively the inverse problem [7] and is described in details in [8]. The regularization matrix is build from Tikhonov-type terms of different orders which can be combined to obtain a custom-tailored regularization for any particular retrieval problem.
An example of the retrieved extinction profile is shown in Fig 1. The retrieved extinctions differs from previous work on aerosols using ACS data [9,10] using the Onion-peeling or Abel's transform method since this global fit is less affected by the large error propagation to low altitudes typical of those methods, and the lower Martian atmosphere is precisely where aerosols are particular relevant.
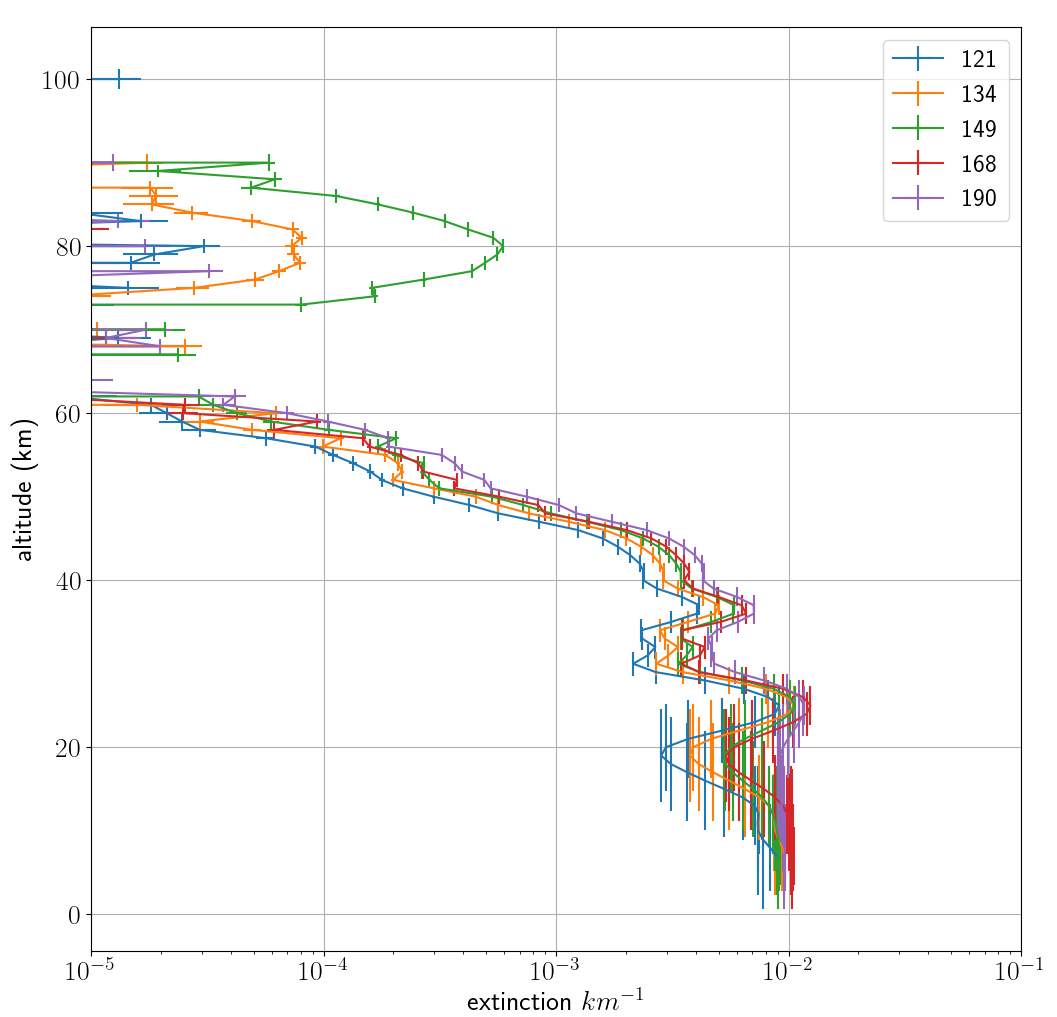
Fig 1.
Mean extinction cross-section ratio modelling
In order to model the optical behavior of the Martian aerosol we chose the log-normal distribution which is widely used in atmospheric sciences. It is a function of two parameters (rg, σg). In optics, we change those parameters to more suitable ones, the effective radius, reff and its corresponding effective variance νeff. For any aerosol size distribution, the extinction k is km-1 is k(λ) = N . σext (λreff,νeff). N is the aerosol number density and σext (λ,reff,νeff) is the mean average extinction cross-section at a wavelength λ, a specific aerosol distribution defined by (reff,νeff). We build a look-up table of dust and water ice σext at the selected NOMAD order's wavelengths for different sets of (reff,νeff). The extinction are evaluated with a Lorenz-Mie code for polydisperse spherical particle from [11].
Aerosol composition and size distribution evaluation
We will detail the process of evaluating the aerosol composition and size distribution that consists of a mix of non-linear least square and brute force in order to evaluate the best set of parameters (reff,νeff ,γ) where γ represent a mixture of dust and H2O ice. The NLSQ algorithm is provided by the SciPy Python package [12]. To assess the robustness and limitations of our evaluation procedure, we will present results against synthetic extinction signal. We will discuss our main results, especially for the period covering the Global Dust Storm of MY34 (Fig 2.).
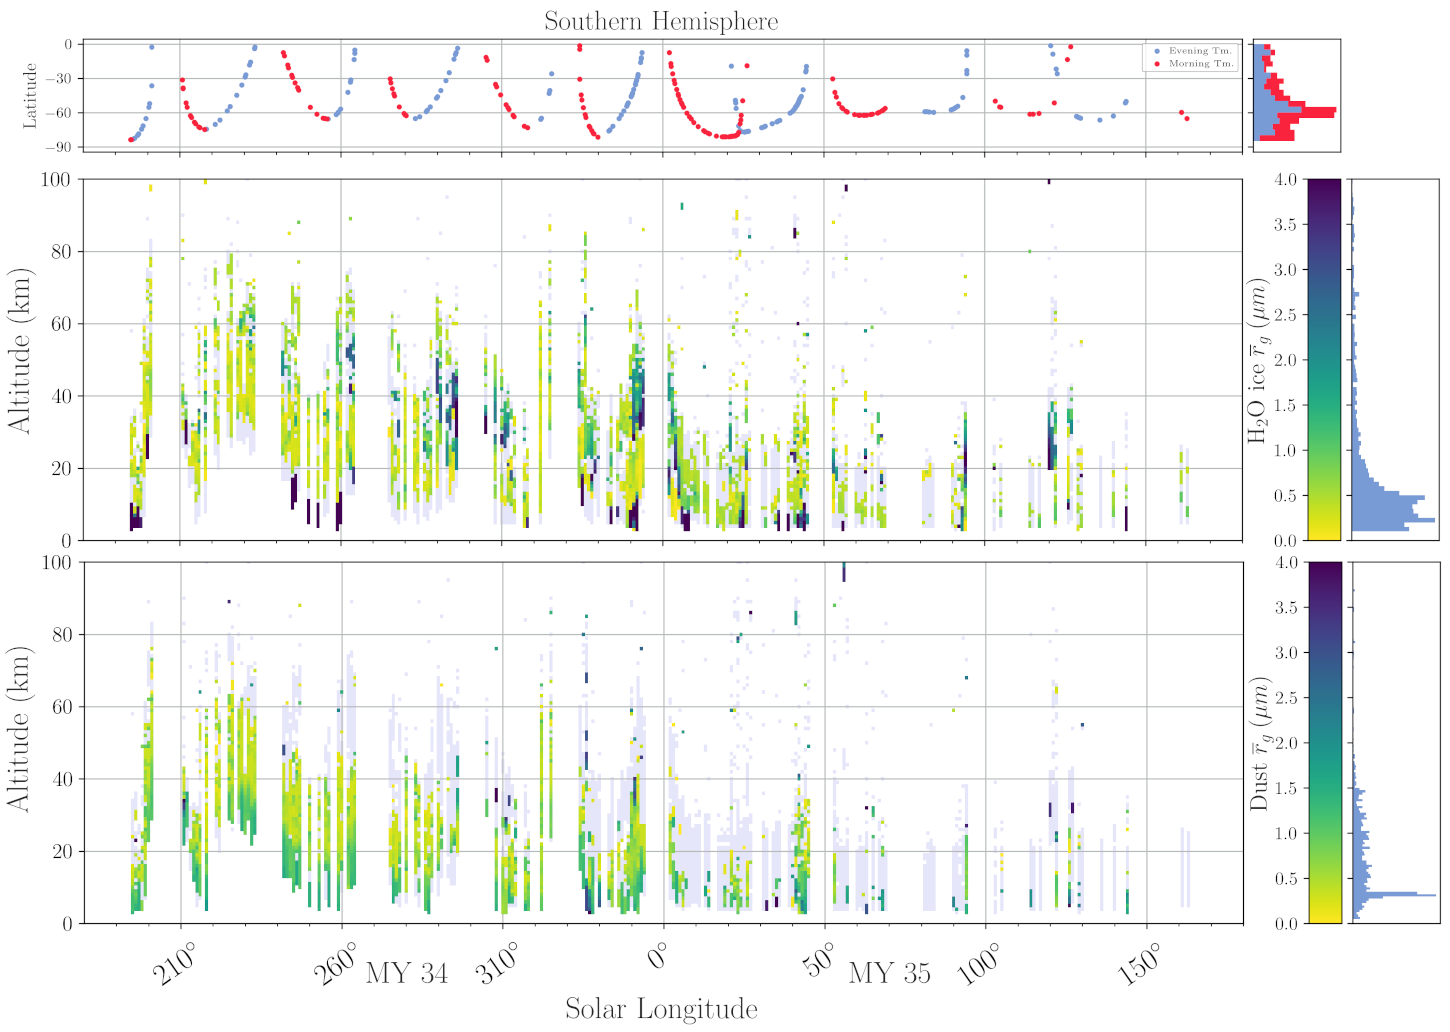
Fig 2.
Acknowledgments
The IAA/CSIC team acknowledges financial support from the State Agency for Research of the Spanish MCIU through the \emph{"Center of Excellence Severo Ochoa"} award for the Instituto de Astrofísica de Andalucía (SEV-2017-0709) and funding by grant PGC2018-101836-B-100 (MCIU/AEI/FEDER, EU). ExoMars is a space mission of the European Space Agency (ESA) and Roscosmos. The NOMAD experiment is led by the Royal Belgian Institute for Space Aeronomy (IASB-BIRA), assisted by Co-PI teams from Spain (IAA-CSIC), Italy (INAF-IAPS), and the United Kingdom (Open University).
References
[1] Robert M. Haberle et al., eds. The Atmosphere and Climate of Mars. Cambridge University Press, 2017.
[2] R. Todd Clancy et al. “The distribution, composition, and particle properties of Mars meso-spheric aerosols: An analysis of CRISM visible/near-IR limb spectra with context from near-coincident MCS and MARCI observations”. Icarus 328 (2019).
[3] J. Vago et al. “ESA ExoMars program: The next step in exploring Mars”. SSR 49.7 (2015).
[4] A. C. Vandaele et al. “NOMAD, an Integrated Suite of Three Spectrometers for the ExoMarsTrace Gas Mission: Technical Description, Science Objectives and Expected Performance”. SSR 214.5 (2018).
[5] T. von Clarmann et al. “Retrieval of temperature and tangent altitude pointing from limb emission spectra recorded from space by the Michelson Interferometer for Passive Atmospheric Sounding (MIPAS)”. JGR: Atmospheres 108.D23 (2003).
[6] Sergio Jiménez-Monferrer et al. “CO2 retrievals in the Mars daylight thermosphere from its 4.3μm limb emission measured by OMEGA/MEx”. Icarus 353 (2021).
[7] Clive D Rodgers. Inverse Methods for Atmospheric Sounding. WORLD SCIENTIFIC, 2000.
[8] Jurado Navarro et al. Retrieval of CO2 and collisional parameters from the MIPAS spectra in the Earth atmosphere. Universidad de Granada, 2016.
[9] M. Luginin et al. “Properties of Water Ice and Dust Particles in the Atmosphere of Mars During the 2018 Global Dust Storm as Inferred From the Atmospheric Chemistry Suite”. JGR: Planets 125.11 (2020).
[10] A. Stcherbinine et al. “Martian Water Ice Clouds During the 2018 Global Dust Storm as Observed by the ACS-MIR Channel Onboard the Trace Gas Orbiter”. JGR: Planets 125.3 (2020).
[11] Michael I Mishchenko et al. Scattering, absorption, and emission of light by small particles. Cambridge university press, 2002.
[12] Pauli Virtanen et al. “SciPy 1.0: Fundamental Algorithms for Scientific Computing in Python”. Nature Methods 17 (2020).
How to cite: stolzenbach, A., López Valverde, M.-A., Brines, A., Modak, A., Funke, B., González-Galindo, F., Thomas, I., Liuzzi, G., Villanueva, G., Luginin, M., and Aoki, S.: Composition and size of Martian aerosols as seen in the IR from solar occultation measurements by NOMAD onboard TGO, Europlanet Science Congress 2022, Granada, Spain, 18–23 Sep 2022, EPSC2022-922, https://doi.org/10.5194/epsc2022-922, 2022.
Introduction: Dust is a high albedo material, which is omnipresent on Mars: both on the surface and suspended in the atmosphere. These micrometer-sized particles modify heat balance while being highly mobile: it is a major contributor to current Martian atmosphere and surface dynamic. Information on dust spatial and time distribution was already provided from numerous orbital and surface studies (e.g., [1,2,3]). However, some characteristics of the dust cycle remain uncertain, which is notably related to the large range of spatial scales of the dust movements: from Recurring Slope Lineae (RSL) to global dust storms, and with important interannual variability ([4,5]). Further global monitoring of dust movements with high spatial sampling and over several years may help improving our Martian dust knowledge. Here we present a new method used to derived near-infrared atmospheric dust optical depth using OMEGA observations acquired between 2004 and 2010.
Data and method: We use the near-infrared (NIR) imaging spectrometer OMEGA [6] onboard Mars Express, which acquired about 8300 observations of the Martian surface over that time range, with a spatial sampling typically close to 1 km.
Firstly, we quantify the prominent 2 µm atmospheric CO2 absorption band which is sensitive to airborne dust that reduces the atmospheric optical paths of the photons. We have developed a model to predict the CO2 optical depth under clear atmosphere conditions (notably depends on solar incidence angle, albedo and pressure). This allows to compare observed CO2 optical depth to these predictions and to derive the difference "ΔτCO2" (more details in [7]).
Then, we transform this ΔτCO2 into dust optical depth by a calibration with the visible (VIS) dust optical depth (from 880 nm images) measured by the Mars Exploration Rovers (MER) [2]. Concomitant MER/OMEGA observations are used to characterize the relation between ΔτCO2 and the ground optical depth (notably depends on incidence angle and albedo). Then, we extrapolated this relation to the whole OMEGA dataset to compute a VIS-NIR dust optical depth "τdust".
Results and discussion: We produce latitude/solar longitude diagrams, such as in Figure 1 for the Martian year 28. We observed well-known dust cycle characteristics: low dust optical depth values (<0.5) in the "clear atmosphere period" (solar longitude Ls=0-180°) and medium to high values (>1) during the dusty season (Ls>180°) such as the 2007 global dust storm during Ls=260-310°. We also observed medium-high values at northern and southern latitudes during Ls=220-250° that can correspond to dust storms identified in Hellas and Chryse [8]. Other main investigations were made with thermal-infrared (TIR) data [3,9]. We can notice an overall good agreement between our VIS-NIR study and TIR studies. But there are still differences that we studied by computing the dust optical depth ratio between our VIS-NIR values derived at 2 µm (and converted to 880 nm using MER) and the thermal ones at 9 µm. This ratio distribution reaches a maximum at 2.4, which is in agreement with the value (2.6) considered in [3] and also with the values found locally with MER [2]. This distribution is very large: 2.0 equivalent standard deviation, which may be related to the mean dust particle size variations according to [2] and to potential observational biases of each method (e.g., uncertainties in the vertical distribution of dust).
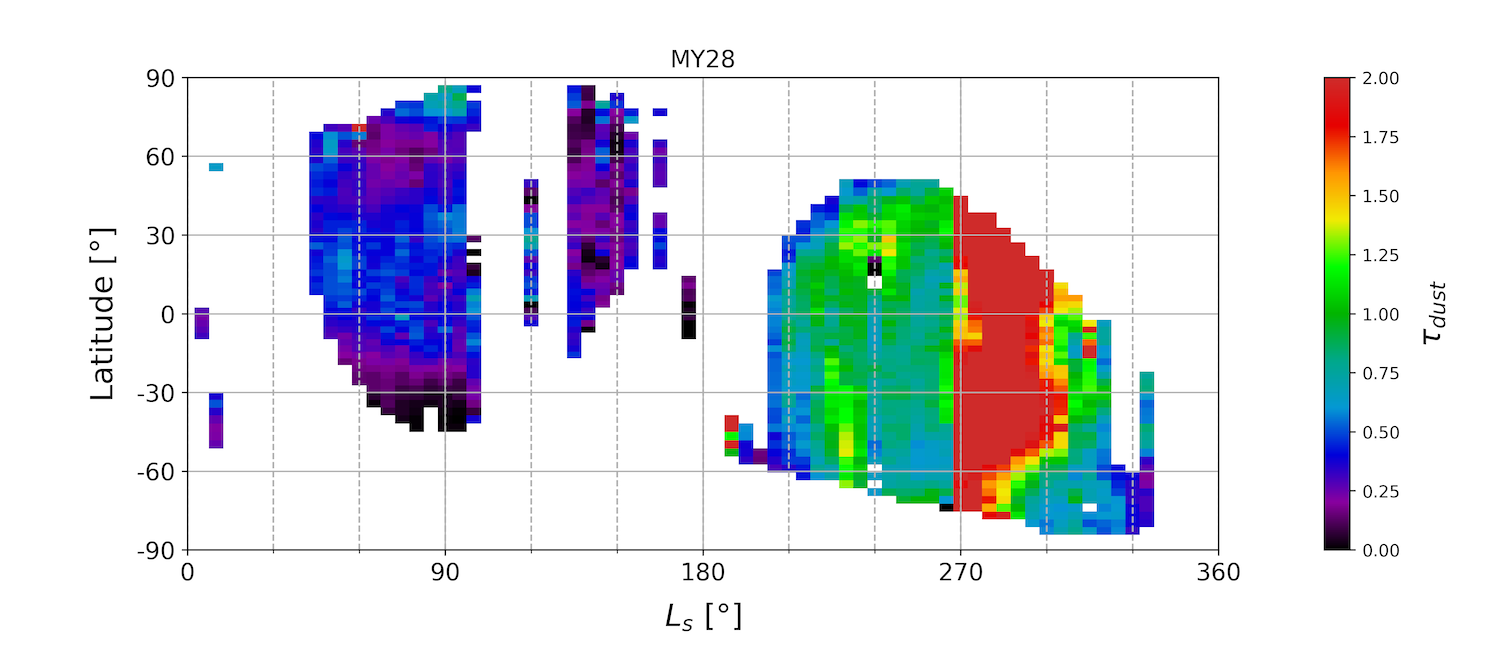
Figure 1: VIS-NIR dust optical depth (derived from the OMEGA dataset: see text for details) as a function of solar longitude (Ls) and latitude for Martian year 28.
We also produce global seasonal maps of dust optical depth with a spatial coverage typically greater than 50% for most 60° wide intervals in solar longitude. We provide two seasonal maps of Martian year 29 in Figure 2 (Ls=180-240° and 300-360°). Firstly, we can notice some localized high values, such as in 355°E and 55°S on the Ls=180-240° map, that can be associated to a dust storm. Some main dust storm travel routes [8,10] can be identified, such as the Acidalia-Chryse route which is associated to medium-high dust optical depth values in these two maps. Activity is also observed at RSL sites in this area during both periods [11] represented in Figure 2: rapid disappearance events over Ls=180-240° suggesting dust deposition/horizontal dust transport [12], and RSL formation/lengthening over Ls=300-360° which suggest dust removal. This indicates that local surface movements may be related to large-scale atmospheric dust movements occurring at RSL location.
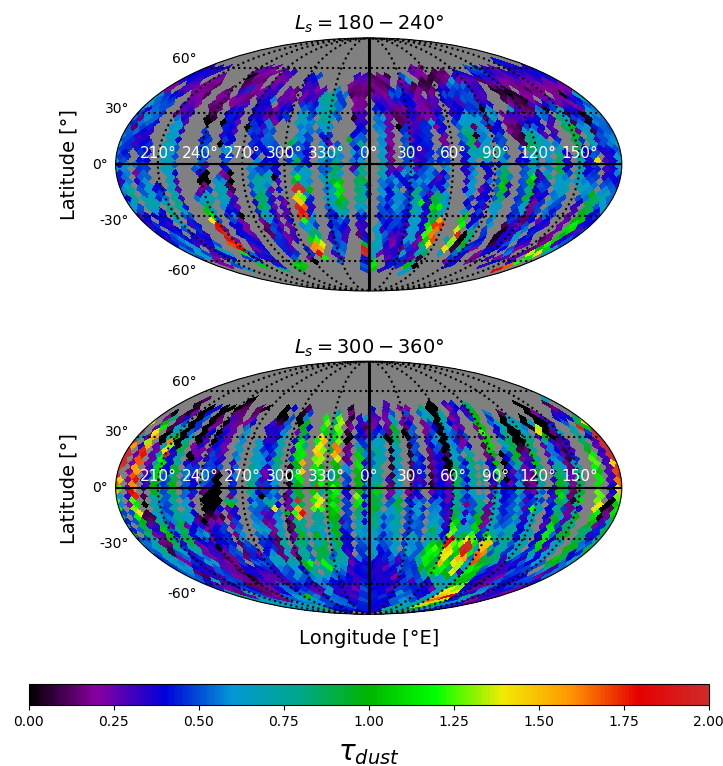
Figure 2: Two seasonal atmospheric VIS-NIR dust optical depth maps of Mars during Martian year 29. Top: Ls=180-240°; bottom: Ls=300-360°.
Conclusion: We have developed a new method to derived a VIS-NIR dust optical depth using near-infrared data (OMEGA). The method relies on CO2 absorption band at 2 µm and on a calibration procedure that we implemented, based on MER “ground truth” measurements. We constructed latitude/solar longitude diagrams (Figure 1) and global seasonal maps (Figure 2). Overall, our results are in a good agreement with previous thermal-infrared studies, but with some differences noticed by a particular distribution of the dust optical depth ratio between VIS-NIR and thermal-infrared, with a maximum occurrence value of 2.4. Then, preliminary results indicate that large scale atmospheric dust events may be related to local RSL activity occurring in the Chryse-Acidalia area. We will present further comparisons between atmospheric dust and RSL activities at the conference.
Acknowledgments: The OMEGA/MEx data are freely available on the ESA PSA at https://archives.esac.esa.int/psa/#!Table%20View/OMEGA=instrument.
References: [1] Smith M. D. (2004) Icarus, 167, 148-165. [2] Lemmon M. T. et al. (2015) Icarus, 251, 96-111. [3] Montabone L. et al. (2015) Icarus, 251, 65-95. [4] Szwast M. A. et al. (2006) JGR, 111, E11008. [5] Vincendon M. et al. (2019) Icarus, 325, 115-127. [6] Bibring J-P. et al. (2004) ESA Publication Division, 1240, 37-49. [7] Leseigneur Y. et al. (2021), 52nd LPSC, LPI contribution No. 2548, id. 1741. [8] Wang H. et al. (2015) Icarus, 251, 112-127. [9] Smith M. D. (2004) Icarus, 167, 148-165. [10] Battalio M. (2021) Icarus, 354, 114059. [11] Stillman D. E. et al. (2016) Icarus, 265, 125-138. [12] Vincendon M. et al. (2019) Icarus, 325, 115-127.
How to cite: Leseigneur, Y. and Vincendon, M.: Atmospheric Dust monitoring derived from Orbital Near-Infrared Imaging Spectroscopy and Implications for RSL Formation, Europlanet Science Congress 2022, Granada, Spain, 18–23 Sep 2022, EPSC2022-1145, https://doi.org/10.5194/epsc2022-1145, 2022.
Abstract
Using a variety of instruments onboard the Perseverance Rover, a substantial amount of data has been collected and analyzed to understand the environment and atmosphere of the landing site, Jezero Crater. A vital component in understanding this unique environment is studying the local and regional variations of water over diurnal and seasonal timescales. We specifically study the variations of water ice in the atmosphere by observing cloud activity over Jezero Crater using data collected by the Navigation Cameras, NavCam, on board the Mars2020 Rover, Perseverance.
Introduction
Water Ice clouds on Mars have been observed for a long time from both the surface and from orbit to understand the role of water in the atmosphere. Using Viking era data, Tamppari (2000, 2003) observed water ice clouds with peak activity seen during the northern spring and summer time. Opportunity Rover acquired images of water ice clouds during the Aphelion Cloud Belt (ACB) season with peak activity seen from Ls 50o to 115o (Lemmon et al., 2015). From the past activity, we have seen that between the solar longitude (Ls) of 45o to 150o, the Aphelion Cloud Belt (ACB) forms every Mars Year (MY) in the equatorial region (10oS–30oN). (Tamppari et al., 2000) (Smith et al., 2004)
Furthermore, the Surface Stereo Imager (SSI) on-board the Phoenix Lander showed a large variety of cloud types over the course of the 151-sol mission (Moores et al., 2010). The navigation camera, NavCam aboard the Mars Science Laboratory (MSL, Curiosity) rover has observed cloud activity at Gale crater through cloud movies and surveys. The diurnal and seasonal patterns were comparable with previous observations. The peak cloud activities were observed in the morning/afternoon time and around the ACB period. (Kloos et al., 2018) They have also been reported to leave a thermal signature at night on Gale’s surface (Cooper et al. 2021).
NAVCAM data
At Jezero Crater, water ice clouds have been observed through cloud movies and cloud surveys collected using the Perseverance NavCam instrument that collects colour stereo images with a 96ox73o field of view at 0.33 mrad/pixel. (Maki et al., 2020) Compared to the NavCam on Curiosity, the NavCam on Perseverance holds the capability of imaging in colour which may provide advantages in highlighting water ice clouds in the atmosphere.
Cloud surveys are single images taken facing the horizon, generally twice a week, at various times of the day. Similarly, cloud movies are collected by taking 8 frames of images looking towards the horizon with an interval of 15 seconds, producing a movie. A combination of cloud surveys and movies collected by the mission are used to study water ice clouds.
Data Processing
Various image processing techniques are used on these data sets to emphasize the presence of water ice clouds in the atmosphere. For example, the NavCam Cloud movies can be processed using an imaging technique known as Mean Frame Subtraction (MFS) to enhance cloud features (Campbell et al., 2020) (Moores et al., 2015). This technique takes the average frame of the whole movie and subtracts it from each frame (Moores et al., 2015). This reveals the time-variable component, displaying the cloud movement within the movie. Figure 1 shows an example of raw (left) versus MFS processed frames (right) of a NavCam cloud movie. In addition to these processed images and movies, we have explored techniques such as two-dimensional fast Fourier transforms to recognize patterns in clouds.
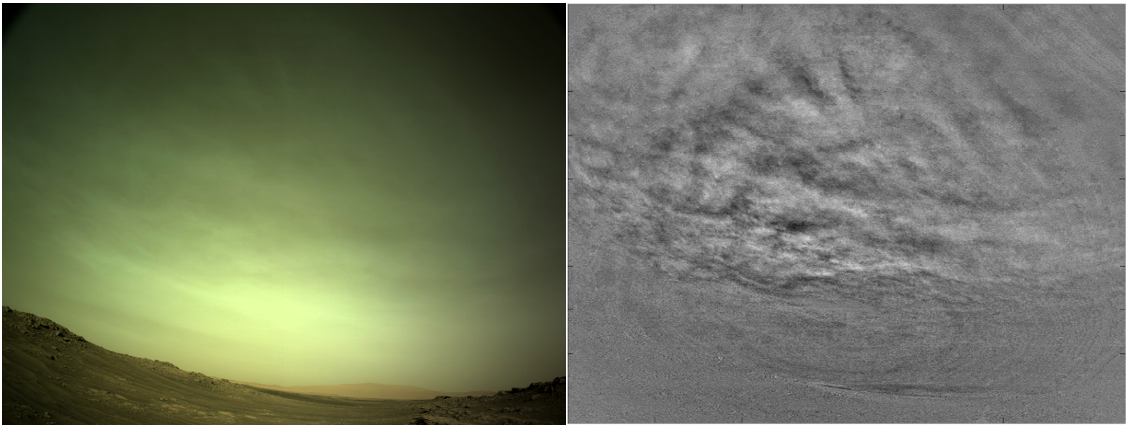
Figure 1: Comparison between raw and Mean Frame Subtraction frames. The raw frame (left) only shows faint clouds but when the Mean Frame Subtraction method is applied (right), the cloud features become visible.
We will be presenting the water-ice cloud activity at Jezero Crater with details on various image processing techniques used to determine the characteristics of Martian clouds. The full data set from the start of the Mars2020 mission up to now will be analyzed to determine any seasonal patterns in the cloud activity seen at Jezero.
Bibliography
Campbell et al., 2020. Planet. Space Sci. 182 104785, http://dx.doi.org/10.1016/j.pss.2019. 104785.
Cooper, B., et al., 221 JGR: Planets, 126(12), doi:10.1029/2020JE006737, 2021
Kloos et al., 2018. Geophys. Res. Planets. (2018)123, 233–245. https://doi.org/10.1002/2017JE005314
Lemmon et al., 2015. Icarus 251, 96–111. https://doi.org/10.1016
Moores et al., 2010. J. Geophys. Res. Planets. https://doi.org/10.1029/
Maki et al., 2020. Space Science Reviews https://doi.org/10.1007/s11214-020-00765-9
Moores et al., 2015. Adv. Space Res. 55 2217–2238, http://dx.doi.org/10.1016/j.asr.2015.02.007.
Smith, M. D. 2004, Icarus, 167, 148–165. https://doi.org/10.1016/j.icarus.2003.09.010
Tamppari et al., 2000, J. Geophys. Res., 105, E2, 4087–4107. https://doi.org/10.1029/1999JE001133
Tamppari et al., 2003, J. Geophys. Res., 108, https://doi.org/10.1029/2002JE001911
How to cite: Patel, P., Coates, A., Tamppari, L., de la Torre Juárez, M., Lemmon, M., Toledo, D., Wolff, M., Moores, J., Campbell, C., and Brown, A.: Underlining the Image Processing Techniques Used to Analyze Martian Water Ice Clouds Observed at Jezero Crater by the NavCam Instrument on board the Mars2020 Rover, Perseverance., Europlanet Science Congress 2022, Granada, Spain, 18–23 Sep 2022, EPSC2022-679, https://doi.org/10.5194/epsc2022-679, 2022.
Thermal infrared observations made from the surface of Mars by the Perseverance rover and from orbit by the Emirates Mars mission enable the retrieval of dust aerosol optical depth at all local times, both day and night. Observations from the rover are useful for characterizing the localized, short timescale changes in dust optical depth, particularly during dust storms, while observations from the orbiter and useful for identifying global trends and temporal variations on longer timescales, from diurnal to seasonal. Together, these two vantage points provide complementary information that helps to understand the variations of dust over different temporal and spatial scales.
1. Introduction
1.1 Perseverance TIRS data:
The Thermal InfraRed Sensor (TIRS) package on the Perseverance rover consists of five sensors used to characterize the upward and downward fluxes of visible and infrared radiation at the rover site (Rodriguez-Manfredi et al., 2021). Of interest here are the sensors TIRS IR1, which covers a broad portion of the thermal-infrared spectrum over the range 6–35 µm and TIRS IR2, which covers the CO2 band between 14.5 and 15.5 µm. Both sensors view upward at an elevation angle centered at 35° above the rover deck. As part of the MEDA suite of atmospheric sensors, TIRS observations are taken systematically throughout the sol at a frequency of 1 Hz. Observations in one-hour blocks are generally taken so that odd-numbered hours are covered on odd-numbered sols, while even-numbered hours are covered on even-numbered sols. In that way the entire 24-hour diurnal cycle is fully covered over a span of 2 sols. These observations are a part of the background baseline set for MEDA that runs essentially every day providing excellent diurnal and seasonal coverage.
We use a radiative transfer model to compute the expected TIRS IR1 and IR2 signal for a given aerosol optical depth and temperature profile. We can then perform the retrieval by varying the atmospheric temperatures and aerosol optical depth to match the values observed by TIRS. The radiative transfer model includes aerosol scattering using a 2-stream approximation (e.g., Smith et al., 2006) and treats absorption by CO2 gas using the correlated-k approximation (Lacis & Oinas, 1991).
1.2 Emirates Mars Mission EMIRS data:
EMIRS is a thermal infrared spectrometer that observes Mars at wavelengths between ~100 and 1600 cm-1 (~100 and 6 µm) at a spectral resolution of 5 or 10 cm-1 (Edwards et al., 2021). From its 55-hour period orbit that varies between 20,000 and 43,000 km altitude, EMIRS raster scans the disk of Mars ~20 times during each orbit to provide a global, synoptic view of Mars that samples all local times, both day and night (Amiri et al., 2021). Over the course of approximately 4 orbits (or 10 days), sufficient observations are taken to provide a broad sampling of all local times at nearly all latitudes and longitudes. The typical footprint size is ~100–300 km, which is consistent with modern global circulation models and is sufficient to provide a detailed global view of the current climate state.
We follow the constrained linear inversion algorithm of Conrath et al. (2000) and Smith et al. (2006) to retrieve atmospheric state parameters that best match the observed spectra of Mars from EMIRS. The radiative transfer model includes a discrete ordinates treatment of multiple scattering (e.g., Goody & Yung, 1989; Thomas & Stamnes, 1999) to accurately model dust and water ice cloud aerosols, and it accounts for the absorptions from CO2 and water vapor gases using the HITRAN database (Gordon et al., 2022) and the correlated-k approximation (Lacis & Oinas, 1991).
Given that the spectral signatures of gases and aerosols are relatively well separated in the spectral range observed by EMIRS, the retrieval is performed sequentially for the atmospheric temperature profile, the column optical depths of dust and water ice aerosol, and the column abundance of water vapor. This sequence can be iterated to obtain a self-consistent solution.
2. Results
Figure 1 shows an example of Perseverance/TIRS retrieval of the complex time history of dust optical depth during a regional dust storm that occurred during January 2022. Here, the sol numbers label midnight LTST. During the active period of this dust event between sols 313 and 317 (5–9 January 2022, Ls=153°–156°) there were numerous spikes in aerosol optical depth with several exceeding unity (at 9 µm). These spikes in aerosol (dust) optical depth occurred preferentially during the day but appear equally in both the morning and the afternoon. Retrievals of dust optical depth outside the dust storm period showed a combination of variations on many timescales from very short (minutes), to diurnal, to the overall seasonal trend.
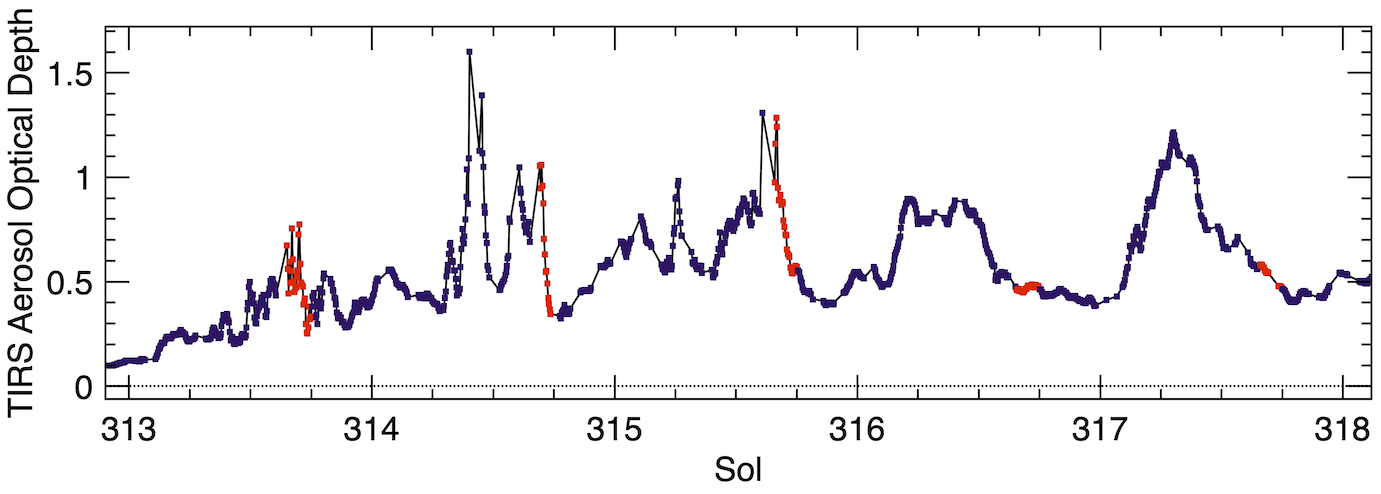
Figure 1. The detailed time history of dust optical depth retrieved from Perseverance TIRS observations during the January 2022 regional dust storm. Local variations on short timescales are apparent.
The January 2022 regional dust storm was also observed by the Emirates Mars Mission/EMIRS instrument. Figure 2 shows a global-scale view of the initiation, growth, and decay of the storm as observed from orbit. Over the course of several days localized dust activity intensified and spread equatorward becoming a regional storm. New dust lifting quickly diminished and the dust was carried by the general circulation to all longitudes before slowly settling out of the atmosphere. These dust retrievals provide global context to those from the rover.
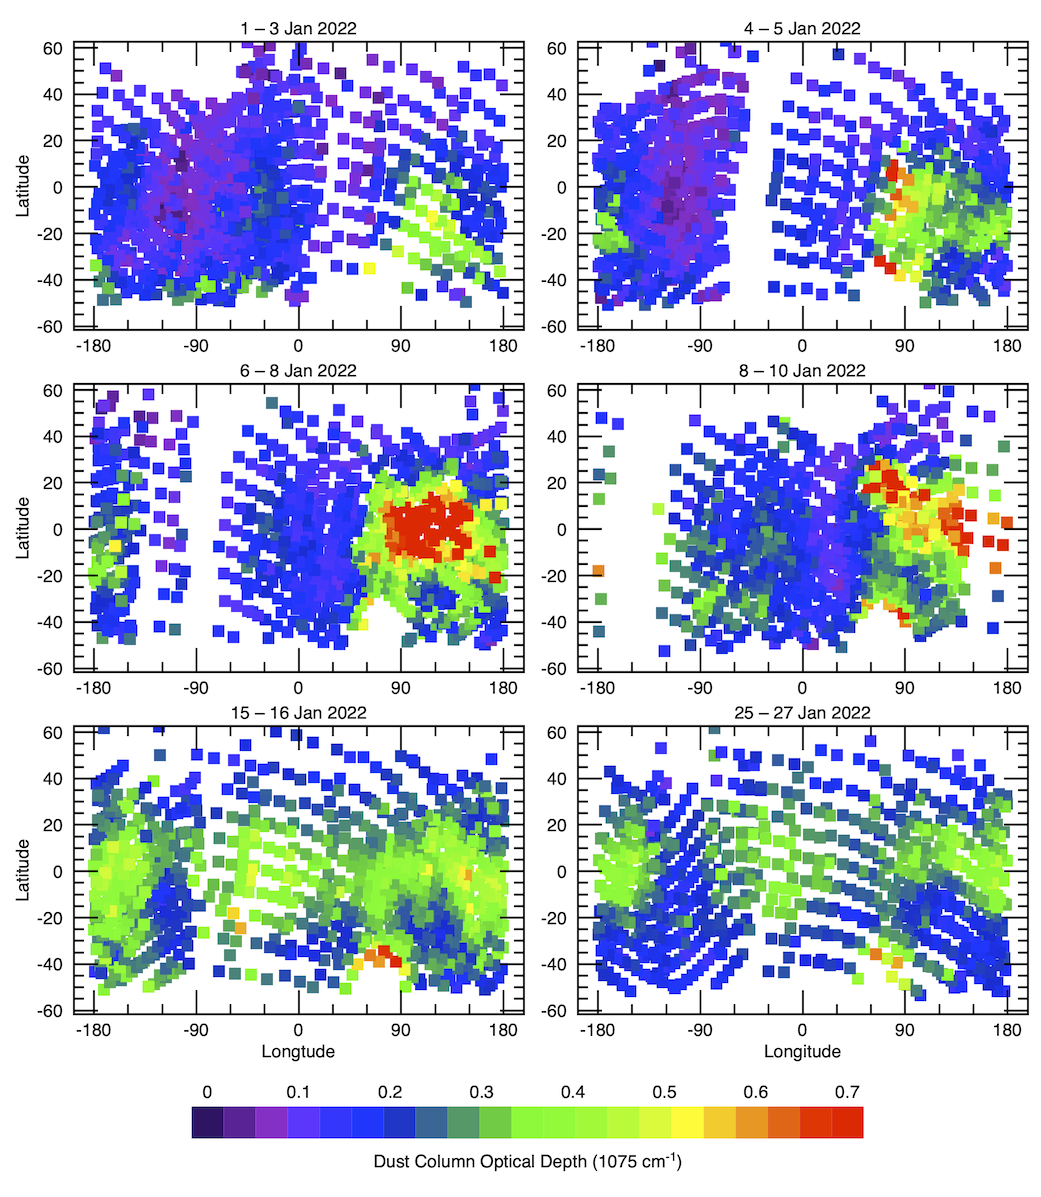
Figure 2. The time history of the global aerosol dust optical depth retrieved from EMIRS observations during the January 2022 regional dust storm. A global view of the evolution of dust is possible from orbit.
References
Amiri, H.E. S. et al., 2021. Space Sci. Reviews, 218:4, doi:10.1007/s11214-021-00868-x.
Conrath, B.J. et al, 2000. J. Geophys. Res., 105, E4, 9509–9519.
Edwards, C.S. et al., 2021. Space Sci. Reviews, 217:77, doi:10.1007/s11214-021-00848-1.
Goody, R.M. & Yung, Y.L., 1989. Atmospheric Radiation: Theoretical Basis. Oxford Univ. Press.
Gordon, I.E., et al., 2022. JQSRT, 277, doi:10.1016/j.jqsrt.2021.107949.
Lacis, A.A. & Oinas, V., 1991. J. Geophys. Res., 96, 9027–9063.
Rodriguez-Manfredi, J.A. et al., 2021. Space Sci. Reviews, 217:48, doi:10.1007/s11214-021-00816-9.
Smith, M.D., et al., 2006. J. Geophys. Res., 111, E12S13, doi:10.1029/2006JE002770.
Thomas, G.E. & Stamnes, K., 1999. Radiative Transfer in the Atmosphere and Ocean, Cambridge Univ. Press.
How to cite: Smith, M., Badri, K., Atwood, S., Martínez, G., Sebastián, E., Apéstigue, V., Arruego, I., Toledo, D., Viúdez, D., Manfredi, J. A., Edwards, C., Smith, N., Wolfe, C., Wolff, M., Christensen, P., Anwar, S., Lemmon, M., AlTunaiji, E., and de la Torre, M.: The diurnal and seasonal variation of dust observed by the Perseverance rover and Emirates Mars Mission, Europlanet Science Congress 2022, Granada, Spain, 18–23 Sep 2022, EPSC2022-599, https://doi.org/10.5194/epsc2022-599, 2022.
Orals: Wed, 21 Sep, 10:00–11:30 | Room Manuel de Falla
Aeolian sediment transport has been seen to occur on Mars as well as other extraterrestrial environments, generating ripples and dunes as on Earth. The search for terrestrial analogues of planetary bedforms, as well as environmental simulation experiments able to reproduce their formation in planetary conditions, are powerful ways to question our understanding of geomorphological processes towards unusual parameter sets. Here, using sediment transport laboratory experiments performed in a closed-circuit wind tunnel placed in a vacuum chamber, which is operated at extremely low pressures, we show that Martian conditions belong to a previously unexplored saltation regime. The saltation transport wind speed is quantitatively predicted by the state-of-the art models up to a density ratio between grain and air of 4x10⁵, but unexpectedly falls, above this cross-over point, to much lower values than expected. By contrast, impact ripples, whose emergence is continuously observed on the granular bed over the whole pressure range investigated, display characteristic wavelength and propagation velocity essentially independent of the pressure. Testing these findings against existing models suggests that sediment transport at low Reynolds number but high grain to fluid density ratio may be dominated by collective effects associated with grain inertia in the granular collisional layer.
Ref: B. Andreotti, P. Claudin, J.J. Iversen, J.P. Merrison and K.R. Rasmussen, Proc. Natl. Acad. Sci. USA 118, e2012386118 (2021).
How to cite: Claudin, P., Andreotti, B., Iversen, J. J., Merrison, J. P., and Rasmussen, K. R.: A lower-than-expected saltation threshold at Martian pressure and below, Europlanet Science Congress 2022, Granada, Spain, 18–23 Sep 2022, EPSC2022-137, https://doi.org/10.5194/epsc2022-137, 2022.
In eolian events, where large amounts of dust are carried through an atmosphere, strong electric fields can be generated above ground. Electric charge is transmitted via tribocharging during inter-particle collisions which can have a great impact on further particle transport and sedimentation. If different grain sizes, for example, charge differently, this might lead to size dependent particle and charge separation [1]. It could also promote particle lifting [2,3]. This shows, that understanding the charging behavior of particles and aggregates in strong electric fields is important in the context of particle transport in atmospheres. Especially on Mars, any kind of support for particle lifting might be crucial.
We investigate the charging behavior of mm-sized basaltic dust aggregates with the help of microgravity experiments at Bremen drop tower. Our setup consists of a 50 x 50 x 110 mm chamber which we operate in an air environment. The sides of the chamber are copper plates which function as electrodes. At the bottom of the chamber, the sample is placed inside a cylindric aluminum container, which is also coated with basalt dust. The dust grains making up the agglomerates are in the µm size range. The aggregates themselves range from 0.4 – 2.2 mm in diameter.
Before the microgravity phase, we shake the aggregates for 15 minutes in order to electrically charge them. As soon as the sample is ejected into an 8 kV DC field, the aggregates are accelerated towards one of the electrodes. Through this acceleration, we can estimate the charge of the individual agglomerates. This way, we observe initial charges up to 105 e, both negative and positive without an obvious bias in polarity. Once the aggregates reach an electrode, they either instantly stick to it or bounce off, but eventually cling to the copper plate. Most agglomerates larger than 0.4 mm do, however, recharge while sticking on the electrode until the repelling Coulomb force outweighs the adhesive sticking force. The sticking time is on the order of 0.05 – 0.5 s. The agglomerates charge up to 107 e until they are accelerated to the opposite electrode and recharge again. This charge gained on the electrodes is up to two orders of magnitudes higher than the initial charge. When agglomerates bounce on an electrode, no significant charge is transmitted. The experiments are in agreement with a model where conductive grains on a conductor in an electric field charge, increasing the repulsive force until the different contacts can no longer oppose lifting with their adhesive forces [4].
Our results show that the basaltic dust aggregates are moderately electrically conductive. This presumably is caused by water clinging to the surface and the inside of the agglomerates, making the impact of an electric field on particle transport dependent on the humidity of the ambient atmosphere. In any case, these measurements allow us to quantify the charges and the lifting forces within a given field. If electric fields were present on Mars, electrostatic repulsion might support reducing the threshold friction velocity for saltation.
References:
[1] K.M. Forward, D.J. Lacks, R.M. Sankaran, 2009, Geophys. Res. Lett.,36, p. L13201
[2] Renno N. O., Kok J. F., 2008, Space Sci. Rev., 137, 419
[3] von Holstein-Rathlou C., Merrison J. P., Brædstrup C. F., Nørnberg P., 2012, Icarus, 220, 1
[4] F. C. Onyeagusi, F. Jungmann, J. Teiser, G. Wurm, (in prep).
How to cite: Onyeagusi, F. C., Jungmann, F., Teiser, J., and Wurm, G.: Lifting Dust Aggregates in Electric Fields, Europlanet Science Congress 2022, Granada, Spain, 18–23 Sep 2022, EPSC2022-209, https://doi.org/10.5194/epsc2022-209, 2022.
Dust in the Martian atmosphere is (under regular conditions) not larger than a few micrometers in diameter.
Liberation through impacts of sand grains during saltation is thought to be one source of this fine dust within
the atmosphere, as windspeeds usually do not exceed the threshold windspeed needed to pick up the highly
adhesive smallest particles directly.
We conducted a laboratory experiment to take a closer look at these saltating impacts and the resulting PSD of
the Ejecta on a microscopic scale: A small number of particles of about 200μm in diameter impacted a
simulated Martian soil (bimodal Mars Global Simulant). Impacts occurred at flat angles in fine vacuum
(10-2 mbar) with an impact speed of ∼ 1 m/s. The ejected dust was captured on adjacent
microscope slides and its size distribution was analyzed.
We find that the probability for ejection decreases dramatically with decreasing size. However, in spite of
strong adhesive forces, individual impacts still emit dust of 1μm and less. In fact, the probability
of ejecting dust of a given size can be characterized by a power law in the decade between 0.5μm
and 5μm (diameter).
How to cite: Becker, T., Wurm, G., and Teiser, J.: A laboratory study on sand grain impacts and their role in releasing fine dust into the Martian atmosphere, Europlanet Science Congress 2022, Granada, Spain, 18–23 Sep 2022, EPSC2022-13, https://doi.org/10.5194/epsc2022-13, 2022.
The dust cycle dominates Mars's meteorology. Studying the dust injection into the atmosphere is crucial to understanding and modeling the planet's climate. The Mars Environmental Dynamics Analyzer (MEDA) [1], on board the Perseverance rover, is a meteorological station than has been operating on Mars's surface for more than 400 sols [2]. One of the main goals of MEDA is to study the Mars dust cycle, and for this purpose, it includes the Radiation and Dust Sensor (RDS) [3], among other instruments. This instrument contains two different sensing technologies for dust characterization: a CCD camera looking at the sky and a radiometer based on silicon detectors arranged in different orientations. As a result of the RDS field of view, the number of sensors, and low power consumption and data volume, this sensor is capable of detecting and characterizing dust lifting events such as dust devils for extended periods (of hours) and at a high sampling frequency (1 Hz). Moreover, for the cases with multiple RDS detections and wind sensor observations, the trajectory and dust devil geometry can be derived.
In this work, we have estimated for the first 365 sols: i) the number of dust devils formed at Jezero (expressed in number per area and unit of time); ii) the dust devil impact on the irradiance levels on the surface at different wavelength ranges (e.g. UV or 190-1200 nm ranges); iii) the dust devil spatial distribution along the rover traverse; and iv) the dust devil geometry (diameter and altitude) and trajectory for some of the events. For these analyses, we made used of radiative transfer and Monte-Carlo trajectory simulations. We will also discuss the implications of these results on the Mars dust cycle.
[1] Rodriguez-Manfredi, J. A., et al. (2021). The Mars Environmental Dynamics Analyzer, MEDA. A suite of environmental sensors for the Mars 2020 mission. Space science reviews, 217(3), 1-86.
[2] Newman, C.E. et al. The dynamic atmospheric and aeolian environment of Jezero crater, Mars, Science Advances (in press).
[3] Apestigue, V. et al. Radiation and Dust Sensor for Mars Environmental Dynamic Analyzer Onboard M2020 Rover. Sensors, 22, 2907 (2022). doi:10.3390/s22082907
How to cite: Apestique, V., Toledo, D., and Arruego, I. and the MEDA and ATM team: Dust Devil frequency of occurrence at Jezero crater and radiative effects as derived by MEDA-RDS, Europlanet Science Congress 2022, Granada, Spain, 18–23 Sep 2022, EPSC2022-573, https://doi.org/10.5194/epsc2022-573, 2022.
The Mars 2020 Perseverance rover is developing its mission in Jezero crater [1], a north tropical location that is rich in vortices and dust devils [2]. The MEDA instrument [3] collects atmospheric data at a typical frequency of 1 Hz with several sensors including pressure and winds. It also registers data about atmospheric dust with its set of photodiodes [4]. Together, these data are providing a large set of detections of vortices and dust devils [2, 5] that can be used to investigate the physical properties of the vortices and their effects on the environment though the combination of additional data obtained by MEDA. Here we present a physical characterization of dust devils detected with the pressure data and confirmed as dust devils from the set of photodiodes on MEDA. We show that the combination of pressure, winds and a simple model of drifting vortices [6] can fit the observations of many of these events determining their true central pressure drop, diameter and maximum circulation winds. The quality of the comparisons depend on the varying quality of the wind measurements and is better in short encounters with small vortices than in long encounters with large dust devils. We examine how the vortices characteristics, i.e. their true diameter, minimum distance of the encounter, central pressure drop and maximum wind intensity compare with the detection of dust and its basic inferred abundance and explore the consequences for the efficiency of vortices of different sizes and intensities to raise dust from the Martian surface. We also compare these vortex parameters with environment thermal properties, such as the thermal gradient from the surface and the air, and the thermal perturbations caused by the vortex in a selection of the best observed cases. A comparison with main properties of vortices observed in the different surveys of dust devil activity carried on by the cameras onboard Perseverance will be also presented.
References:
[1] Farley, K.A. et al. Mars2020 Mission Overview, Space Sci. Rev., 216, 142 (2020). Doi: 10.1007/s11214-020-00762-y
[2] Newman, C.E. et al. The dynamic atmospheric and aeolian environment of Jezero crater, Mars, Science Advances (in press).
[3] Rodriguez-Manfredi, J.A. et al. The Mars Environmental Dynamics Analyzer, MEDA. A Suite of Environmental Sensors for the Mars 2020 Mission, Space Science Reviews, 217, 48 (2021), doi:10.1007/s11214-021-00816-9.
[4] Apestigue, V. et al. Radiation and Dust Sensor for Mars Environmental Dynamic Analyzer Onboard M2020 Rover. Sensors, 22, 2907 (2022). doi:10.3390/s22082907
[5] Jackson, B. Vortices and Dust Devils as Observed by the Mars Environmental Dynamics Analyzer Instruments on Board the Mars 2020 Perseverance Rover, The Planetary Science Journal, 3, 20 (2022). Doi: 103847/PSJ/ac4586
[6] Lorenz, R., Heuristic estimation of dust devil vortex parameters and trajectories from single-station meteorological observations: Application to InSight at Mars. Icarus, 271, 326-337 (2016). doi: 10.1016/j.icarus.2016.02.001
How to cite: Hueso, R., del Río-Gaztelurrutia, T., Munguira, A., Sánchez-Lavega, A., Murdoch, N., Newman, C., Lemmon, M., Apéstigue, V., Toledo, D., Arruego, I., Viudez-Moreiras, D., de Vicente-Retortillo, Á., de la Torre-Juarez, M., Lorenz, R., Martínez, G., Rodríguez-Manfredi, J. A., Tamppari, L., Navarro, S., Gómez-Elvira, J., and Harri, A.-M. and the The Mars 2020 ATM team: Physical characterization of dust devils at Jezero crater from Mars2020/MEDA data, Europlanet Science Congress 2022, Granada, Spain, 18–23 Sep 2022, EPSC2022-230, https://doi.org/10.5194/epsc2022-230, 2022.
We have accumulated almost uninterrupted observations of dust from satellites in orbit around Mars for more than 20 years to date. Such a long-term and multi-instrument record can be used to identify dust events, including large-scale dust storms, occurring in the last 13 Martian Years (MY). Using observations from three American instruments operating in the thermal infrared, namely the Thermal Emission Spectrometer (TES, aboard Mars Global Surveyor), the Thermal Emission Imaging System (THEMIS, aboard Mars Odyssey), and the Mars Climate Sounder (MCS, aboard Mars Reconnaissance Orbiter), we have been able to reconstruct diurnal maps of column dust optical depth (CDOD) from mid-summer in MY 24 to the end of MY 35 [1, 2]. These maps are used as input “dust scenario” in the Mars Climate Database (MCD, [3]), among other practical applications. They are publicly available in NetCDF format on a dedicated webpage of the MCD website [4].
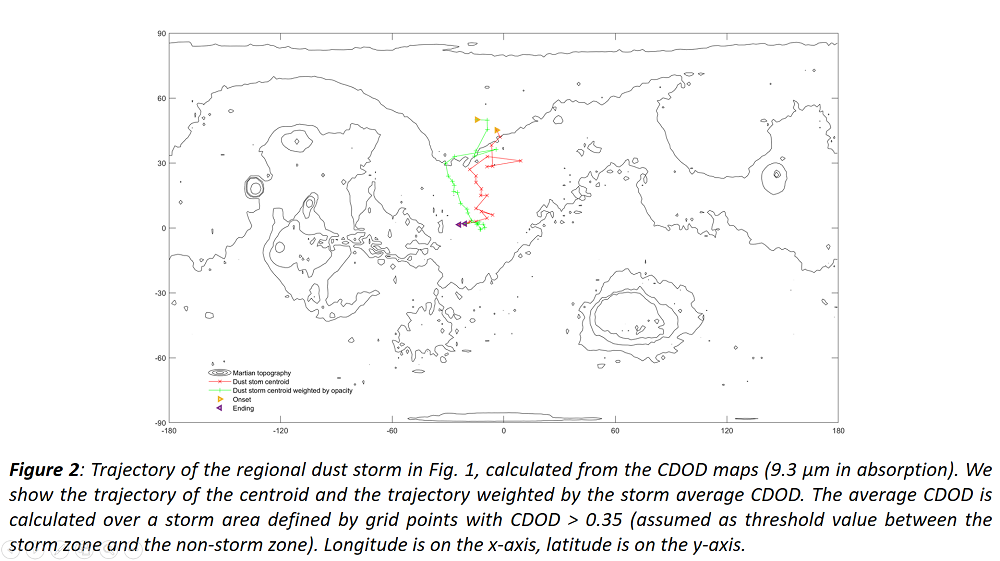
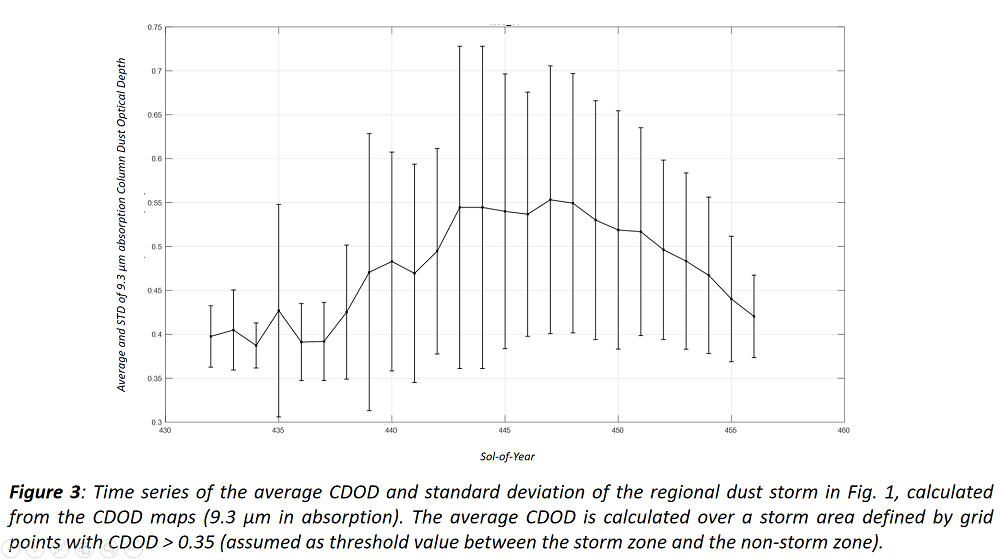
The quality of these diurnal CDOD maps also allows the identification of large-scale dust storms (so-called “regional” and “global” storms) and the reconstruction of their main characteristics in space and time, such as the trajectory, area, and average optical depth (see Figures 1 to 3). This work is aimed at 1) building a long-term record of key dust storm characteristics based on satellite observations in the thermal infrared, 2) comparing this record to data derived from satellite observations at visible wavelengths, and 3) producing reliable statistics for Mars science and exploration, leading to statistical large-scale dust storm prediction.
Despite the successful application of our methodology to reconstruct diurnal CDOD maps and identify large-scale dust storms, we are strongly limited by the low-altitude, quasi-polar, Sun-synchronous orbits of the Martian satellites used so far, which produce asynchronous and discontinuous observations at fixed local times. The use of observations from the European Planetary Fourier Spectrometer (PFS, aboard Mars Express) and the Russian thermal infrared channel of the Atmospheric Chemical Suite (ACS/TIRVIM aboard Trace Gas Orbiter) could help to span different local times with respect to those observed by TES, THEMIS and MCS. Nonetheless, observations from Mars Express (MEx) and Trace Gas Orbiter (TGO) are still discontinuous and asynchronous, with a sparser spatial coverage (PFS) or shorter time coverage (ACS/TIRVIM) than MCS.
A recent novelty is represented by the Emirates Mars Mission “Hope” satellite, which has been put in a high-altitude, low-inclination orbit at the beginning of 2021. Observations from the instruments aboard this spacecraft (we are particularly interested in the Emirates Mars Infrared Spectrometer -EMIRS) cover larger areas on the planet and multiple local times simultaneously, thus having the potential to improve the quality of our reconstructed CDOD maps and dust storm characteristics. However, the dynamics of Martian dust storms is characterized by rapid temporal variability (sub-hourly), and multi-scale spatial extension (local, regional, planetary), while observations by any single spacecraft are more or less discontinuous and asynchronous, hence limiting the possibility to reconstruct the correct evolution of the storms in space and time.
In order to overcome this limitation, a constellation of orbiting spacecraft including at least three areostationary or areosynchronous satellites (having Mars-synchronous, circular, equatorial or slightly inclined orbits), possibly in addition to at least one low-altitude polar orbiter, has been previously proposed [5, 6, and references therein]. Such a constellation could provide continuous and simultaneous observations of almost the entire planet, thus allowing monitoring of the complete evolution of dust storms (at least large-scale ones, depending on the resolution of the on-board instruments), and of the Martian weather in general.
While waiting for the first available opportunity to launch a weather-monitoring satellite constellation to Mars, we can provide a quantitative assessment of the improvement in weather characterization (dust storms in particular) due to the introduction of specific new observations, using “Observing System Simulation Experiments” (OSSEs). This framework has been used for more than 30 years as a tool to evaluate the benefits of future instruments for the Earth, so it is timing to use it also to simulate the impact of atmospheric observations that do not yet exist for Mars [7].
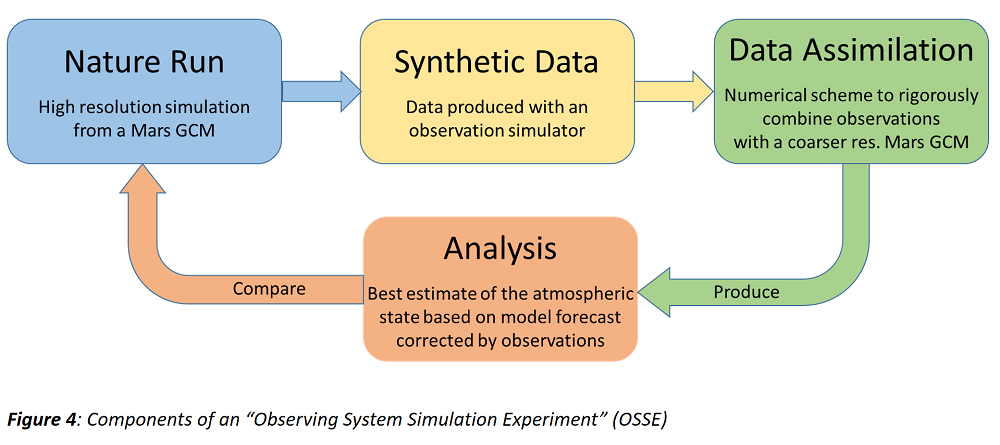
An OSSE framework has three components, as shown in Fig. 4. The nature run is a simulation by a state-of-the-art Global Climate Model (GCM) at high resolution, which is meant to represent the real state of the atmosphere. Synthetic data are produced by simulating the observations to be tested in the OSSE, using an observation simulator that extracts information from the nature run. In other words, the simulator produces the observations that would be taken by a specified instrument when probing the virtual atmosphere provided by the GCM simulation. The data assimilation scheme is a numerical annex to an atmospheric model (usually a GCM) that combines observations with the model in a rigorous, mathematical way. The purpose is to produce an “analysis” of the atmospheric state, i.e. the best estimate of this state using a model forecast corrected by observations, taking into account both model and observation errors. The analysis is then compared to the nature run in order to quantify the impact of new observations in the model characterisation of the temperature and wind fields, including waves, and of the aerosol fields, including the evolution of dust storms.
In this work, we have started using the state-of-the-art Mars “Planetary Climate Model” with the Laboratoire de Météorologie Dynamique longitude-latitude grid dynamical core (Mars PCM-LMDZ, [8]), coupled with the “Local Ensemble Transform Kalman Filter” (LETKF) assimilation scheme [9], in order to optimize the configuration of a weather-monitoring constellation based on different combinations of polar orbiters and areostationary satellites with on-board thermal infrared radiometers.
REFERENCES
[1] Montabone et al. (2015) Icarus 251, pp. 65-95, doi: 10.1016/j.icarus.2014.12.034
[2] Montabone et al (2020) J. Geophys. Res. - Planets, doi: 10.1029/2019JE006111
[3] Millour et al. (2022) 7th MAMO Workshop, Paris, http://www-mars.lmd.jussieu.fr/paris2022/abstracts/oral_Millour_Ehouarn.pdf
[4] http://www-mars.lmd.jussieu.fr/mars/dust_climatology/
[5] Montabone et al. (2021) EPSC 2021, 625, https://doi.org/10.5194/epsc2021-625
[6] Montabone et al. (2022) 7th MAMO Workshop, Paris, http://www-mars.lmd.jussieu.fr/paris2022/abstracts/oral_Montabone_Luca.pdf
[7] Reale, O. et al. (2021) BAAS, 53(4), https://doi.org/10.3847/25c2cfeb.0483bad0
[8] Forget et al. (2022) 7th MAMO Workshop, Paris, http://www-mars.lmd.jussieu.fr/paris2022/abstracts/oral_Forget_Francois.pdf
[9] Young et al. (2022) ESSOAr preprint, doi: 10.1002/essoar.10511381.1
How to cite: Montabone, L., Capderou, M., Forget, F., Guerlet, S., Lombard, T., Millour, E., and Young, R.: From Reconstructing to Monitoring Martian Dust Storms, Europlanet Science Congress 2022, Granada, Spain, 18–23 Sep 2022, EPSC2022-365, https://doi.org/10.5194/epsc2022-365, 2022.
Clouds on Mars are primary elements for understanding the past and present climate of the planet. Cloud particles can affect the energy balance of the planet, and so the atmospheric dynamic, as well as influence the vertical distribution of dust particles through dust scavenging. The dust scavenging by clouds has critical consequences in the water cycle of the planet; e.g. regions in the atmosphere with insufficient quantity of dust particles (or condensation nuclei) can inhibit the formation of H2O clouds and thus lead to the presence of water vapor in excess of saturation [1]. The study of these interactions requires observations whose analysis allows us to infer simultaneously the properties of both the clouds and dust. To address these observations, the Radiation and Dust Sensor (RDS) [2] is part of the Mars Environmental Dynamics Analyzer (MEDA) [3] payload onboard of the Mars 2020 rover Perseverance. RDS instrument compromises two sets of 8 photodiodes (RDS-DP) and a camera (RDS-SkyCam). One set of photodiodes is pointed upward (TOP sensors), with each one covering a different wavelength range between 190-1200 nm. The other set is pointed sideways (LAT sensors), 20 degrees above the horizon, and they are spaced 45 degrees apart in azimuth to sample all directions at a single wavelength.
In this work we will present the radiative transfer analysis of the RDS TOP sensors observations at twilight for the first 365 sols. The twilight period was selected to: i) better constrain the vertical distribution of dust particles for the cloud-free days; ii) detect aerosol layers with very low opacities (lower than 0.1); iii) estimate the cloud altitude [4]. We will discuss the implication of our observations and analyses for Mars aerosol structure and timescales. For example, we find a period of a few days with a notable increase in the presence of clouds during twilight, and for which we derived cloud altitudes higher than 40 km and settling timescales of a few hours (involving a rapid vertical transport of dust particles).
References:
[1] Maltagliati, Luca, et al. "Evidence of water vapor in excess of saturation in the atmosphere of Mars." science 333.6051 (2011): 1868-1871.
[2] Apestigue, Victor, et al. "Radiation and Dust Sensor for Mars Environmental Dynamic Analyzer Onboard M2020 Rover." Sensors 22.8 (2022): 2907.
[3] Rodriguez-Manfredi, José Antonio, et al. "The Mars Environmental Dynamics Analyzer, MEDA. A suite of environmental sensors for the Mars 2020 mission." Space science reviews 217.3 (2021): 1-86.
[4] Toledo, D., et al. "Measurement of aerosol optical depth and sub-visual cloud detection using the optical depth sensor (ODS)." Atmospheric Measurement Techniques 9.2 (2016): 455-467.
How to cite: Toledo, D., Apéstigue, V., Arruego, I., Lemmon, M., Montoro, F., Yela, M., Sanchez-Lavega, A., Patel, P., Viudez-Moreiras, D., Martínez, G., Smith, M. D., Vicente-Retortillo, A., de la Torre Juarez, M., Rodríguez-Manfredi, J. A., and Rodríguez, R.: Detection and characterization of clouds at twilight by MEDA-RDS for the first 365 sols, Europlanet Science Congress 2022, Granada, Spain, 18–23 Sep 2022, EPSC2022-777, https://doi.org/10.5194/epsc2022-777, 2022.
Please decide on your access
Please use the buttons below to download the presentation materials or to visit the external website where the presentation is linked. Regarding the external link, please note that Copernicus Meetings cannot accept any liability for the content and the website you will visit.
Forward to presentation link
You are going to open an external link to the presentation as indicated by the authors. Copernicus Meetings cannot accept any liability for the content and the website you will visit.
We are sorry, but presentations are only available for users who registered for the conference. Thank you.
Posters: Mon, 19 Sep, 18:45–20:15 | Poster area Level 1
The scattering matrices of three well-characterized Martian dust simulants (JSC Mars-1, MGS-1 and MMS-2) have been measured at the Cosmic Dust Laboratory in Granada as part of the experimental work package of the ROle and impAct of Dust and clouds in the Martian AtmosPhere (ROADMAP) project. These simulants have been chosen from a range of representative dust analogues discussed in the recent literature (Allen, Jager, et al., 1998; Allen, Morris, et al., 1998; Cannon et al., 2019; Morris et al., 2001; Peters et al., 2008). The bulk chemical composition and mineralogy have been retrieved from the sample manufacturers and the relevant literature and double checked in our facilities. The samples have been size-segregated using state-of-the-art Materials Science techniques. The particle sizes have been measured for the size fractions obtained, showing narrow size-distributions unprecedented in the context of dust light scattering studies. Information about the morphology of the particles has been obtained from electron microscopy images. Reflectance spectra have been measured as well. The three Martian analogue samples with size distributions in the 6 μm < r < 30 μm range have similar scattering matrices at 488 nm and 640 nm. The simulant that deviates most from the rest is JSC Mars-1, with a shallower phase function and generally higher values of the other non-zero elements of the scattering matrix. The differences are interpreted in terms of the absorption coefficients and the morphology of the dust particles.
References
Allen, C. C., Morris, R. V., Jager, K. M., Golden, D. C., Lindstrom, D. J., Lindstrom, M. M., & Lockwood, J. P. (1998). Martian Regolith Simulant JSC Mars-1. In Lunar and Planetary Science Conference (p. 1690).
Allen, C. C., Jager, K. M., Morris, R. V., Lindstrom, D. J., Lindtsrom, M. M., & Lockwood, J. P. (1998). Martian soil simulant available for scientific, educational study. Eos, Transactions American Geophysical Union, 79(34), 405–409. https://doi.org/10.1029/98EO00309
Cannon, K. M., Britt, D. T., Smith, T. M., Fritsche, R. F., & Batcheldor, D. (2019). Mars global simulant MGS-1: A Rocknest-based open standard for basaltic martian regolith simulants. Icarus, 317, 470–478. https://doi.org/10.1016/J.ICARUS.2018.08.019
Morris, R. V., Golden, D. C., Ming, D. W., Shelfer, T. D., Jørgensen, L. C., Bell, J. F., et al. (2001). Phyllosilicate-poor palagonitic dust from Mauna Kea Volcano (Hawaii): A mineralogical analogue for magnetic Martian dust? Journal of Geophysical Research: Planets, 106(E3), 5057–5083. https://doi.org/10.1029/2000JE001328
Peters, G. H., Abbey, W., Bearman, G. H., Mungas, G. S., Smith, J. A., Anderson, R. C., et al. (2008). Mojave Mars simulant—Characterization of a new geologic Mars analog. Icarus, 197(2), 470–479. https://doi.org/10.1016/J.ICARUS.2008.05.004
How to cite: Gomez Martin, J. C., Martikainen, J., Gray, Z., Peiteado, M., Jardiel, T., and Muñoz, O.: Experimental scattering matrices of Martian dust analogues for radiative modelling and remote sensing applications., Europlanet Science Congress 2022, Granada, Spain, 18–23 Sep 2022, EPSC2022-66, https://doi.org/10.5194/epsc2022-66, 2022.
The atmosphere of Mars is driven by different cycles – seasonal cycles of temperature, dust, ice, water vapour, CO2, etc. – which are coupled through transport: dust is blown from the surface by winds, carried aloft where it absorbs solar radiation and heats the atmosphere, impacting temperature, composition and winds. Formation of water ice crystals scavenges dust back from the surface. Water, being involved in the creation processes of clouds, is one of the most important species in the atmosphere. It controls the stability of the atmosphere, dominates its chemistry, and has a radiative impact through the formation of clouds.
Dust is present everywhere on Mars, yet its abundance, physical properties, size distribution as well as impact on the composition, structure and dynamics of the atmosphere has today only barely been addressed and understood. However, knowledge of the characteristics of aerosols (such as dust, ices, clouds and haze) is crucial for the interpretation of the IR and UV spectra because they absorb in these spectral regions, and their absorption signature overlaps the absorption features of other species (such as O3 in the UV), and they regulate the travelling path of light in the atmosphere through absorption and (multiple) scattering. Their impact is difficult to accurately estimate because their spectral characteristics are not known with enough accuracy.
The goal of the ROADMAP project (ROle and impAct of Dust and clouds in the Martian AtmosPhere) is to better characterize the Martian dust and clouds in terms of size, shape and loading within the atmosphere, but also to provide laboratory reference data which will be used to improve our knowledge on the genesis, transport and impact of dust and clouds on the Martian atmosphere.
The team behind the RoadMap project brings together the laboratory community, scientists involved in space missions and numerical modellers to promote synergies through their different perspectives and experiences: laboratory scientists understand the reference data and know-how to extract the most value from their experiments; mission scientists know the intricacies and potential of the instruments and the details of their calibration; numerical modellers know what data, information and parameters are most pertinent to their simulations and how best to interpret the results.
We will describe the methodology behind the project and show how we intend to improve space exploration (observation and modelling of the atmosphere) using new laboratory results (dust resuspension induced by saltation, scattering properties, etc).
The RoadMap (ROle and impAct of Dust and clouds in the Martian AtmosPhere) project has received funding from the European Union’s Horizon 2020 research and innovation programme under grant agreement No 101004052.
How to cite: Vandaele, A. C., Merrison, J., Wurm, G., Munoz, O., Jardiel, T., Lindqvist, H., Wolff, M., Neary, L., Willame, Y., Piccialli, A., Trompet, L., Flimon, Z., Abesha, A., Becker, T., Martikainen, J., Gomez-Martin, J. C., and Peiteado, M.: RoadMap to understand the role of dust in the atmosphere of Mars, Europlanet Science Congress 2022, Granada, Spain, 18–23 Sep 2022, EPSC2022-576, https://doi.org/10.5194/epsc2022-576, 2022.
Background
Water vapor in the Martian atmosphere can condense into ice-crystals, forming water ice clouds. At one hand, this works as a cooling mechanism by reflecting incoming solar radiation back into space, and on the other hand as a warming mechanism by the absorption of outgoing longwave radiation from the surface of the planet.
Near-infrared observations taken by the Compact Reconnaissance Imaging Spectrometer (CRISM) aboard the Mars Reconnaissance Orbiter (MRO) provide important information about the atmospheric constituents of Mars, including water ice aerosols. The wealth of data collected in the time period between September 2006 (Mars Year MY28, Ls = 112°) and September 2016 (MY33, Ls = 86°) covers over 5+ Martian years. We here present water ice aerosol opacity maps to provide insights into its spatial, seasonal and interannual variability, and its implications on cloud formation.
Methodology
The retrieval algorithm used here is first described in Smith et al. (2009) and subsequently adapted and used to provide CRISM atmospheric water ice opacity retrievals. The first step in the retrieval process is to define the background continuum level in the CRISM spectra by fitting the Lambert albedo of the surface between two continuum channels at 2462 nm and 3797 nm away from major absorption bands, and then linearly interpolate the continuum levels between the two channels. A-priori water ice aerosol optical depths are taken from concurrent Mars Odyssey Thermal Emission Imaging System THEMIS observations (Smith et al., 2003). The retrieval process then applies a correlated-k approximation method for gas absorption (Lacis and Oinas, 1991) on the central observation where it calculates the gas absorption (mainly CO2 and water vapor) using tabulated values of opacities until convergence between the modeled and observed CRISM spectrum. We utilized the water ice feature (Fig. 1) by fitting the spectra in the 2900 – 3700 nm range at three channels at 2900 nm, 3497 nm and 3603 nm, from 30,000+ near-nadir targeted CRISM spectra to generate maps of the column integrated water ice opacity. The water ice is assumed to be well mixed above the water condensation level, and the ice clouds are assumed to be composed of 2-micron particles (e.g., Smith et al. 2009; 2018). Multiple scattering from water ice aerosols was treated using the discrete ordinates method described in Thomas & Stamnes (1999), as in Smith et al. (2018).
Results:
At the CRISM near-infrared wavelength regime, strong absorption features originating from the presence of H2O and CO2 surface ice from the north and south polar layered deposits heavily influence the retrievals of atmospheric water aerosol opacities, therefore we avoided retrievals over surface ice using a threshold on the presence of surface ice as defined in previous works (e.g., Khayat et al., 2019). The generated CRISM water ice climatology from CRISM is shown in Figure 2. The decrease in the frequency of observations beyond the second Mars year is due to the degradation of the cryocooler on CRISM, leading to a careful planning of the observations, and the vertical gaps are due to spacecraft anomalies and to the lack of data collection during solar conjunction. The aphelion cloud belt (ACB) is well observed around Ls = 90° for every Mars year at the equatorial latitudes, and lasting for at least a period of Ls = 100°. The ACB exhibits small interannual variability, with lower values of ice opacity at MY 29 (Ls ~ 450°) and higher values at MY 30 (Ls ~ 810°) and MY 31 (Ls ~ 1170°). A lack of water ice aerosols (τ3300nm < 0.1) is observed during northern autumn and winter of every Mars year in the southern hemisphere, and reaching latitudes in the north up to 50 °N at the beginning of northern winter. High opacities of water ice aerosols (τ3300nm > 0.4) are observed at high northern latitudes (> 50 °N) and last for the entirety of the northern winter, followed by values around (τ3300nm ~ 0.25) over the polar latitudes in the north at the beginning of northern summer and lasting for the whole season. A similar trend is observed in the THEMIS water ice climatology with the respect to the timing in the maxima and minima in the optical depths, but a noticeable difference is observed over the north polar latitudes around the beginning of northern summer where high water ice opacities are not observed in the THEMIS climatology. A detailed analysis to address this discrepancy is currently underway.
Acknowledgments:
The authors acknowledge financial support from the NASA Mars Reconnaissance Orbiter project and are grateful for the work done by the CRISM operations team. This work is supported by the NASA ROSES Planetary Data Archiving, Restoration, and tools, grant number 80NSSC21K0880.
References:
[1] Khayat, A. SJ., Smith, M. D., Guzewich, S. D., 2019. Icarus 321, 722-735.
[2] Lacis, A.A., Oinas, V., 1991. J. Geo- phys. Res., 96, 9027 – 9063.
[3] Smith, M. D., J. L. Bandfield, P. R. Christensen, and M. I. Richardson, 2003. J. Geophys. Res., 108(E11), 5115.
[4] Smith, M.D., Wolff, M.J., Clancy, R.T., Murchie, S.L., 2009. J. Geophysics. Res. 114, E00D03.
[5] Smith, M.D., Daerden, F., Neary, L., Khayat, A., 2018. Icarus301,117–131.
[6] Thomas, G.E., Stamnes, K., 1999. Cambridge Univ. Press, Cambridge.
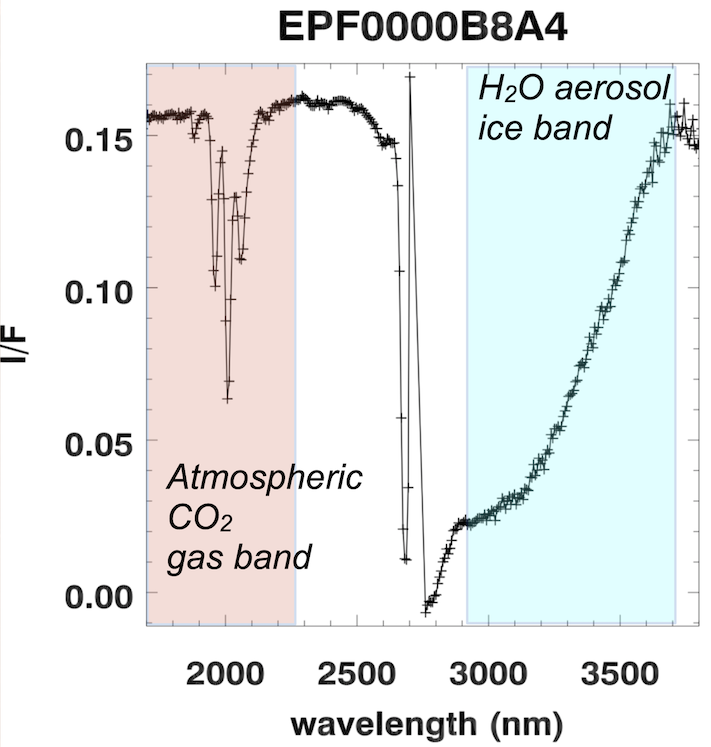
Figure 1: Near-nadir CRISM spectrum from observation EPF0000B8A4 taken around the aphelion cloud belt around Ls = 90°. The highlighted areas in light red represents the atmospheric absorption band at 2000 nm belonging to CO2 and it is used to retrieved the surface pressure. A large water ice aerosol feature is detected in the 3000 – 3700 nm range and is highlighted in blue.
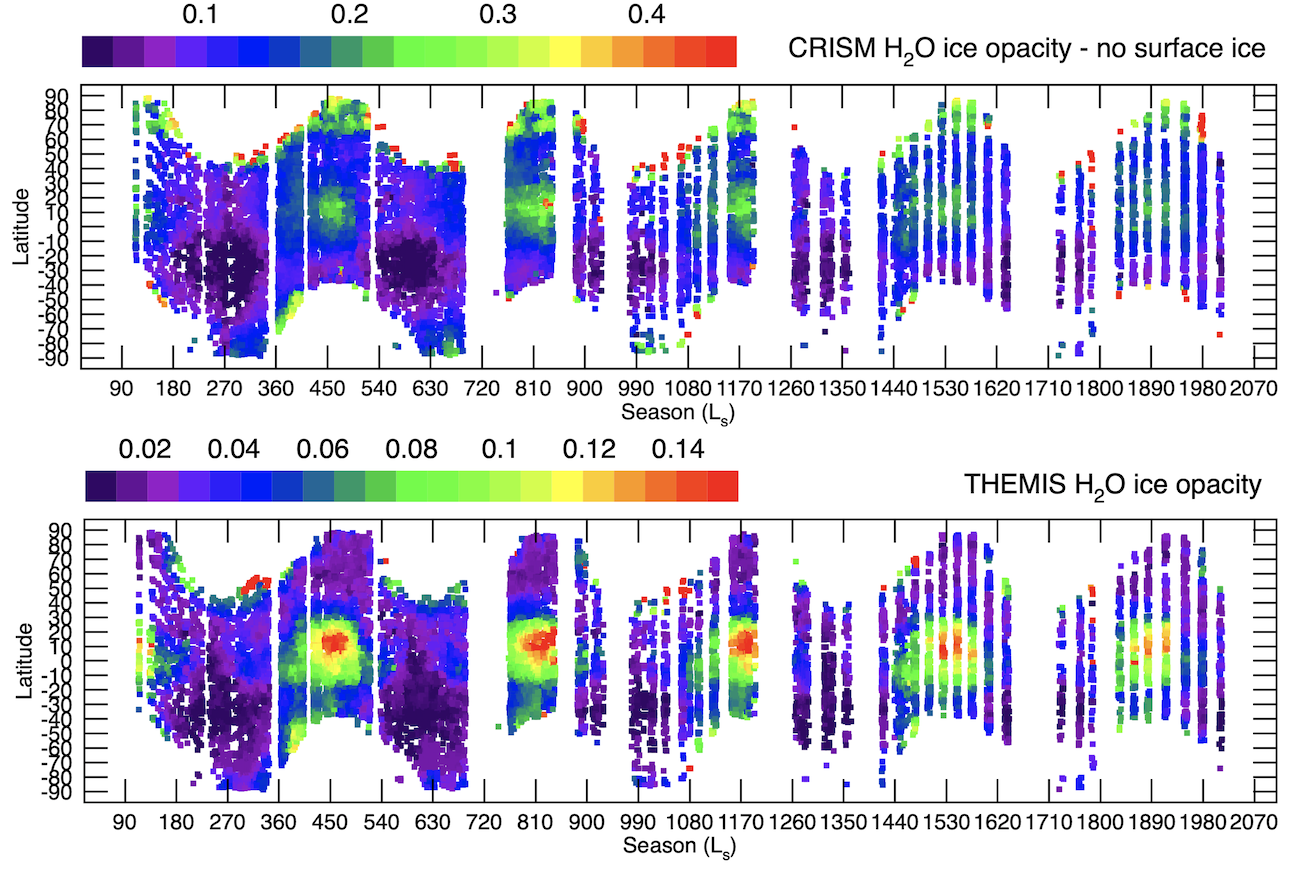
Figure 2: Upper panel: CRISM retrieved zonal water ice opacity (Tau) from near-infrared spectra around 3300 nm between MY28 and MY33 taken at ~ 15:00 local time. Lower panel: Concurrent THEMIS water ice opacity at 12120 nm (825 cm-1) interpolated at the location and season on Mars.
How to cite: Khayat, A., Smith, M., Wolff, M., Guzewich, S., Mason, E., and Atwood, S.: Mars atmospheric water ice climatology as retrieved by MRO/CRISM: 5 years of observations, Europlanet Science Congress 2022, Granada, Spain, 18–23 Sep 2022, EPSC2022-617, https://doi.org/10.5194/epsc2022-617, 2022.
Attempting to use dust analogue from lab to study Martian atmosphere
- Flimon1, J. Erwin1, A.C. Vandaele1, L. Neary1, A. Piccialli1, L. Trompet1,Y. Willame1, F. Vanhellemont, S. Bauduin2, M.Wolff4, Olga Munoz3, Julia Martikainen3, Juan Carlos Gomez Martin3, Fernando Moreno3
1 Royal Belgian Institute for Space Aeronomy, BIRA-IASB
2 Université libre de Bruxelles (ULB), Spectroscopy, Quantum Chemistry and Atmospheric Remote Sensing (SQUARES), Brussels, Belgium
3 Instituto de Astrofìsica de Andalucía, Consejo Superior de Investigaciones Científicas (CSIC), Granada, Spain
4Space Science Institute, Boulder Colorado, USA
Introduction:
Aerosols are present in the atmosphere of Mars and have a major effect on it. They are mainly composed of dust, water ice and CO2 ice. Dust is confined to lower altitudes during the aphelion season and can reach higher altitudes during the perihelion, especially during dust storms that frequently arise on Mars. These storms can sometimes grow up to cover the entire planet and are then called global dust storms. They have important consequences on the atmosphere as dust will heat the atmosphere and change its composition. The dust can go higher in altitude and bring, for example, water vapor to places where we do not see it outside the dust storm.
Previous studies worked on dust climatology but the composition is still not well constrained. To understand the mechanisms behind the dust lifting and the impact of dust in the mesosphere, it is important to have a good understanding of the Martian dust. Knowing the size of the grain, the vertical profile, or the composition are key elements to understanding its radiative property.
The goal of the RoadMap (ROle and impAct of Dust and clouds in the Martian AtmosPhere) project is to use Martian dust analogues, measure their radiative and optical properties and compare them to space measurements of the Martian atmosphere. The space measurements considered here are made by the NOMAD instrument.
The NOMAD (“Nadir and Occultation for MArs Discovery”) spectrometer suite onboard the ExoMars Trace Gas Orbiter (TGO) is composed of three spectrometers. In this work, we will use the UVIS channel in occultation mode.
Method:
The extinction efficiency, Qext is computed using a Mie code (Bohren, et al., 1998) considering a log-normal size distribution and refractive indeces for Martian dust from (Wolff et al., 2009) and the new values obtained within the RoadMap project.
To compute the extinction due to aerosols from the transmittances of UVIS, we first use the ASIMUT code (Vandaele, et al., 2006.) to make a fit of the ozone abundance. The ozone absorption (as well as the Rayleigh extinction) is then subtracted from the original transmittances. In the result should remain only the contribution due to the aerosol extinction. Local extinctions are then computed from these reduced transmittances using a simple onion peeling methodology.
Preliminary results:
We made comparisons of the extinction cross section from Wolff and RoadMap refractive indices. The first results obtained are a net difference in value between the two dataset. Wolff values are higher by several order of magnitude. More work will be done to understand this and show the agreement or disagreement between both datasets with real data.
Acknowledgements:
The NOMAD experiment is led by the Royal Belgian Institute for Space Aeronomy (IASB-BIRA), assisted by Co-PI teams from Spain (IAA-CSIC), Italy (INAF-IAPS), and the United Kingdom (Open University). This project acknowledges funding by the Belgian Science Policy Office (BELSPO), with the financial and contractual coordination by the ESA Prodex Office (PEA 4000103401, 4000121493), by Spanish Ministry of Science and Innovation (MCIU) and by European funds under grants PGC2018-101836-B-I00 and ESP2017-87143-R (MINECO/FEDER), as well as by UK Space Agency through grants ST/V002295/1, ST/V005332/1 and ST/S00145X/1 and Italian Space Agency through grant 2018-2-HH.0. This work was supported by the Belgian Fonds de la Recherche Scientifique – FNRS under grant number 30442502 (ET_HOME). The IAA/CSIC team acknowledges financial support from the State Agency for Research of the Spanish MCIU through the ‘Center of Excellence Severo Ochoa’ award for the Instituto de Astrofísica de Andalucía (SEV-2017-0709). US investigators were supported by the National Aeronautics and Space Administration. Canadian investigators were supported by the Canadian Space Agency. The ROADMAP project has received funding from the European Union’s Horizon 2020 research and innovation programme under grant agreement No 101004052.
References:
Bohren, Craig F. and Donald R. Huffman,Absorption and scattering of light by small particles, New York : Wiley, 1998, 530 p., ISBN 0-471-29340-7, ISBN 978-0-471-29340-8 (second edition)
Vandaele, A.C., Kruglanski, M., Mazière, M.D., n.d. MODELING AND RETRIEVAL OF ATMOSPHERIC SPECTRA USING ASIMUT 6.
Wilquet, V., Drummond, R., Mahieux, A., Robert, S., Vandaele, A.C., Bertaux, J.-L., 2012. Optical extinction due to aerosols in the upper haze of Venus: Four years of SOIR/VEX observations from 2006 to 2010. Icarus 217, 875–881. https://doi.org/10.1016/j.icarus.2011.11.002
Wolff, M.J., Smith, M.D., Clancy, R.T., Arvidson, R., Seelos, F., Murchie, S., Savijärvi, H., 2009. Wavelength dependence of dust aerosol single scattering albedo as observed by the Compact Reconnaissance Imaging Spectrometer. J. Geophys. Res. 114, E00D04. https://doi.org/10.1029/2009JE003350
How to cite: flimon, Z., erwin, J., vandaele, A. C., Neary, L., piccialli, A., trompet, L., willame, Y., Vanhellemont, F., bauduin, S., wolff, M., Munoz, O., Martikainen, J., Gomez Martin, J. C., and Moreno, F.: Attempting to use dust analogue from lab to study Martian atmosphere, Europlanet Science Congress 2022, Granada, Spain, 18–23 Sep 2022, EPSC2022-640, https://doi.org/10.5194/epsc2022-640, 2022.
1. Introduction
Thermal infrared datasets from planetary bodies have the potential to provide key insights for the understanding of a planet's climate evolution and history: valuable information about composition, temperature and state of the atmosphere can be retrieved from thermal spectral data.
In this work, we present the application of a methodology based on Principal Component Analysis (PCA) and Target Transformation (TT) Factor Analysis (FA) techniques to thermal infrared data of the ExoMars2016 Trace Gas Orbiter (TGO) with the main goal to retrieve the different particulate atmospheric contributions present in the spectra and separate them from the surface contributions.
2. Instrument and dataset
TGO has a suite of spectroscopic instruments for the investigation of the Red Planet in the infrared spectral range known as Atmospheric Chemistry Suite (ACS) [1] consisting of three spectrometers observing Mars in solar occultation, nadir and limb geometry in the Near-InfraRed (NIR), Mid-InfraRed (MIR) and Thermal InfraRed (TIR) spectral channels. Among them, the ACS thermal-infrared channel (TIRVIM) covers the spectral range between 1.7-17 μm with apodized resolution varying from 0.2 to 1.3 cm−1 [1]. TIRVIM has similar capabilities to IRIS (Mariner 9), TES, and PFS in several aspects, but has some advantages: - higher spectral resolution; - better noise equivalent radiance (from 0.08 mW/m2/sr-1/cm-1); - dense spatial coverage (TGO has a circular orbit of 400 km) [1].
Martian TIRVIM spectra acquired along the orbits that cross Elysium Planitia, landing site of the NASA’s Insight (Interior exploration using Seismic Investigations, Geodesy and Heat Transport) lander, were here analyzed. The selected data orbits span from Ls=150°C to Ls=210°C, covering part of the Martian summer and of the Martian autumn going through the autumn equinox in the northern hemisphere of the planet. Corresponding Local Times cover Martian days and nights.
3. Methodology
To analyze the ExoMars TIRVIM data and retrieve and characterize the number of varying atmospheric components present in these data and their spectral shape, a methodology was applied based on a combination of PCA and TT – FA techniques [2, 3]. These techniques are demonstrated to be able to extract the composition of laboratory samples [4, 5]; to extract the principal varying components from a big spectral dataset in the thermal infrared [3], and then to identify them as components of the atmosphere and separate their contribution from surface emission [6]. This methodology, previously successfully adopted for the analysis of TES and PFS data [2, 7], was, here, applied for the first time to the analysis of the new and at higher spectral resolution TIRVIM dataset. Considering that the PCA works best when the different components have significant variation in the data, we selected data where these variations are more likely to occur: the analyzed data cover diurnal as well as seasonal variations.
A list of PFS and TES atmospheric end-members extracted from [3] and [2] were used as initial guess for the TT, to interpret the abstract eigenvectors retrieved from the PCA and attribute them a physically coherent meaning.
4. Results and future developments
Spectral shapes of atmospheric dust and water ice aerosols were recovered from the analyzed TIRVIM data. Comparisons with results previously obtained on PFS and TES data (Figure 1) validate the methodology used and show that it is capable of determining the number of independently variable components and recovering the spectral endmembers present in the TIRVIM data.
Figure 1. Comparison between the general TES/PFS extracted endmembers [2, 3] (upper panel) and the endmembers extracted from the TIRVIM data in this work (bottom panel). Grey area: wavelength cut due to high instrumental noise.
Deconvolution of the original spectra using the recovered spectral end-members allowed us to obtain the concentration coefficients of the dust and water ice end-members and retrieved abundances maps. The results obtained are promising in terms of identification and separation of the atmospheric components and have strong impact on the identification of surface contributions in the spectra. We are further investigating this point with the main goal of showing the potential of this method to extract valuable information from TIRVIM data not only on the atmosphere, but also on the surface of the Red Planet. Derived surface emissivity products are being analyzed by linear deconvolution analysis with the laboratory spectral database of Martian analogues measured at the Planetary Spectroscopy Laboratory (PSL) of DLR, in Berlin [5].
Acknowledgments
ExoMars is a space mission of ESA and Roscosmos. The ACS experiment is led by IKI, the Space Research Institute in Moscow, assisted by LATMOS in France. The science operations of ACS are funded by Roscosmos and ESA.
References
[1] Korablev et al. (2018) Space Science Review, 214:7. [2] D’Amore M. et al. (2013) Icarus, 226, 1294-1303. [3] Bandfield J.L., Christensen P.R., Smith M.D. (2000) JGR, 105 (E4), 9573-9587. [4] Smith, M.O., Adams, J.B., Johnson, P.E. (1985) JGR, 90, 797-804. [5] Alemanno G., Maturilli A., D’Amore M., Helbert J. (2021) Icarus, 368. [6] Smith M. D., Bandfield J. L. and Christensen P.R. (2000) JGR, 85 (E4), 9589-9607. [7] Maturilli, A., Helbert, J., D’Amore, M. (2009) EPSC2009, Abstract #EPSC2009-106.
How to cite: Alemanno, G., D'Amore, M., Maturilli, A., Helbert, J., Arnold, G., Korablev, O., Ignatiev, N., Grigoriev, A., Shakun, A., and Trokhimovskiy, A.: Particulate atmospheric endmembers retrieval from ExoMars Thermal Infrared (TIRVIM) spectral data, Europlanet Science Congress 2022, Granada, Spain, 18–23 Sep 2022, EPSC2022-862, https://doi.org/10.5194/epsc2022-862, 2022.
Aerosols are key components of the Martian radiative transfer. For instance, airborne dust is ubiquitous on the planet and influences the climate by absorbing shortwave radiation, resulting in a local warming of the atmosphere. While ice clouds are related to the water cycle, forming due to adiabatic cooling of upward flows where the water vapor condenses on dust particles as the temperature is low enough. Nadir UV measurements are commonly used to monitor the aerosol loading and the ozone abundance in the Martian atmosphere and study their seasonal cycles [e.g. Perrier et al., 2006; Mateshvili et al., 2009; Clancy et al., 2016; Willame et al., 2017; Wolff et al., 2019].
The analysis of UV nadir measurements, from MEX/SPICAM in a previous work [Willame et al., 2017] and currently from the NOMAD/UVIS data, were performed using the canonical dust scattering properties obtained in [Wolff et al., 2010]. In the frame of the RoadMap project, we will assess the impact on the nadir retrievals of using new sets of dust properties derived from laboratory measurements (see related presentation/poster of Martikainen et al. about lab measurements). In the present work, we will present preliminary results of the retrieval analysis.
Acknowledgements
The NOMAD experiment is led by the Royal Belgian Institute for Space Aeronomy (IASB-BIRA), assisted by Co-PI teams from Spain (IAA-CSIC), Italy (INAF-IAPS), and the United Kingdom (Open University). This project acknowledges funding by the Belgian Science Policy Office (BELSPO), with the financial and contractual coordination by the ESA Prodex Office (PEA 4000103401, 4000121493), by Spanish Ministry of Science and Innovation (MCIU) and by European funds under grants PGC2018-101836-B-I00 and ESP2017-87143-R (MINECO/FEDER), as well as by UK Space Agency through grants ST/V002295/1, ST/V005332/1 and ST/S00145X/1 and Italian Space Agency through grant 2018-2-HH.0. This work was supported by the Belgian Fonds de la Recherche Scientifique – FNRS under grant number 30442502 (ET_HOME). The IAA/CSIC team acknowledges financial support from the State Agency for Research of the Spanish MCIU through the ‘Center of Excellence Severo Ochoa’ award for the Instituto de Astrofísica de Andalucía (SEV-2017-0709). US investigators were supported by the National Aeronautics and Space Administration. Canadian investigators were supported by the Canadian Space Agency. The ROADMAP project has received funding from the European Union’s Horizon 2020 research and innovation programme under grant agreement No 101004052.
References
Clancy, R.T., Wolff, M.J., Lefvre, F., Cantor, B.A., Malin, M.C., Smith, M.D., 2016. Daily global mapping of Mars ozone column abundances with MARCI UV band imaging. Icarus 266, 112–133.
Mateshvili, N., Fussen, D., Vanhellemont, F., Bingen, C., Dekemper, E., Loodts, N., Tetard, C., 2009. Water ice clouds in the Martian atmosphere: two Martian years of SPICAM nadir UV measurements. Planet. Space Sci. 57, 1022–1031.
Perrier, S., Bertaux, J.L., Lefèvre, F., Lebonnois, S., Korablev, O., Fedorova, A., Montmessin, F., 2006. Global distribution of total ozone on Mars from SPICAM/MEX UV measurements. J. Geophys. Res. (Planets) 111, 9.
Willame Y., A.C. Vandaele, C. Depiesse, F. Lefèvre, V. Letocart, D. Gillotay, F. Montmessin. Retrieving cloud, dust and ozone abundances in the Martian atmosphere using SPICAM/UV nadir spectra. Planetary and Space Science, 2017, Volume 142, Pages 9-25.
Wolff, M.J., Clancy, R.T., Goguen, J.D., Malin, M.C., Cantor, B.A., 2010. Ultraviolet dust aerosol properties as observed by MARCI. Icarus 208, 143–155.
Wolff M.J., R. Todd Clancy, Melinda A. Kahre, Robert M. Haberle, François Forget, Bruce A. Cantor, Michael C. Malin, 2019. Mapping water ice clouds on Mars with MRO/MARCI, Icarus, Volume 332.
How to cite: Willame, Y., Vandaele, A. C., Erwin, J., Wolff, M., Piccialli, A., Neary, L., Flimon, Z., Vanhellemont, F., Daerden, F., Muñoz, O., Martikainen, J., Depiesse, C., Mason, J., Thomas, I., Ristic, B., Patel, M., Bellucci, G., and Lopez Moreno, J. J.: Preliminary results of nadir retrievals from NOMAD/UVIS using new dust properties from lab measurements, Europlanet Science Congress 2022, Granada, Spain, 18–23 Sep 2022, EPSC2022-868, https://doi.org/10.5194/epsc2022-868, 2022.
The Nadir and Occultation for Mars Discovery (NOMAD) is one of the four instruments on board the 2016 ExoMars Trace Gas Orbiter. The instrument is a suite of three spectrometers, mainly designed to study minor atmospheric species at high spectral resolution (A.C. Vandaele et al., 2015; E. Neefs et al., 2015). Nevertheless, Oliva et al. (2022) demonstrated the capability of NOMAD infrared nadir channel to investigate surface ice composition in the 2.3 – 2.6 μm wavelength range. Ice signatures have been also observed at mid/equatorial latitudes suggesting, after analysis, the first detection of CO2 ice clouds through the study of the narrow 2.35 μm absorption band.
In this work, we also use observations of the NOMAD infrared LNO channel in order to evaluate its capability to detect H2O ice clouds. We present a technique taking advantage of the 2.7 µm strong ice absorption band. For this study, we select LNO spectral orders 167, 168, 169 and combine them to derive a spectral index for H2O ice detection, namely the Frost and Clouds Index (FCI). The acquisition of data during Mars Year 34 and 35 (March 2018 to February 2021) allows us to construct seasonal maps for H2O ice clouds. The results appear in agreement with previous studies focused on Mars Express SPICAM/UV and OMEGA data analysis (Willame et al., 2017; Olsen et al., 2021). FCI is sensitive to the Polar Hood clouds, although the full structure is not detected. Moreover, detections in the Aphelion Cloud Belt (ACB) are limited. This is consistent with previous OMEGA spectrometer observations (Olsen et al, 2021) showing different physical properties between the two main Martian atmospheric structures and making the ACB less detectable in the infrared. We hence derive the LNO channel sensitivity limit for these clouds detection.
Acknowledgements
ExoMars is a space mission of the European Space Agency (ESA) and Roscosmos. The NOMAD experiment is led by the Royal Belgian Institute for Space Aeronomy (IASB-BIRA), assisted by Co-PI teams from Spain (IAA-CSIC), Italy (INAF-IAPS), and the United Kingdom (The Open University). This project acknowledges funding by the Belgian Science Policy Office (BELSPO), with the financial and contractual coordination by the ESA Prodex Office (PEA 4000103401, 4000121493), by Spanish Ministry of Science and Innovation (MCIU) and by European funds under grants PGC2018-101836-BI00 and ESP2017-87143-R (MINECO/FEDER), as well as by UK Space Agency through grants ST/V002295/1, ST/V005332/1 and ST/S00145X/1 and Italian Space Agency through grant 2018-2-HH.0. This work was supported by the Belgian Fonds de la Recherche Scientifique – FNRS under grant number 30442502 (ET_HOME). The IAA/CSIC team acknowledges financial support from the State Agency for Research of the Spanish MCIU through the ‘Center of Excellence Severo Ochoa’ award for the Instituto de Astrofísica de Andalucía (SEV-2017-0709). US investigators were supported by the National Aeronautics and Space Administration. Canadian investigators were supported by the Canadian Space Agency. SR thanks BELSPO for the FED-tWIN funding (Prf-2019-077 - RT-MOLEXO).
References
A.C. Vandaele, et al., 2015. Optical and radiometric models of the NOMAD instrument part I: the UVIS channel. Optics Express, 23(23):30028–30042.
Neefs, et al., 2015. NOMAD spectrometer on the ExoMars trace gas orbiter mission: part 1—design, manufacturing and testing of the infrared channels. Applied optics, 54(28):8494–8520.
Oliva, F., et al., 2022. Martian CO2 Ice Observation at High Spectral Resolution With ExoMars/TGO NOMAD. Journal of Geophysical Research: Planets, 127, e2021JE007083.
Willame, Y., et al., 2017. Retrieving cloud, dust and ozone abundances in the martian atmosphere using spicam/uv nadir spectra.Planetary and SpaceScience, 142:9–25.
K.S. Olsen, et al., 2021 Retrieval of the water ice column and physical properties of water-ice clouds in the martian atmosphere using the OMEGA imaging spectrometer, Icarus, Volume 353, 2021, 113229, ISSN 0019-1035.
How to cite: Ruiz Lozano, L., Karatekin, Ö., Dehant, V., Bellucci, G., Oliva, F., D'Aversa, E., Altieri, F., Carrozzo, F. G., Willame, Y., Thomas, I., Daerden, F., Ristic, B., Patel, M., López Moreno, J. J., and Vandaele, A. C.: Evaluation of the capability of ExoMars-TGO NOMAD infrared nadir channel for water ice clouds detection on Mars, Europlanet Science Congress 2022, Granada, Spain, 18–23 Sep 2022, EPSC2022-946, https://doi.org/10.5194/epsc2022-946, 2022.
Previous CO2 ice cloud modeling studies [Colaprete et al., 2003, Tobie et al., 2003, Forget et al., 1998, Kuroda et al., 2013, Colaprete et al., 2008] allowed to develop and test ideas on CO2 ice cloud formation; however, the studies were often made in idealized settings and included simplified physics and/or limited model boundaries such as a low model top. Listowski et al. [2014] developed refined CO2 cloud microphysics adapted for the Martian conditions of a near-pure vapor condensing in highly supersaturated conditions [Listowski et al., 2013]. They showed with a one-dimensional model and a temperature structure including tidal and gravity wave effects that an additional source of condensation nuclei (CN) was required in the mesosphere for the formation of observed-like clouds.
The model of Listowski et al. [2014] has now been coupled with the LMD Mars GCM (MGCM), jointly developed by several laboratories, including LATMOS, LMD, and IAA. The MGCM is now able to simulate the formation of CO2 ice clouds in the Martian atmosphere taking into account mineral dust particles and water ice crystals as potential condensation nuclei (CN). The first simulations are used for testing the new microphysics
and comparing its results to the previous simplified CO2 condensation parameterization. The simulations are compared to the published CO2 ice cloud observations.
We are using the most recent version of the MGCM and most of the included processes have been described in Navarro et al. [2014], including water ice cloud microphysics and their radiative effect. The new CO2 ice cloud microphysics follow closely the implementation of water ice cloud microphysics in the MGCM, performed via the so-called modal approach, frequently used in GCMs. This means that the particle size distribution is described assuming a lognormal form for the distribution and its evolution is described through the integral properties (moments) of the distribution.
We have performed three simulations, one with the previous, simple parametrization of CO2 condensation, one with the new CO2 cloud microphysics but only including dust particles as CN, and one using both dust and water ice as CN, respectively called PARAM, MPCO2,
and MPCO2+H2OCN. The simulations have been run for three Martian years and we take the results from the last simulation year to insure convergence. We use the climatological dust scenario that describes well an average Martian Year without a global dust storm. We use a spatial resolution of 5.6258° longitude x 3.758° latitude, corresponding to a 64 longitude x 48 latitude horizontal grid, and 32 vertical levels. The model top is defined at the pressure level 3x10⁻³ Pa that corresponds approximately to an altitude of 120 km.
The model produces CO2 ice clouds in the polar regions in the troposphere during the winter and in the mesosphere at equatorial altitudes. Figure 1 shows the CO2 ice column density as a function of latitude and solar longitude for the two simulations: MPCO2 and MPCO2+H2OCN with observations from several instruments [Clancy et al., 2007, Montmessin et al., 2006, Määttänen et al., 2010,McConnochie et al., 2010, Scholten et al., 2010, Vincendon et al., 2011, Aoki et al., 2018, Clancy et al., 2019, Jiang et al., 2019, Liuzzi et al., 2021]. The polar clouds are formed in a larger altitude range than in the observations, reaching from the surface up to 40 km altitude. The polar atmosphere is cold and supersaturated in a deeper layer than in the observations, causing the thicker cloud formation that forms earlier and lasts longer. The cause of the colder polar winter troposphere may be the prescribed dust column depth coming from observations: as there are very few observations in the polar night, the column depth has been given a minimum value that might still be too high compared to reality. This larger dust content in the polar night causing a too large radiative cooling may be the reason for the cold temperatures. The snowfall from polar clouds contributes about 10% to the formation of the polar ice caps.
Substantial mesospheric clouds only form when the model takes into account CO2 ice nucleation on both water ice crystals and dust grains. The seasonal distribution of the clouds agrees well with observations during most of the mesospheric cloud season, but the pause in cloud formation around the aphelion is more clear-cut than in the observations where cloud formation seems to continue during the whole cloud season, although at a lower frequency during a certain period around the aphelion. The clear pause in cloud formation in the model is due to the rise in mesospheric temperatures that seems to be related to a change in the circulation regime and winds in the mesosphere. The optical thickness of the clouds remains two orders of magnitude below observed values, pointing to a need for an exogenous CN source (meteoritic dust: [Listowski et al., 2014, Plane et al., 2018]). Such a source is being added to the model.
Acknowledgements
We thank the Agence National de la Recherche for funding (projet MECCOM, ANR18CE310013), the LabEx ESEP, CNES, PNP, and the Spanish Ministerio de Ciencia, Innovación y Universidades, the Agencia Estatal de Investigación and EC FEDER funds
under project RTI2018-100920-J-I00, and the State Agency for Research of the Spanish MCIU through the Center of Excellence Severo Ochoa award to the Instituto de
Astrofísica de Andalucía (SEV-2017-0709). This work was performed using HPC computing resources from GENCI/CINES (Grant 2021A0100110391), and resources at the ESPRI mesocentre of the IPSL institute.
How to cite: Määttänen, A., Mathé, C., Audouard, J., Listowski, C., Millour, E., Forget, F., González-Galindo, F., Falletti, L., Bardet, D., Teinturier, L., Vals, M., Spiga, A., and Montmessin, F.: Global troposphere-to-msosphre modelling of martian CO2 ice clouds, Europlanet Science Congress 2022, Granada, Spain, 18–23 Sep 2022, EPSC2022-1242, https://doi.org/10.5194/epsc2022-1242, 2022.
Abstract
We present our progress on improvements to the GEM-Mars GCM in the context of the Horizon 2020 RoadMap Project. Through an integrated approach involving lab measurements, micro-modelling, global climate modelling and remote sensing observations, the project aims to better understand the role and impact of dust and clouds on the Martian atmosphere.
Within this project, we use the data from lab experiments and micro-modelling to improve the GEM-Mars Global Climate Model (GCM), with a focus on dust optical properties, mechanisms for dust lifting and microphysical processes.
Introduction
There are still many unknowns and limitations in GCM simulations which cause inaccuracies in the modelled fields, and many of the uncertainties are related to aerosols in the Mars atmosphere. For example, the size distribution and radiative properties of dust and water ice particles are not well known. Through better characterisation of dust from laboratory measurements, we can improve the GCM simulations, and therefore improve the a priori required for data retrieval. As dust is the condensation nuclei for water ice clouds, we can also improve the microphysical representation of these clouds in the model, which in turn will provide more realistic temperatures and global circulation. The interactions in the RoadMap project will also allow to improve the representation of dust lifting, and better define the locations where dust is lifted from the surface, and when.
The GEM-Mars GCM
GEM-Mars is a three-dimensional grid-point based global climate model for the atmosphere of Mars. The physical processes and atmospheric chemistry included are described in Daerden et al., (2019) and Neary and Daerden (2018). GEM-Mars has been applied and evaluated to several recent science investigations including Smith et al. (2021), Bouche et al. (2021), Aoki et al. (2019), Aoki et al. (2022) and Trompet et al. (2022). The impacts of the 2018 global dust storm on the Martian atmosphere were explored in Neary et al. (2019), Daerden et al. (2022a,b) and Khayat et al. (2021). GEM-Mars also participated in a joint modelling exercise for the meteorological conditions at the landing site of the Mars 2020 mission (Newman et al., 2021).
Dust lifting and aerosol properties
Lab experiments using Martian analogue soils were performed by our partners at Aarhus University and the University of Duisburg-Essen and have contributed to an updated formulation of threshold wind stress to describe when lifting may occur. With the same analogue soils (prepared at the Insituto de Ceramica y Vidrio, CSIC-ICV), the scattering properties are being investigated by our partners at the Instituto de Astrofisica de Andalucia (CSIC-IAA). Results from both these lab experiments are then applied and tested in the GEM-Mars GCM.
Microphysics
Currently, GEM-Mars applies a simple dust and cloud scheme. Dust is lifted from the surface in 3 size bins (0.1, 1.5 and 10 µm) and transported by advection, mixing and sedimentation across the atmosphere. Water ice is formed at saturation (100% RH) and condensed into a single Ice Water Content (IWC) tracer. Sedimentation and radiative effects of water ice are calculated by prescribing a fixed particle radius, and assuming the particles are spherical. To obtain a reasonable water cycle over the planet and over the Martian year, the water ice sizes have to vary over altitude. In the current GEM version, these are: 1 μm above 10 km, 2 μm between 5 and 10 km, and 8 μm below 10 km. In addition, to prevent the formation of optically thick clouds over the north polar water ice cap, particle sizes are set to 150 µm below 10 km in summer (Ls = 80°–150°) (Daerden et al., 2022a).
As part of the RoadMap project, we implement a more sophisticated microphysical representation of the formation of ice clouds based on the work of Daerden et al. (2010). The scheme includes the nucleation of water ice on dust particles, deposition and sublimation of water vapour on size-resolved ice and the sedimentation of particles. In Daerden et al. (2010), a one-dimensional model with 100 particle size bins was used. Sensitivity tests using this model helped to improve the computational time for implementation in the 3D GCM. By using fewer particle size bins, we can maintain the basic features of cloud formation while greatly reducing the computational time.
Summary
We will present our progress on the implementation of new dust lifting parameters, and on the development of the size-resolved microphysical representation of dust and clouds. We will first focus on the radiative impact of the increased number of dust particle sizes on the overall global dust cycle.
Acknowledgements
This project has received funding from the European Union’s Horizon 2020 research and innovation programme under grant agreement No 101004052. The authors acknowledge funding by the Belgian Science Policy Office (BELSPO), with the financial and contractual coordination by the ESA Prodex Office (PEA 4000103401, 4000121493).
How to cite: Neary, L. and Daerden, F. and the The RoadMap Team: Improvements to dust and aerosols in GEM-Mars GCM simulations: Results from the RoadMap project, Europlanet Science Congress 2022, Granada, Spain, 18–23 Sep 2022, EPSC2022-637, https://doi.org/10.5194/epsc2022-637, 2022.
Due to the specific atmospheric pressure of a few mbar, Mars is the only planet in the Solar System where thermal creep gas flow occurs naturally within its soil [1,2,3,4,5,6]. As with most flows, this comes with pressure variations. Especially below the top layers of grains, an overpressure develops which sets the soil under tension and supports the lifting of grains from the ground [1,2]. In de Beule et al. 2015, the thickness of an ejected dust layer was measured to be on the order of 200 µm, though upward directed (lifting) forces might also be present further down. This is also in agreement to numerical calculations [2,7]. However, pressure varies on rather small distances of sub-mm which is not easily measurable in a granular bed directly, as small disturbances or changes in the setting already influence the gas flow. So any method of verification of a sub-soil overpressure seems desirable.
Here we use diffusive waves spectroscopy to study the subtle motion of grains within the soil. Illuminating the side of a model soil with a laser beam, scattering and interference lead to a speckle pattern. This pattern changes if particles slightly move. Therefore, a correlation of the patterns over time gives positions depending on the depth where grains move more or less, showing a stratified soil with respect to motion. Among other features, we find a first minimum of particle motion below the surface which shows the characteristic pressure dependence of thermal creep. Specifically, a characteristic maximum depth of about 2 mm is found at about 4 mbar. This depth is somewhat larger than found by de Beule et al. 2015 but in view of the different methods, our measurements are yet another verification that thermal creep sub-soil overpressure is very likely a general mechanism on Mars supporting particle lift [8].
- C. de Beule, G. Wurm, T. Kelling, M. Kuepper, T. Jankowski, and J. Teiser, The Martian Soil as a Planetary Gas Pump, Nature Physics, 10:17-20, 2014.
- C. de Beule, G. Wurm, T. Kelling, M. Köster, and M. Kocifaj, An Insolation Activated Dust Layer on Mars, Icarus, 260:23-28, 2015.
- M. Kuepper and G. Wurm, Thermal Creep Assisted Dust Lifting on Mars: Wind Tunnel Experiments for the Entrainment Threshold Velocity, Journal of Geophysical Research – Planets, 120:1346-1356, 2015.
- M. Kuepper and G. Wurm, Amplification of Dust Loading in Martian Dust Devils by Self-Shadowing, Icarus, 274:249-252, 2016.
- F. Schmidt, F. Andrieu, F. Costard, M. Kocifaj, A.G. Meresescu, Formation of recurring slope lineae on Mars by rarefied gas-triggered granular flows. Nat. Geosci. 10:270–273, 2017.
- M. Koester, T. Kelling, J. Teiser, and G. Wurm, Gas Flow within Martian Soil: Experiments on Granular Knudsen Compressors, Astrophysics and Space Science, 362:171 1-10, 2017.
- M. Kocifaj, J. Klačka, T. Kelling, G. Wurm, Radiative Cooling within Illuminated Layers of Dust on (Pre)-Planetary Surfaces and its Effect on Dust Ejection, Icarus, 211:832-838, 2011.
- T. Bila, J. Kollmer, J. Teiser, and G. Wurm, Thermal Creep on Mars: Visualizing a Soil Layer under Tension, (in prep), 2022.
How to cite: Wurm, G., Bila, T., Teiser, J., and Kollmer, J.: Martian Soil under Tension: Visualizing Thermal Creep Gas Flow by Diffusive Wave Spectroscopy, Europlanet Science Congress 2022, Granada, Spain, 18–23 Sep 2022, EPSC2022-65, https://doi.org/10.5194/epsc2022-65, 2022.
The Visual Monitoring Camera (VMC) on Mars Express (MEX) has the capability to capture full disk images of Mars from apocenters. This has allowed us to compile a large archive of images showing Mars at different local times, including the twilight region beyond the day side terminator. The observation of clouds in twilight enables the estimation of their “minimum altitude”, as they must be high enough over the surface to be illuminated by the sun and appear as bright patches over the darkness of the night.
A systematic study of clouds seen in twilight was made by Hernández-Bernal et al. (2021b). This work extends the analysis, increasing the dataset and focusing on dynamics. VMC has the rare capability to obtain videos showing atmospheric dynamics (e.g. supporting material in Hernández-Bernal et al., 2021a) and we exploit this capability to estimate the accurate altitude of clouds, perform cloud tracking, and analyze their cloud dynamics.
Figure 1. Reproduced from Hernández-Bernal et al. (2021b). (a) Scheme of observation of clouds in twilight. (b-e) examples of clouds in twilight observed by VMC. See original paper for full description.
We run the automated cloud detector pipeline developed by Hernández-Bernal et al. (2021b), to include most recent observations into our dataset. Most recent observations in MY36 reproduce previously reported patterns in the distribution of mesospheric clouds in twilight (Figure 2), and the extended coverage hints the presence of more clouds in twilight than previously observed, at the starting of the year in the southern mid-latitudes, and in the northern mid-latitudes at the starting of the local autumn.
Figure 2. Recent observations of clouds in twilight found by VMC in MY36. The horizontal axis represents the Solar Longitude (Ls). See the equivalent graph for the whole dataset in Hernández-Bernal et al. (2021b)
We use this extended dataset of clouds in twilight observed by VMC to feed a newly developed pipeline that creates videos showing the dynamics of such clouds. This new pipeline outputs around 500 videos. All these videos are manually analyzed and cloud tracking is performed when possible. Less than 100 videos exhibit a good quality and show clouds that are suitable for cloud tracking. We compare our cloud tracking to expected winds as given by the Mars Climate Database (MCD; Millour et al., 2015).
The results of this work are expected to be a valuable dataset, as it involves the direct measurement of winds at specific altitudes, very often in the mesosphere of Mars. Määttänen et al. (2010) also measured winds on Martian mesospheric clouds based on the stereo capabilities of HRSC (High Resolution Stereo Camera) onboard Mars Express.
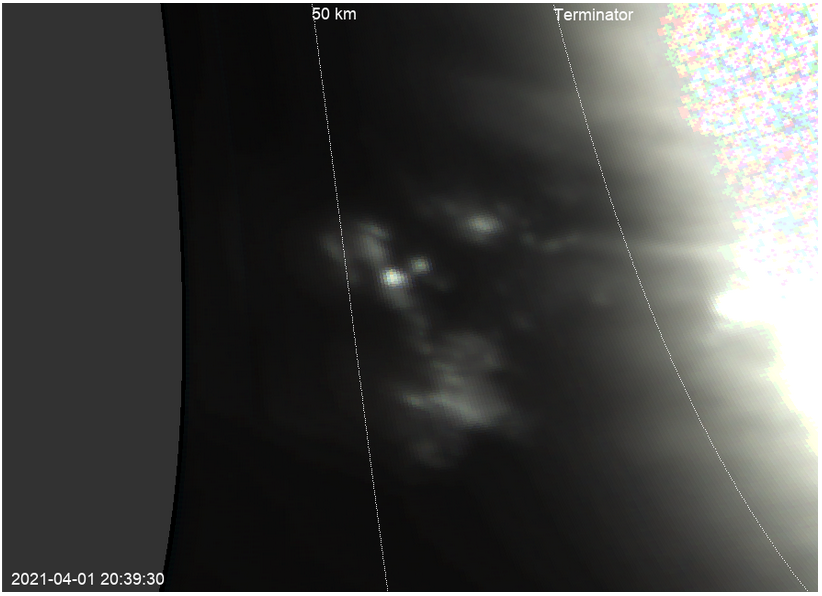
Figure 3. An example of clouds seen in twilight by VMC. This is a projected image that is part of a long observation from which a video was made. White curves indicate the terminator, and the limit where clouds below 50km cannot receive the illumination of the sun and therefore will not be visible. The accurate altitude of clouds can be estimated from videos showing clouds appearing in the night side of the terminator. An animated version of this image can be found in https://figshare.com/articles/media/Twilight_video_example/19772797
References
Hernández‐Bernal, J., Sánchez‐Lavega, A., del Río‐Gaztelurrutia, T., Ravanis, E., Cardesín‐Moinelo, A., Connour, K., ... & Hauber, E. (2021). An Extremely Elongated Cloud over Arsia Mons Volcano on Mars: I. Life Cycle. Journal of Geophysical Research: Planets, 126(3), e2020JE006517.
Hernández‐Bernal, J., Sánchez‐Lavega, A., del Río‐Gaztelurrutia, T., Hueso, R., Ravanis, E., Cardesín‐Moinelo, A., ... & Titov, D. (2021). A Long‐Term Study of Mars Mesospheric Clouds Seen at Twilight Based on Mars Express VMC Images. Geophysical Research Letters, 48(7), e2020GL092188.
Määttänen, A., Montmessin, F., Gondet, B., Scholten, F., Hoffmann, H., González-Galindo, F., ... & Bertaux, J. L. (2010). Mapping the mesospheric CO2 clouds on Mars: MEx/OMEGA and MEx/HRSC observations and challenges for atmospheric models. Icarus, 209(2), 452-469.
Millour, E., Forget, F., Spiga, A., Navarro, T., Madeleine, J. B., Montabone, L., & Lopez-Valverde, M. A. (2015, September). The Mars climate database (MCD version 5.2). In European Planetary Science Congress (Vol. 10).
How to cite: Hernández-Bernal´, J., Sánchez Lavega, A., del Río Gaztelurrutia, T., Hueso Alonso, R., and Cardesín Moinelo, A.: Cloud tracking and dynamics of Martian mesospheric clouds in twilight as seen by MEX/VMC, Europlanet Science Congress 2022, Granada, Spain, 18–23 Sep 2022, EPSC2022-456, https://doi.org/10.5194/epsc2022-456, 2022.
Please decide on your access
Please use the buttons below to download the presentation materials or to visit the external website where the presentation is linked. Regarding the external link, please note that Copernicus Meetings cannot accept any liability for the content and the website you will visit.
Forward to presentation link
You are going to open an external link to the presentation as indicated by the authors. Copernicus Meetings cannot accept any liability for the content and the website you will visit.
We are sorry, but presentations are only available for users who registered for the conference. Thank you.
Please decide on your access
Please use the buttons below to download the presentation materials or to visit the external website where the presentation is linked. Regarding the external link, please note that Copernicus Meetings cannot accept any liability for the content and the website you will visit.
Forward to session asset
You are going to open an external link to the asset as indicated by the session. Copernicus Meetings cannot accept any liability for the content and the website you will visit.
We are sorry, but presentations are only available for users who registered for the conference. Thank you.