SB3 | Small Body Surfaces: Windows into Geological Space and Time

SB3

Small Body Surfaces: Windows into Geological Space and Time
Convener: Tanja Michalik | Co-conveners: Katharina Otto, Rutu Parekh, Ottaviano Ruesch
Orals
| Wed, 11 Sep, 08:30–10:00 (CEST)|Room Jupiter (Hörsaal A)
Posters
| Attendance Wed, 11 Sep, 14:30–16:00 (CEST) | Display Wed, 11 Sep, 08:30–19:00|Poster area Level 1 – Intermezzo
Orals |
Wed, 08:30
Wed, 14:30
Small body surfaces give us meaningful insights into past and possibly present processes. They tell tales about a body’s origin, space environment, impact events, and even subsurface materials that loom onto the surface occasionally. Recent space missions to asteroids and comets have enabled the observation of the surfaces of small bodies with a variety of instruments including high-resolution and multispectral cameras as well as thermal emission spectrometers, x-ray spectrometers, laser altimeters, magnetometers, radiometers, and others.

By analyzing and interpreting these datasets in terms of small body surface geology, geomorphology, composition, and other physical parameters, we can learn about the development of their regoliths and the nature of their (sub-)surface materials, such as volatile contents or internal structure. Impact cratering, mass wasting, volatile outgassing, and other events can transport subsurface materials onto the surface and enable us to indirectly access subsurface materials and conditions.

This session invites presentations of small body surface-related research, including but not limited to geological and geomorphological observations, spectral analyses, mappings, models as well as statistics and their combined interpretations. We furthermore support comparative analyses between planet or moon surfaces and small body surfaces. Welcome are both data of past and ongoing space missions.

Session assets

Discussion on Discord

Orals: Wed, 11 Sep | Room Jupiter (Hörsaal A)

Chairpersons: Tanja Michalik, Katharina Otto
08:30–08:40
|
EPSC2024-577
|
Virtual presentation
Valeriia Rychahova, Ivan Slyusarev, Vadym Kaydash, and Irina Belskaya

Introduction

Asteroid (4) Vesta is a unique object among small solar system bodies: the second largest body in the main belt, a probable remnant protoplanet from the earliest epoch of the solar system formation [3], parent body of the large asteroid family and main reservoir of HED-material. Global albedo mosaic obtained by Dawn’s Framing Camera confirmed ground-based obvservation facts about heterogenity of vestan surface material. Among all areas with unusual spectral behavior stands out a pattern which was previously described in [2] and [1] as an orange material due to conformity of this deposits to the orange tones on the global false-color Clementine mosaics. Analysis provided in previous studies forced the authors ([2], [1]) to assume a connection of patches with the melts ejected during the formation of Rheasilvia. In this work, a detailed analysis of the all orange material areas (except regions near Claudia and Rubria craters) found in the ([2], [1]) was carried out using color-ratio imagery as applied to data obtained by Dawn spacecraft onboard instrument Framing Camera (FC).

Methods

We use color-ratio imagery method to analyze images obtained by Dawn spacecraft onboard instrument Framing Camera (FC) during HAMO orbital phase (spatial resolution ~70 m/pixel) in all color filters (F2-F8). For deriving color ratio maps in this study, we used Level 1b calibrated images available in free access as a part of Planetary Data System archive (https://sbn.psi.edu/pds/sbib/). We selected images of areas that demonstrate presence of orange material patches according to LeCorre et al. (2013). As the refferent color-ratio maps we used C(438nm/917nm) for spectral slope characterization and C(749nm/917nm) for estimation of the pyroxene band depth. Remaining color-ratio maps give an additional information which helps to interpretate spectral behavior of selected areas more accurate.

Results

Almost all spots within studied areas demonstrate similar spectral behavior. The pacthes of the orange material tend to have stronger absorption at 438 nm. Outside this area, the orange patches are practically indistinguishable from the typical vestan surface material. Patches also have deeper pyroxene band at 0.9 nm and higher albedo than surroundings. In fact, color ratio C(438nm/749nm) distribution maps demonstrate that the population of orange material spots is diverse in terms of shapes and sizes as well as sharpness of spots’ edges (Fig.1). Additionally, several spots, previously classified as orange material [2], show quite distinct spectral characteristics to traditional. Our results seem to contradict with impact melt hypothesis of orange material origin.

Fig. 1 – Oppia crater (8° S, 309° E, D=37km) and surroundings. Color ratio C(438nm/749nm) (a) and C(749nm/917nm) (b) maps.

References

[1] Garry, W. B., Williams, D. A., Aileen Yingst, R. et al., 2014. Icarus 244, 104–119

[2] Le Corre L., Reddy V., Schmedemann N. et al. 2013. Icarus 226, 1568–1594

[3] Russell C. T. and Raymond C. A. 2011. Space Sci. Rev. 163, 3-23


How to cite: Rychahova, V., Slyusarev, I., Kaydash, V., and Belskaya, I.: Non-homogeneous population of orange material patches on Vesta, Europlanet Science Congress 2024, Berlin, Germany, 8–13 Sep 2024, EPSC2024-577, https://doi.org/10.5194/epsc2024-577, 2024.

08:40–08:50
|
EPSC2024-379
|
On-site presentation
Stefan Schröder, Norbert Schörghofer, Erwan Mazarico, and Uri Carsenty

Permanently shadowed regions (PSR) on the Moon and Mercury are thought to harbor volatiles such as water ice (Arnold 1979; Slade et al. 1992; Feldman et al. 2001; Lawrence 2017). PSRs have also been identified in the polar regions of dwarf planet Ceres (Schorghofer et al. 2016). A handful of Ceres PSRs contain bright deposits (Platz et al. 2016). Ceres' obliquity varies between 2.0° and 19.5° with a period of roughly 20 kyr, and the extent of individual PSRs changes accordingly (Ermakov et al. 2017). Only the most persistent PSRs contain bright deposits, which suggests that bright deposits in PSRs harbor volatiles accumulated in cold traps, most likely water ice (Schorghofer et al. 2024). Nevertheless, bright deposits on Ceres typically have a salty composition (e.g., de Sanctis et al. 2016).

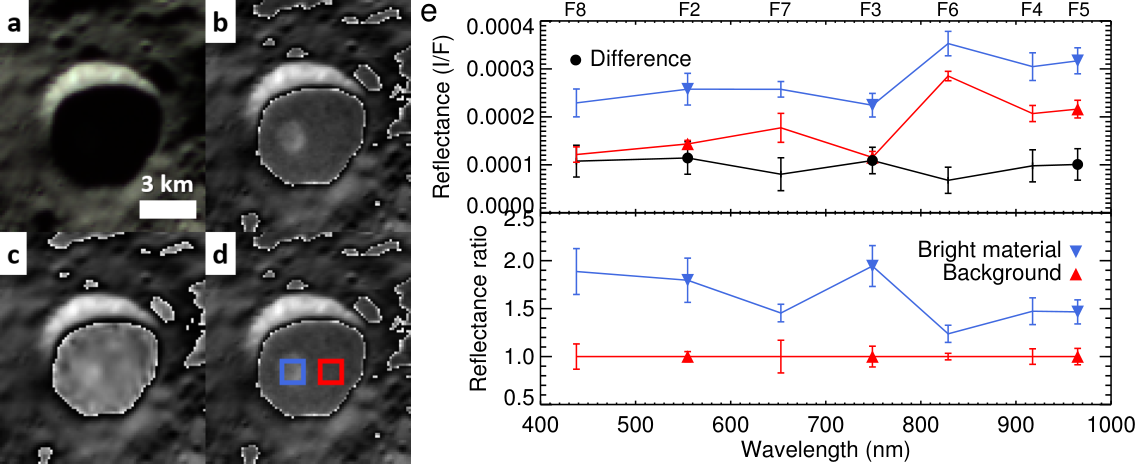
We determine the spectral properties of bright deposits on the shadowed floor of craters in map-projected, narrow-band images of the Dawn framing camera (FC) to find direct evidence for water ice. The spectrum of water ice generally has a negative (blue) slope in the visible range, with steeper slopes for larger particle sizes (e.g., Clark 1981, Raponi et al. 2016). Thus, we are looking for the tell-tale sign of a negative spectral slope. Analyzing the low reflectance values in shadowed craters requires special care because FC narrow-band images were degraded by substantial in-field stray light (Sierks et al. 2011, Schröder et al. 2014). In addition, the images used in our analysis were compressed with a lossy algorithm prior to transmission, which may lead to visible artifacts depending on the compression ratio and the image content. We corrected the images in our analysis for stray light and carefully assessed the image quality with respect to compression artifacts.

The bright deposit in the permanently shadowed Bilwis crater is shown in Fig. 1. The reflectance of this deposit is so low that artifacts associated with high compression ratios are expected to be significant. Also, residual stray light may contribute significantly to the reflectance, in which case the difference between the spectra of the deposit and background terrain may be more representative for the bright material than the ratio of these spectra. The difference spectrum of bright deposit and background terrain has a neutral spectral slope for the reliable bands (low compression ratio). If we include the less reliable bands (high compression ratio) into consideration, the spectral slope is still neutral. The ratio spectrum for the reliable bands seems to have a spectral slope that is not significantly different from neutral. If we include the less reliable bands into consideration, the spectral slope appears to be negative, although the scatter in the data is considerable. In short, the spectral slope of the bright deposit appears to be neutral, with weak evidence for a negative (blue) slope.

Fig. 1. Bright deposit in Bilwis crater. (a) Color composite with (R, G, B) = (F5, F2, F8). (b) F2 image (low compression ratio) with the contrast enhanced in shadowed areas, revealing the bright deposit. (c) F6 image (high compression ratio) with the contrast enhanced in shadowed areas, uncovering compression artifacts. (d) F2 image in (b) with the sampled areas outlined. Outline colors correspond to the curves in (e). (e) Spectra associated with the areas indicated in (d). Data points with a symbol derive from images with a low compression ratio and are therefore more reliable. Top: Bright material and background spectra and their difference. Bottom: Bright material and background spectra divided by the background spectrum.

We performed this analysis for several bright deposits in PSRs. While some clearly show the spectral signature for water ice (negative spectral slope), for others the evidence is only marginal. However, the fact that all deposits have negative spectral trends leads us to conclude that, in general, bright deposits in PSRs exhibit a negative spectral slope. On Ceres, material with a negative spectral slope is commonly found in young terrain, but it is not bright (Schmedemann et al. 2016, Schröder et al. 2017). On the other hand, typical bright terrains on Ceres are salt deposits, which feature a spectral slope ranging from neutral to positive (de Sanctis et al. 2016, Schröder et al. 2017). Therefore, the bright deposits in the PSRs are unlikely to be salts and our work constitutes a direct detection of water ice in the bright deposits in Ceres PSRs.

References:
Arnold, J. R. 1979, J. Geophys. Res., 84, 5659
Clark, R. N. 1981, J. Geophys. Res., 86, 3087
Ermakov, A. I., Mazarico, E., Schröder, S. E., et al. 2017, Geophys. Res. Lett., 44, 2652
Feldman, W. C., Maurice, S., Lawrence, D. J., et al. 2001, J. Geophys. Res., 106, 23231
Lawrence, D. J. 2017, Journal of Geophysical Research (Planets), 122, 21
Platz, T., Nathues, A., Schorghofer, N., et al. 2016, Nature Astronomy, 1, 0007
Raponi, A., Ciarniello, M., Capaccioni, F., et al. 2016, MNRAS, 462, S476
de Sanctis, M. C., Raponi, A., Ammannito, E., et al. 2016, Nature, 536, 54
Schmedemann, N., Kneissl, T., Neesemann, A., et al. 2016, Geophys. Res. Lett., 43, 11,987
Schorghofer, N., Mazarico, E., Platz, T., et al. 2016, Geophys. Res. Lett., 43, 6783
Schorghofer, N., Gaskell, R., Mazarico, E., & Weirich, J. 2024, Planet. Sci. J., 5, 99
Schröder, S. E., Mottola, S., Matz, K. D., & Roatsch, T. 2014, Icarus, 234, 99
Schröder, S. E., Mottola, S., Carsenty, U., et al. 2017, Icarus, 288, 201
Sierks, H., Keller, H. U., Jaumann, R., et al. 2011, Space Sci. Rev., 163, 263
Slade, M. A., Butler, B. J., & Muhleman, D. O. 1992, Science, 258, 635

How to cite: Schröder, S., Schörghofer, N., Mazarico, E., and Carsenty, U.: Spectral properties of bright deposits in permanently shadowed craters on Ceres, Europlanet Science Congress 2024, Berlin, Germany, 8–13 Sep 2024, EPSC2024-379, https://doi.org/10.5194/epsc2024-379, 2024.

08:50–09:00
|
EPSC2024-418
|
On-site presentation
Charlotte Herrmann and Jean-Baptiste Vincent

Introduction

Surface roughness is an important parameter used to characterize the surface of small bodies, such as asteroids and comets. Roughness measures the variability of the topography with respect to a scale of reference.

At small distances, roughness indicates physical properties of the regolith and plays a major role in interpreting data returned by imaging and thermal instruments. At mid-scale, roughness is used to identify regions of interest that may be the signature of evolutionary processes. On a global scale, roughness may hold clues to the interior structure of the asteroid.

Thanks to many space missions in the last decade, we have access to a large amount of data from various small bodies. So far, there is no comprehensive study putting together all this knowledge which will be beneficial for upcoming missions.

Small bodies of interest are the asteroids Eros, Itokawa, Bennu, Ryugu and the binary system of Didymos and Dimorphos. Previous studies focused on roughness using root mean square (RMS) deviations with different baselines: 4-200 m for Eros [1], 8-32 m Itokawa [2], 1-40 m Bennu [3], 8-60 m Ryugu [4]. Additional investigations concerned low-degree spherical harmonics and crater measurements on Bennu [5], and ejecta models for Ryugu [6].


Methodology

Roughness is typically measured as the variability (often the root mean square) of the distance between the asteroid surface and an arbitrary baseline, for a given spatial scale.

As there is no standard approach in choosing this baseline, we find that published values are often measured at different scales, and using different definitions of the reference baseline, which makes a comparative study quite challenging.

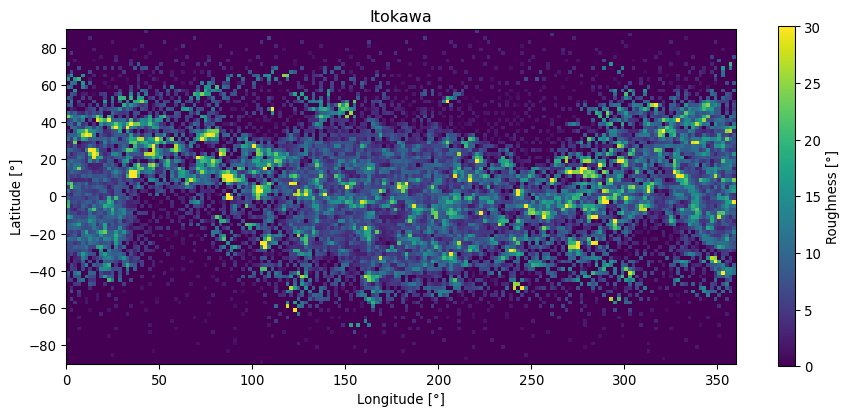
Here, we propose a unified method which defines the roughness independently from any arbitrary reference, by (1) measuring the angular variability of surface orientation on the shape models, and (2) using techniques from signal processing theory (i.e. entropy of information) that allow for a robust assessment of surface roughness from images against a wide range of photometric conditions. Al techniques are described in [7].

In this work, we investigate the roughness of 6 Near Earth Asteroids (Eros, Itokawa, Bennu, Ryugu, Didymos, Dimorphos), and perform a statistical comparison of the measured values against several parameters that relate to the asteroid state and evolution (gravity, rotation period, mass, density, composition, age).


Results

From this comparative study we will present an overview of the similarities and differences between the surfaces of these Near-Earth Objects, and propose statistical roughness scaling laws that describe the variability of the topography on asteroid surfaces. We will discuss the connection between surface roughness and evolutionary processes, in light of these new measurements, and how our work supports upcoming missions like ESA’s Hera, scheduled for launch in October 2024.


Fig. 1: Example of data product generated during our study. Map of the mean angular roughness (°) at 5 m resolution on asteroid Itokawa. The equatorial region shows higher roughness than the poles which appear to be smoother. Although the map might be slightly distorted due to Itokawa’s shape, the roughness map agrees with the different terrains which can be seen in Fig.2.


Fig. 2: Image of Itokawa with smoother and rougher regions (Credits: JAXA [8]).


References

[1] H. C. M. Susorney, O. S. Barnouin (2018). The global surface roughness of 433 Eros from the NEAR laser rangefinder. Icarus, Volume 314, p. 299-310, ISSN 0019-1035, https://doi.org/10.1016/j.icarus.2018.05.013.

[2] H. C. M. Susorney et al. (2019). The global surface roughness of 25143 Itokawa. Icarus, Volume 325, p. 141-152, ISSN 0019-1035, https://doi.org/10.1016/j.icarus.2019.01.021.

[3] H. C. M. Susorney et al. (2019). The meter-scale surface roughness of Bennu from the OSIRIS-REx mission. EPSC-DPS Joint Meeting, Switzerland, id. EPSC-DPS2019-115.

[4] Y. Masuda et al. (2020). The surface roughness of 162173 Ryugu based on the topography from Hayabusa2 Laser Altimeter (LIDAR). 51st Lunar and Planetary Science Conference, Texas, LPI Contribution No. 2326, id.2181.

[5] O. S. Barnouin et al. (2019). Shape of (101955) Bennu indicative of a rubble pile with internal stiffness. Nat. Geosci. 12, p. 247–252, https://doi.org/10.1038/s41561-019-0330-x.

[6] N. Hirata et al. (2021). Rotational effect as the possible cause of the east-west asymmetric crater rims on Ryugu observed by LIDAR data. Icarus, Volume 354, 114073, ISSN 0019-1035, https://doi.org/10.1016/j.icarus.2020.114073.

[7] JB. Vincent et al. (2023). Macro-Scale Roughness and Morphological Units on Didymos and Dimorphos. Asteroid, Comets, Meteors conference, LPI Contribution No. 2851, 2023, id. 2259.

[8] J. Saito et al. (2006). Detailed Images of Asteroid 25143 Itokawa from Hayabusa. Science, Volume 312, Issue 5778, pp. 1341-1344, DOI: 10.1126/science.1125.

How to cite: Herrmann, C. and Vincent, J.-B.: Comparative study of surface roughness on Near-Earth Asteroids, Europlanet Science Congress 2024, Berlin, Germany, 8–13 Sep 2024, EPSC2024-418, https://doi.org/10.5194/epsc2024-418, 2024.

09:00–09:10
|
EPSC2024-821
|
ECP
|
On-site presentation
Eric MacLennan and Anne Virkki

The thermal inertia and roughness are two parameters that are included in thermophysical models (TPMs) in order to interpret the infrared emission of asteroid surfaces. These parameters depend on the size of particles and degree of roughness for size scales larger than the thermal skin depth, which is typically on the order of a few centimeters (Delbo et al., 2015). For example, large decimeter-sized boulders have elevated thermal inertia values and increase the overall degree of roughness. On the other hand, particles that are smaller than the thermal skin depth act to lower the estimated thermal inertia, but are less influential to the overall surface roughness. Several studies have focused on the interpretation of only the thermal inertia from both disk-resolved and disk-integrated thermal infrared observations. In principle, accurate estimates of both these parameters can be used to develop a heuristic tool for estimating the abundance of boulders on an asteroid surface (or any other airless body).

Our primary goal is to develop a consistent framework for which to compare roughness scales as constrained by different wavelength regimes: micron scale from light scattering (e.g. Zubko et al., 2007), centimeter scale from thermal infrared, and decimeter scale from active radar sensing (Virkki et al. 2022).  The degree of roughness for visible and radar observations is determined by scattering behavior at the scale of the wavelength, whereas the roughness constrained by thermal infrared emission is affected by deviations in surface temperature from a smooth surface. These temperature deviations are caused by topographical features larger than the skin depth. In practice, TPMs calculate the temperature distribution for terrains which incorporate the effects of scattered light, shadowing of roughness elements, and self-heating (thermal emission from one roughness element that is re-absorbed by another). Model terrains for representing roughness include, for example, spherical section craters and self-affine (fractal) surfaces.

The symmetry of a spherical crater geometry lends to computational efficiency in TPMs, yet may not be an ideal physical or geological representation of asteroid surface roughness. Yet, hemispherical craters have been successfully employed to fit the disk-resolved surface emission of Bennu (Rozitis et al. 2020), whereas a random Gaussian surface has been used to model lunar emission (Bandfield et al. 2013). These terrains are often characterized by the root mean squared (RMS) of their surface slopes, even though their surface slope distributions may differ in some ways. In these studies of Bennu and the Moon, the best-fit thermal roughness was reported as RMS of 40o and 20 — 35o, respectively. However, it is not trivial to compare the results of these two distinct roughness implementations, or when the thermal skin depths are somewhat different (1 – 5 cm for Bennu and 6 cm for the Moon). A study of the roughness of Eros showed a higher degree of roughness at the scale of the thermal skin depth compared to the extrapolated roughness at larger spatial scales (Rozitis, 2016). Finally, radar observations show that surface roughness differs among spectral classes (Benner et al. 2008; Virkki et al., 2022).

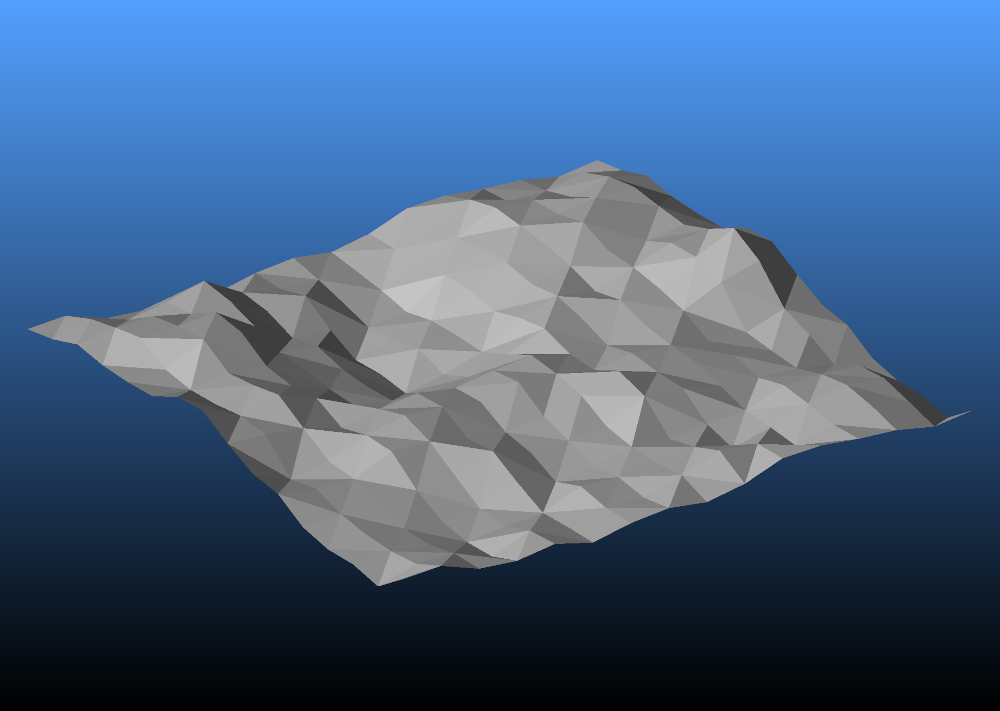
In our study, we compare the thermal emission profiles of spherical craters and randomly-generated fractal surfaces (Virkki, 2024) in order to investigate the effects of increasing thermal infrared roughness for craters and fractal surfaces. A one-dimensional heat diffusion model is used to calculate temperatures for craters and fractal surfaces with differing surface slopes. The craters are described by their opening angle (90o being the largest for hemispherical craters), and the fractal terrains are characterized by Hurst exponent and RMS height of the surface (Figure 1; Figure 2). Multiple scattering and self-heating effects are implemented using the so-called view factors; defined as the fraction of energy leaving one roughness element that reaches another. The edges of the fractal surface are determined such that a periodic boundary condition can be implemented to simulate an infinite surface. In this way, energy can be exchanged between elements on opposite edges of the mesh.

One intriguing difference between these two roughness terrains is the degree of shadowing and self-heating in response to changes in the surface slope distribution. The view factor for every crater element is identical, whereas the view factors for a rough fractal surface are unique for each elements and thus follow some distribution. Furthermore, the effects of shadowing of roughness elements at large incident angles can have different effects between the two terrains, even if the surface slope distributions (or RMS slopes) are similar. The variations in the thermal emission profgiles of these two models have important implications for the interpretation of both disk-resolved and disk-integrated thermal infrared datasets. Given that the thermal skin depth is dependent on the rotation period, it can differ from one asteroid to the next and create challenges when comparing disk-integrated roughness values among the asteroid population.

Figure 1. A fractal surface with H = 0.5 and rms height = 0.4.

Figure 2. Surface slope distribution for the surface in Figure 1.

References:

Bandfield, J., et al., 2015. Icarus 248, 357–372.

Benner, L.,  et al., 2008. Icarus 198, 294–304.

Delbo, M., et al., 2015. In Asteroids IV.

Rozitis, B., et al. 2016. Monthly Notices of the Royal Astronomical Society 464, 1.

Rozitis, B.,  et al. 2020. Science Advances 6, eabc3699.

Virkki, A., et al. 2022. The Planetary Science Journal, 3:222, 36 pp.

Virkki, A. 2024. Remote Sensing 2024, 16, 890.

Zubko, E., et al. 2007. Journal of Quantitative Spectroscopy & Radiative Transfer 106, 604–615.

How to cite: MacLennan, E. and Virkki, A.: Thermal Emission Modeling of Rough Surfaces for Comparison to Radar Observations, Europlanet Science Congress 2024, Berlin, Germany, 8–13 Sep 2024, EPSC2024-821, https://doi.org/10.5194/epsc2024-821, 2024.

09:10–09:15
09:15–09:25
|
EPSC2024-963
|
On-site presentation
Frank Preusker, Stefano Mottola, Klaus-Dieter Matz, Harold Levison, Simone Marchi, Keith Noll, and John Spencer

Introduction: In October 2021, the Lucy space probe launched its mission to explore a series of Jupiter Trojans. Close flybys will be used to investigate and determine the shape, diversity, surface composition and geology of the objects [1]. On November 1, 2023, Lucy reached the recently-added target, asteroid (152830) Dinkinesh at closest distance of approximately 430 kilometers.

Data set: The Lucy space probe is equipped with the two different types of framing cameras, the Lucy Long Range Reconnaissance Imager (L'LORRI) [2] and the Terminal Tracking CAMera pair (TTCAM) [3], which are mounted on a pivoting platform (Instrument Pointing Platform, IPP). Depending on the distance between the spacecraft and the object, either the wide-angle TTCAMs or the narrow-angle L'LORRI are used. Therefore, only L'LORRI images were used for the reconstruction of the surface of Dinkinesh. A total of 194 L'LORRI images were selected, covering a period between ±40 minutes to the closest approach (at 16:54:40 UTC) and having a best ground sampling distance of 2.1-8.4 meters. For these images, the image resolution was increased using a disk-deconvolution algorithm [4] that takes the point spread function into account.

Methods: The stereo-photogrammetric processing for Dinkinesh is based on a software suite that has been developed during the last decade. It has been applied successfully to several planetary image data sets [5-9]. It covers the classical workflow from photogrammetric block adjustment to digital terrain model (DTM) or surface model, and map generation. For classic missions in which the object is examined from orbit, the methods listed above are completely sufficient. For fly-by missions, however, it is absolutely necessary to combine these with "shape from silhouette". This allows the reduction of systematic pointing errors to a minimum by fitting the line of sight of the camera to body center and the reconstruction of surface areas (limbs), which cannot be determined by classical photogrammetric analysis.

Results: First, we pre-adjusted the orientation of all 194 images from the closest approach phase by fitting the line of sight of each image to the center of Dinkinesh's standard sphere (mean radius of about 360 m). Then all images with a ground sampling distance better than 5 m/pixel were selected for stereo-photogrammetric processing. For these 45 selected images, we constrained stereo requirements to identify independent stereo image combinations.

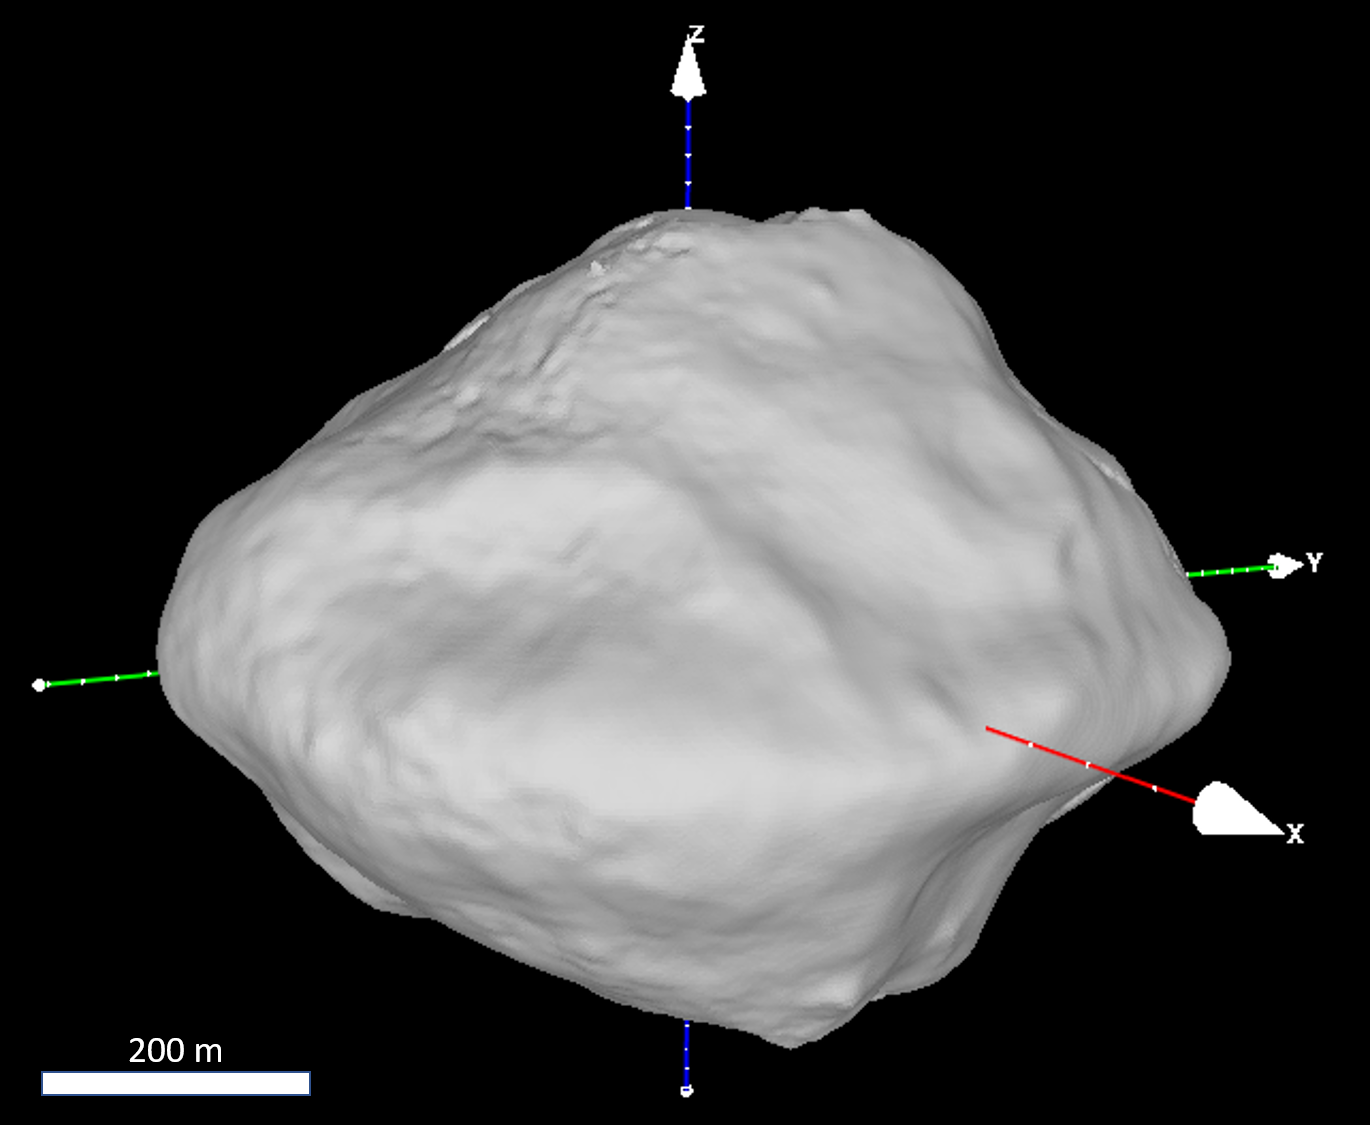
From these 94 stereo image combinations we applied a sparse multi-image matching to set-up of a 3D control network of about 3,000 surface points. The control point network defines the input for the photogrammetric least square adjustment where final corrections for the image orientation data are derived. The three-dimensional one sigma (3D) point accuracy of the resulting ground points has been improved to ±0.7 m. Furthermore, the control point network has been used to determine Dinkinesh’ spin axis orientation to an accuracy of ±0.5°. Together with the rotation rate, which was determined from light curve measurements of images from the departure phase, a pre-coordinate system was defined [10]. Finally, dense image matchings were carried out to yield about 5.4 million object points. From these object points, we have generated a stereo derived shape model with a lateral spacing of 2.1 m/pixel (3 pixel/degree) and a vertical accuracy of about 0.5 m. The stereo derived shape model covers approximately 45 percent of Dinkinesh’ surface. With this stereo derived surface model as a replacement for the standard sphere in the first step, the pre-orientation of the complete image data set was repeated. In addition, the image coordinates of the limb were determined for each image using the contrast transition from the surface to the space background and converted into object coordinates. Finally, the stereo derived object points have been combined with the limb derived object points to generate the final surface model, which yields an increase in surface coverage to approximately 60 percent (Figure 1).

Outlook: A final version of the Dinkinesh global shape model an overall re-assessment of Dinkinesh’s geophysical properties can be expected from the analysis of the entire L’LORRI image dataset of Dinkinesh and will be published soon [10]. Furthermore, derived data products such as a monochrome global base map and a global albedo map will be presented at the time of the conference.

Acknowledgments: The Lucy mission is funded through the NASA Discovery program on contract No. NNM16AA08C.

References: [1] Levison H.F. et al., (2021), Planet. Sci. J., 2, 5, 171. [2] Weaver H.A. et al., (2023), Space Sci. Rev., 219, 82. [3] Bell J.F. et al, (2023), Space Sci. Rev., 219, 86. [4] Robbins et al., (2023), Planet. Sci. J., 4, 234. [5] Preusker F. et al., (2017), A&A, 607, L1. [6] Preusker F. et al., (2015), A&A, 583, A33. [7] Preusker F. et al., (2019), A&A, 632, L4. [8] Gwinner K. et al., (2009), Photogrammetric Engineering Remote Sensing, 75, 1127–1142. [9] Scholten F. et al., (2012), JGR, Vol. 117. [10] Levison H.F. et al., (2024), Nature, in preparation


Figure 1. 3D view of asteroid (152830) Dinkinesh’s global surface model


How to cite: Preusker, F., Mottola, S., Matz, K.-D., Levison, H., Marchi, S., Noll, K., and Spencer, J.: Shape model of asteroid (152830) Dinkinesh from LUCY imagery, Europlanet Science Congress 2024, Berlin, Germany, 8–13 Sep 2024, EPSC2024-963, https://doi.org/10.5194/epsc2024-963, 2024.

09:25–09:35
|
EPSC2024-1066
|
On-site presentation
Christophe Matonti, Sophie Viseur, Laurent Jorda, and Olivier Groussin

          Cometary nuclei belong to the solar system small bodies, hence they are characterized by non-spherical shapes and sizes ranging from a few to one hundred kilometers. They formed during the early phase of the solar system history, making them and interesting target to better understand physicochemical and dynamical conditions of its infancy, around 4.5 Gyrs. They are predominantly composed of different ices (H20, CO, CO2, N2), silica dust and organic molecules (Groussin et al., 2019). This ice-rich composition is the cause of their long-known erosion process controlled by ice sublimation at the surface of the nucleus. However, it has been shown in the last few years that geological processes such as “tectonic” shear deformation represents another driving force for nuclei erosion and long-term evolution through mechanical weakening (Matonti et al., 2019). Torque stress at the neck of bilobate comets generates the formation of a dense, interconnected fault network which enhances the cometary material breakdown. This ultimately lead to loss of mass through cliff collapse (Pajola et al., 2017), enhanced sublimation of loose blocks, or even ejection of meter-scale blocks from the surface.

The Rosetta mission, which orbited for 2 years the nucleus of comet 67P/Churyumov–Gerasimenko acquired thousands of images of its surface, with an unprecedented spatial resolution, down to 20 cm/pixel (Keller et al., 2007), revealing its bilobate nature and allowing to perform detailed geological interpretations of its surface features (e.g. Sunshine et al., 2016; Matonti et al., 2019).


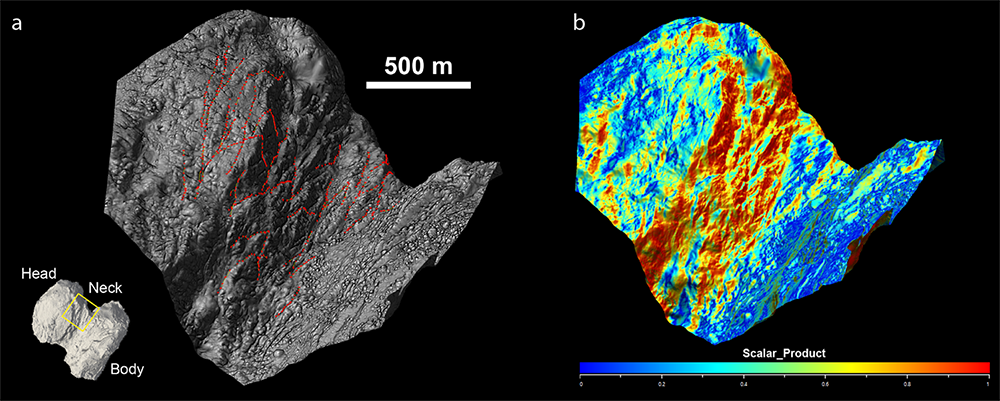
Figure-1: A: DTM surface from the 3D shape model spc_shap8-V2.1, displaying the surface minimum curvature in grayscale. In red, examples of digitalized fault lineaments traced directly on the polygonal surface. The yellow box shows the location of the displayed DTM surface. B: DTM surface displaying in colors the scalar product between normal vectors of the DTM triangles and the faults reference patch of one of the fault sets.


Using high resolution (down meter scale precision) DTM and high resolution images, we constructed a 3D model of faults existing at depth in the neck of 67P. This model is constrained at the surface by 3D hard data, consisting of digitalized polylines of faults lineaments traced directly upon the DTM surface (Jorda et al., 2016; Fig. 1a), hence integrating 3D/depth information. Before tracing, the visualization of faults lineaments has been greatly enhanced by computing and displaying the surface principal curvatures, especially the minimum curvature, on the whole DTM surface (grayscale in Fig. 1a).

A second source of hard data is the cliff faces bounding the neck regions. They represent the remains of fault planes in the nucleus material, partially eroded along the fault network (Matonti et al., 2019). Reference patches have been selected along those cliff faces, being representative of the 2 fault sets’ strike and dip. Then, the scalar product has been computed between the normal vector of these patches and the normal vector of each triangle of the 67P DTM. This attribute allows a better visualization of the cliff surfaces related to fault planes (Fig. 1b) and also for selecting fault patches using a cosine threshold (0.95, ~20° tolerance angle). Using these polylines and planes, interpolation of the Gocad-Skua geomodeller is used to build the 3D model of the most statistically robust faults in the region of the neck, where they widely crop-out. A statistical analysis of the geometry of the modelled planes is then performed to extract the strike and dip angle distributions of the faults and is used to model the network at depth. A stochastic approach will be investigated to extrapolate the fault network below the surface in order to account for uncertainties. The simulations are conditioned to the previous deterministic 3D model of fracture/fault networks, and input parameters will be obtained from the statistical analysis.

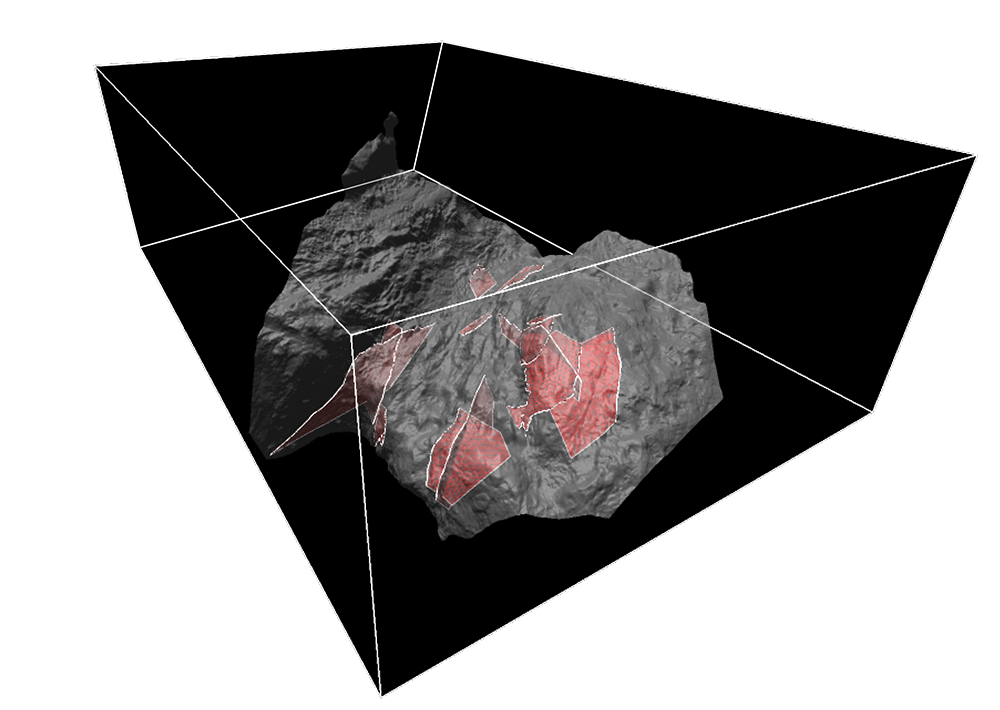
Preliminary results on our model show that faults are organized in 2 sets displaying 2 distinct directions and dip angles (Fig. 2), dependent on the local gravity vector, and that the fault network propagates below the surface, down to 100’s of meters. This study allows for the first time the representation of quantitative geometrical data on the internal structure of a comet nucleus. In future works, this model will help us to quantitatively estimate the impact of shear deformation on the erosion rate of 67P, thus its evolution on long time scales.

Figure-2: Preliminary 3D-model of the fault network showing the fault planes (in red) below the semi-transparent DTM surface.


Acknowledgements: The authors would like to thank Aspentech Software for providing SKUA-GOCAD licenses in the scope of the Research University Grant Program.

References:

Groussin, O., Attree, N., Brouet, Y. et al. The Thermal, Mechanical, Structural, and Dielectric Properties of Cometary Nuclei After Rosetta. Space Sci Rev 215, 29 (2019). https://doi.org/10.1007/s11214-019-0594-x

Jorda, L., R. Gaskell, C. Capanna, S. Hviid, P. Lamy, J. Ďurech, G. Faury, O. Groussin, P. Gutiérrez, C. Jackman, S. J. Keihm, H. U. Keller, J. Knollenberg, E. Kührt, S. Marchi, S. Mottola, E. Palmer, F. P. Schloerb, H. Sierks, J. B. Vincent, M. F. A’Hearn, C. Barbieri, R. Rodrigo, D. Koschny, H. Rickman, M. A. Barucci, J. L. Bertaux, I. Bertini, G. Cremonese, V. Da Deppo, B. Davidsson, S. Debei, M. De Cecco, S. Fornasier, M. Fulle, C. Güttler, W. H. Ip, J. R. Kramm, M. Küppers, L. M. Lara, M. Lazzarin, J. J. Lopez Moreno, F. Marzari, G. Naletto, N. Oklay, N. Thomas, C. Tubiana and K. P. Wenzel (2016). "The global shape, density and rotation of Comet 67P/Churyumov-Gerasimenko from preperihelion Rosetta/OSIRIS observations." Icarus 277: 257-278.

Keller, H.U., Barbieri, C., Lamy, P. et al. OSIRIS – The Scientific Camera System Onboard Rosetta. Space Sci Rev 128, 433–506 (2007).

Matonti, C., Attree, N., Groussin, O. et al. Bilobate comet morphology and internal structure controlled by shear deformation. Nat.Geosci. 12, 157–162 (2019). https://doi.org/10.1038/s41561-019-0307-9

Pajola, M., Höfner, S., Vincent, J. Et Al. The pristine interior of comet 67P revealed by the combined Aswan outburst and cliff collapse. Nat Astron 1, 0092 (2017).

Sunshine, J. M., Thomas, N., El-Maarry, M. R. & Farnham, T. L. Evidence for geologic processes on comets. Journal of Geophysical Research-Planets 121, 2194-2210,(2016).


How to cite: Matonti, C., Viseur, S., Jorda, L., and Groussin, O.: 3D modelling of the fault network in the interior of 67P, Europlanet Science Congress 2024, Berlin, Germany, 8–13 Sep 2024, EPSC2024-1066, https://doi.org/10.5194/epsc2024-1066, 2024.

09:35–09:45
|
EPSC2024-292
|
ECP
|
On-site presentation
Markus Patzek, Ottaviano Rüsch, Jamie L. Molaro, and Bastian Gundlach

Introduction:
The surface of planetary bodies is constantly altered by a number of different processes including (micro) meteorite impacts leading to effects such as abrasion, shattering, brecciation [1-8], proton bombardment [e.g., 9], and diurnal temperature variations [10,11]. The diurnal temperature variation is resulting in sub-critical crack growth due to mineral and rock heterogeneities. These effects of thermal fatigue related rock breakdown have been recently studied for various aspects (rapid temperature change, crack geometry, and particle ejection [12-15]. This study investigated the crack growth on the surface of various chondrite samples in order to understand the aspect of petrology of different rocks within the context of thermal fatigue-driven rock breakdown due to diurnal temperature variations. Additionally, the experiments were performed under vacuum conditions to eliminate potential effects of atmosphere present in previous experimental studies [10,15], which have been demonstrated to affect heat transfer and cracking behavior.

Methods and Samples:
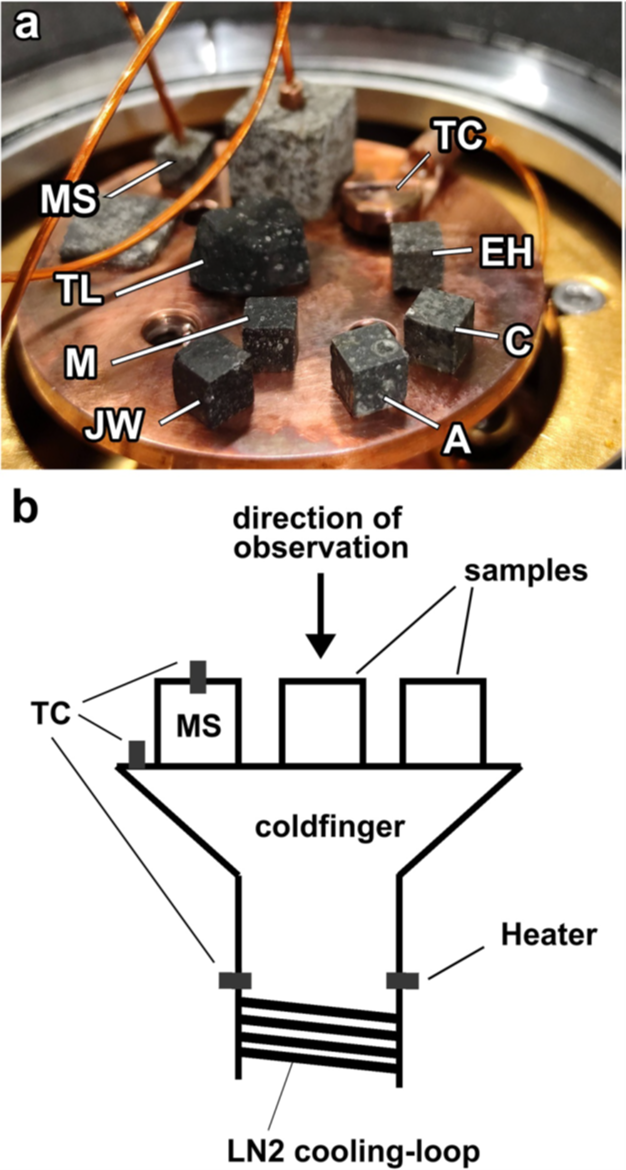
The experiment is based on a LN2-cooled, evacuated (<5x10⁻⁵ mbar) cryostat and a 100W cartridge heater installed in the base of a cold finger (16). Sample cubes, previously investigated by scanning electron microscopy (SEM) with sizes of ~5x5x5 mm³ are placed on the copper cold finger. Temperatures of the whole experiment are measured by thermocouples on different locations in the chamber and on a 5 mm monitored sample. The cold finger setup is illustrated in Fig. 1. The samples are cycled from 175 K to 375 K (cycle length ~200 min) and investigated via SEM after 0, 10, 20, 50, 100, 200 and 400 cycles, respectively. For observation of the top surface (i.e., the opposite side of heating) of the sample cubes, a JEOL 6610-LV scanning electron microscope (SEM) was used to obtain a sample mosaic, derived from back scattered electrons (BSE). The length of cracks on the surface of the sample cubes have been studied opposite to [10] since the detection of those cracks in the µCT scans was not reliable enough.

Fig. 1: (a) Photograph of the cold finger and samples placed on it. (b) Illustration of the cold finger design and viewing geometry. TC=thermocouple; MS=monitored sample; Other abbreviations refer to sample names.

Different samples representative for various asteroids classes have been chosen to study the effect of diurnal temperature variations including aqueously-altered CM2 and C2 chondrites as well as ordinary and CV chondrites: Murchison (CM2), Jbilet Winselwan (CM2), Tagish Lake (C2ung), Allende (CV3), El Hammami (H5), and Chelyabinsk (LL5). From several cubes those matching the experimental criteria (sample geometry and “meteorite group-typical” mineralogy) have been selected for the experiment.

Results:
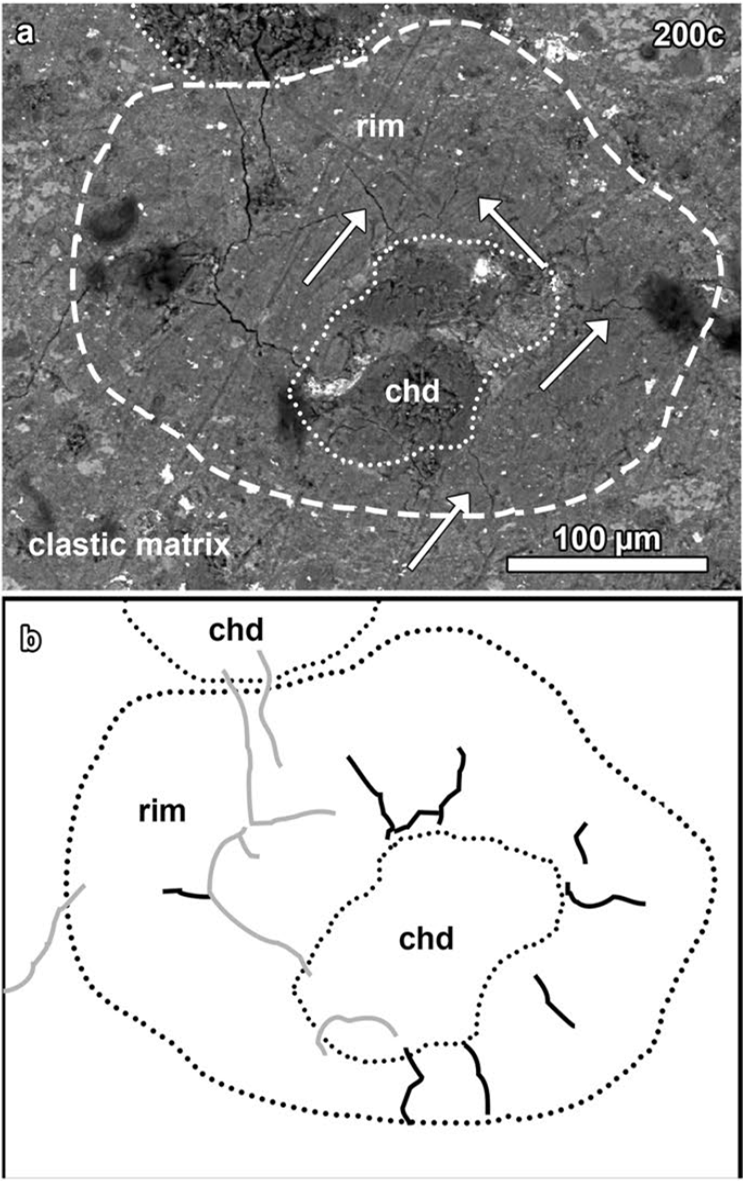
The obtained SEM-BSE images revealed cracks nucleating at different locations and propagating through the sample leading to increases in the crack length and width. Additionally, closing of cracks has also been observed. However, these observations were limited only to aqueously-altered chondrites, which are, Murchison (CM2), Jbilet Winselwan (CM2), and Tagish Lake (C2ung), while no changes were detected for the ordinary and CV chondrite(s). For CM2 chondrites (e.g., Murchison), we observe crack patterns that diverge radially from chondrules into fine-grained rims and further into matrix (e.g., Fig. 2).

Fig. 2: (a) BSE image of a chondrule in Murchison with its fine-grained rim and the clastic matrix surrounding it. (b) Illustration of cracks that were present before cycling (grey) and newly formed cracks in black after total cycles. chd=chondrule.

Discussions:
Compared to previous experiments using similar approaches [e.g. 10,16,17,18], some major differences are visible that can be attributed to different aspects: I) the absence of “micro-flaking” observed by [16] on (achondritic) lunar and eucrite meteorites, which is possibly related to the “primary” character of the here studied rocks, i.e., the absence of large scale differentiation or melting processes. II) Terrestrial weathering (as indicated by enhanced cracking rates) has a major impact on the crack formation and should be considered in more detail before using meteorites as analogue materials for asteroids surface. III) The radial cracking around chondrules in CM2 chondrites is a striking observation considering the modelling of internal stress fields, which as implications on the resulting shapes and sizes of grains and fragments. IV) Closing of cracks in Tagish Lake due to the diurnal cycling has never been reported before and several attempts of explanation can be considered.

Conclusions:
We will present a subset of these results and their implications for the mechanisms and shapes of produced particles on CM-like asteroids, the life times of boulders on asteroids, and the influence of hydrated minerals on atmosphereless planetary surfaces.

References:
[1] Hörz, F. et al. (1975) The Moon, 13(1–3), 235–258. [2] Keil, K. (1982) In Lunar Breccias and soils and their meteoritic analogs (p. 65). [3] Horz, F., & Cintala, M. (1997) Meteoritics & Planetary Sciences, 32(2), 179–209. [4] Bischoff, A et al. (2006) Meteorites and the Early Solar System II, 679–712. [5] Bischoff, A. et al. (2018) Geochimica et Cosmochimica Acta, 238, 516–541. [6] Cambioni, S. et al. (2021) Nature, 598(7879), 49–52. [7] Rüsch, O., & Wöhler, C. (2022) Icarus, 384, 115088. [8] Rüsch, O. et al. (2022) Icarus, 387, 115200. [9] Barghouty, A. F et al. (2011) Nuclear Instruments and Methods in Physics Research Section B: Beam Interactions with Materials and Atoms, 269(11), 1310–1315. [10] Delbo M. et al. (2014) Nature 508:233-236. [11] Molaro J. L. et al. (2015) Journal of Geophysical Research 120:255-277. [12] Molaro, J. L. et al. (2017) Icarus, 294, 247–261. [13] Molaro, J. L. et al. (2020) Journal of Geophysical Research: Planets, 125(8). [14] Molaro, J. L. et al. (2020). Nature Communications, 11(1), 1–11. [15] Libourel, G. et al. (2021). Monthly Notices of the Royal Astronomical Society, 500(2), 1905–1920. [16] Patzek, M., & Rüsch, O. (2022) Journal of Geophysical Research: Planets, 127(10). [17] Hazeli, K. et al. (2018) Icarus, 304, 172–182. [18] Liang, B. et al. (2020) Icarus, 335, 113381.

Acknowledgements: M.P and O.R are supported by the Sofja Kovalevskaja Award Project of the Alexander von Humboldt Foundation. Part of this research was supported by the NASA Solar System Exploration Research Virtual Institute 2016 (SSERVI16) under cooperative agreement 80ARC0M0008.

How to cite: Patzek, M., Rüsch, O., Molaro, J. L., and Gundlach, B.: On the Response of Chondrites to Diurnal Temperature Change—Experimental Simulation of Asteroidal Surface Conditions, Europlanet Science Congress 2024, Berlin, Germany, 8–13 Sep 2024, EPSC2024-292, https://doi.org/10.5194/epsc2024-292, 2024.

09:45–09:55
|
EPSC2024-116
|
On-site presentation
Tomas Kohout, Maurizio Pajola, Assi-Johanna Soini, Alice Lucchetti, Arto Luttinen, Alexia Duchêne, Naomi Murdoch, Robert Luther, Nancy Chabot, Sabina Raducan, Paul Sánchez, Olivier Barnouin, and Andrew Rivkin

Bjurböle meteorite fall occurred in the evening hours of March 12, 1899 and was witnessed by many residents across the Baltic region. The terminal mass fell south of Finnish city of Porvoo (approx. 50 km east of Helsinki) on a frozen sea bay. A single 4-m sized hole was found in the ice surrounded by an 8-m circle of fractured ice and a 20-25 m rim of splashed water and sediment. The largest fragment recovered from the impact site weighed 80.2 kg and was located within the bottom sediment approximately 6-7 m below the ice surface. Several other fragments in the range of 10-20 kg were also recovered along with countless smaller fragments. 

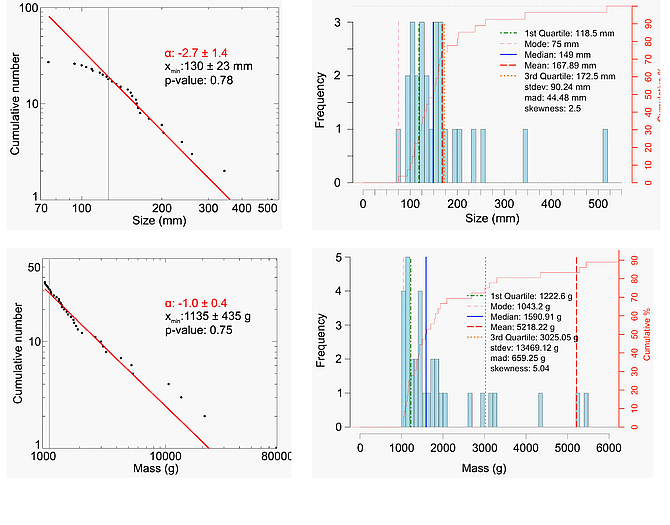
 The ~200 m/s impact of a single 400-kg Bjurböle L/LL ordinary chondrite meteorite onto sea ice resulted in the catastrophic disruption of the projectile. This resulted in a significant fraction of decimeter-sized fragments that exhibit power law cumulative size and mass distributions (Fig. 1). This size range is underrepresented in impact experiments and asteroid boulder studies. Understanding of the impact disruption mechanism of planetary bodies and knowledge of fragment size and shape distributions are important to planetary defense mitigation efforts.

The Bjurböle projectile fragments share similarities in shape (sphericity, and roughness at small and large scale) with asteroid boulders (Fig. 2). However, the mean aspect ratio (3D measurement) and apparent aspect ratio (2D measurement) of Bjurböle fragment is 0.83 and 0.77, respectively, indicating that Bjurböle fragments are more equidimensional compared to both fragments produced in smaller scale impact experiments and asteroid boulders (Fig. 3). These differences may be attributed either to the fragment source (projectile vs. target), to the high porosity and low strength of Bjurböle, to the lower impact velocity compared with typical asteroid collision velocities, or potentially to fragment erosion during sea sediment penetration or cleaning.

Fig. 1. Cummulative frequency size (longest axis) and mass distribution of the Bjurböle fragments.

Fig. 2. Morphology comparison of the Bjurböle fragments and asteroid boulders.

Fig. 3. Dimmensions and apparent aspect ratio histograms of the Bjurböle fragments.

How to cite: Kohout, T., Pajola, M., Soini, A.-J., Lucchetti, A., Luttinen, A., Duchêne, A., Murdoch, N., Luther, R., Chabot, N., Raducan, S., Sánchez, P., Barnouin, O., and Rivkin, A.: Impact disruption of Bjurböle porous chondritic projectile, Europlanet Science Congress 2024, Berlin, Germany, 8–13 Sep 2024, EPSC2024-116, https://doi.org/10.5194/epsc2024-116, 2024.

09:55–10:00

Posters: Wed, 11 Sep, 14:30–16:00 | Poster area Level 1 – Intermezzo

Display time: Wed, 11 Sep, 08:30–Wed, 11 Sep, 19:00
Chairpersons: Rutu Parekh, Tanja Michalik, Ottaviano Ruesch
I1
|
EPSC2024-402
|
On-site presentation
David Haack, Erika Kaufmann, and Axel Hagermann


Introduction

Sublimation experiments performed in vacuum chambers have proven helpful for understanding the processes that occur on the surfaces of volatile-rich celestial bodies without significant atmospheres [1, 2, 3]. In a multitude of celestial bodies where water ice is not found today, there are indications that it was present in the past. On dwarf planet Ceres, located in the asteroid belt between Mars and Jupiter, indicators of what might have been liquid water are significant. In addition to hydrated minerals, salt deposits have been detected at the surface [4, 5], which is difficult to explain without the presence of water. These deposits can be interpreted as remnants of former saline ice reservoirs or ascending brines and may substantially alter the physical properties of the Cerean regolith [6, 7]. It is still in debate how salt-rich ice was transported to the surface of Ceres. Cryovolcanism or hydrothermal processes near the surface may be possible processes [8, 9]. Plausible heat sources for melting near-surface ice could be decaying radionuclides in the interior of Ceres or heat generation from impact events during Ceres' history.


Methods

In a vacuum sublimation chamber, environmental conditions similar to those on the Cerean surface are reproduced, and the conditions under which brines can form salt crusts on a regolith analogue are investigated. The focus is on the parameters of salt composition and the scenarios of how salty ice and regolith analogue interacted in a low-temperature and low-pressure environment. In particular, Na+, NH4+, Cl-, and CO32- based salts were used since they are observed in specific areas of the Cerean surface. We use two salt mixtures with different ratios of the selected ions and prepare three experimental setups:

  • The Ceres regolith analogue is placed in a transparent sample container, saturated with brine, precooled to a solid sample at 190 K, and mounted in a sublimation chamber.
  • The regolith analogue is saturated with liquid brine and placed in the sample container without being precooled.
  • The dry regolith analogue is covered with a layer of salty ice particles <500 µm and placed in the sublimation chamber.

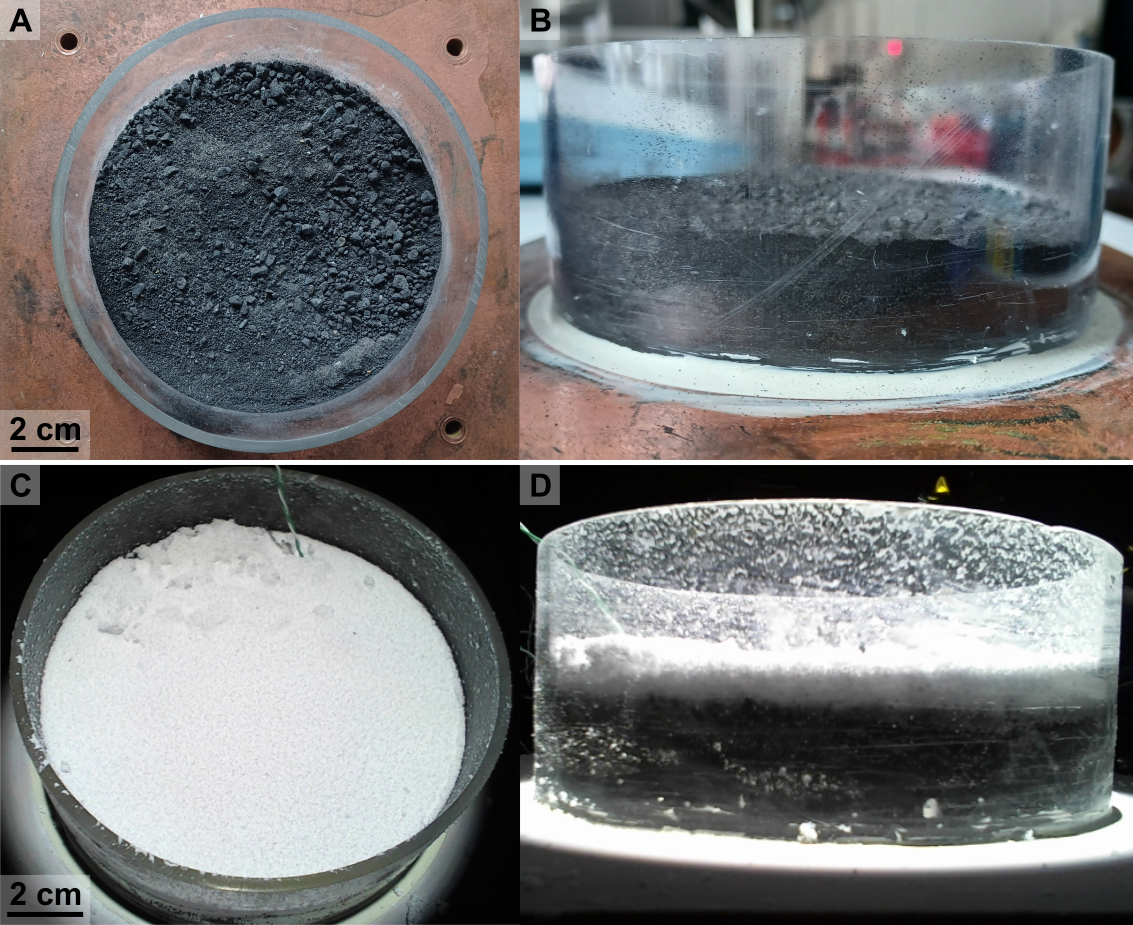
The chamber's environmental conditions are adapted to Ceres and account for 200 K temperature, 5*10-5 mbar atmospheric pressure, and 180 Wm-2 irradiance. Each experiment lasts several days, during which the lateral and horizontal sample surfaces are permanently monitored with cameras (Fig. 1). After completing the sublimation experiments, the sample's surface and internal layer structure are analysed. To compare the spectral characteristics of Ceres' surface with those of the experiments, the reflectance spectra of each sample surface are measured in the spectral range of 400-2500 µm. We carry out two series of experiments with different salt compositions, tested for each of the three scenarios.


Outcome

We aim to test in laboratory experiments which scenario can reproduce salt deposits under environmental conditions similar to those of Ceres.

Possible scenarios how salts could be deposited are:

  • Salty ice could have reached the surface of Ceres through cryoturbation and sublimated eventually, forming salt deposits.
  • Brines may have originated from warmer depths of Ceres, where they ascended slowly to the surface, where the water sublimed, and the remaining salts formed crusts or efflorescences.
  • Brines ascended beyond the surface eruptively, froze to salty ice particles, and fell back to the surface, forming salty crusts after the water sublimed.

Fig. 1: Panels A, B show the top and side view of prepared Ceres analogue material in a transparent sample container with a diameter of 13 cm. Panels C, D present views of a sample in the sublimation chamber during the experiment. The scenario depicts a cover of salty ice particles that have fallen back onto the surface.


References

[1] Poch, O., et al. 2016, Icarus, 267, 154-173. doi:10.1016/j.icarus.2015.12.017

[2] Kaufmann, E., & Hagermann, A. 2018, Icarus, 311, 105-112. doi:10.1016/j.icarus.2018.03.025

[3] Haack, D., et al. 2021, Astronomy & Astrophysics, 649, A35. doi:10.1051/0004-6361/202140435

[4] De Sanctis, M.C., et al. 2020, Nature Astronomy, 4(8), 786-793. doi:10.1038/s41550-020-1138-8

[5] De Sanctis, M. C., et al. 2024, Communications Earth & Environment, 5(1), 131. doi:10.1038/s43247-024-01281-2

[6] Ruesch, O., et al. 2016, Science, 353(6303), aaf4286. doi:10.1126/science.aaf4286

[7] Fastelle, M., et al. 2022, Icarus, 382, 115055. doi:10.1016/j.icarus.2022.115055

[8] Raymond, C. A., et al. 2020, Nature Astronomy, 4, 741–747 doi:10.1038/s41550-020-1168-2

[9] Scully, J. E. C., et al. 2020, Nature Communications, 11, 3680. doi:10.1038/s41467-020-15973-8

How to cite: Haack, D., Kaufmann, E., and Hagermann, A.: Sublimation experiments to reproduce ammonium and chloride deposits under Cerean surface conditions, Europlanet Science Congress 2024, Berlin, Germany, 8–13 Sep 2024, EPSC2024-402, https://doi.org/10.5194/epsc2024-402, 2024.

I2
|
EPSC2024-385
|
On-site presentation
Katharina Otto, Stepahn Elgner, Klaus-Dieter Matz, Elke Kersten, Frank Preusker, Thomas Roatsch, Jim Bell, Ralf Jaumann, Carol Polanskey, David Williams, Lindy Elkins-Tanton, Simone Marchi, Alicia Neesemann, Carol Raymond, and Maria Zuber and the Psyche Team

After its successful launch in October 2023, the NASA Psyche mission is currently on its way to asteroid (16) Psyche where it will arrive in 2029. Psyche is the first metal-rich asteroid to be orbited by a spacecraft (Elkins-Tanton et al., 2016). Thus, the Psyche mission plans a detailed geologic and morphologic survey of the asteroid (Jaumann et al., 2022) supported by an extensive imaging campaign conducted by the Psyche Multispectral Imager (Bell et al., 2016; Polanskey et al., 2018). Previous space missions, in particular the Dawn mission at asteroid Vesta (Russell et al., 2013), provide a base for the science and mission operations to collect the desired data (Polanskey et al., 2018).

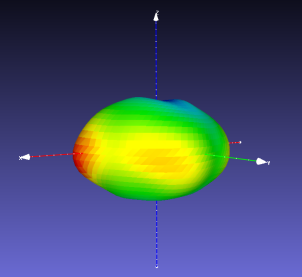
High quality data products including, mosaics and digital terrain models are vital to perform a geologic and geomorphologic analysis, however Psyche is an irregularly shaped body (Shepard et al., 2021) (Figure 1) that makes the illustration and interpretation of such data challenging. Psyche can approximately be described by a bi-axial ellipsoid with axes of 129 km and 86 km (Shepard et al., 2021), resulting in a flattening of 0.33 (the flattening  is defined as , where  and  are the semi-major and semi-minor axes, respectively). As comparison, the also ellipsoidal asteroid Vesta has a flattening of 0.20 with bi-axial axes of 285 km and 229 km.

Figure 1: Psyche’s shape from Shepard et al. 2021. The colours illustrate the surface’s distance from the centre with red and blue indicating high and low values, respectively.

The Dawn mission conducted an extensive mapping campaign at Vesta (Williams et al. 2014) and although the digital terrain models were referenced to the best fit ellipsoid describing Vesta’s shape, the cartographic products (e.g. maps) were usually presented in a geocentric projection (Roatsch et al. 2012, 2013). This means that images of the surface of Vesta were projected onto a sphere of 255 km radius before being map projected. Although this approach is straight forward and did not hinder the geologic interpretation, the surface images are distorted. As a consequence, measuring feature lengths, such as crater diameters, is incorrect, albeit often negligible in the case of Vesta. However, distortion effects will be significantly increased if such techniques are being applied to even flatter Psyche.

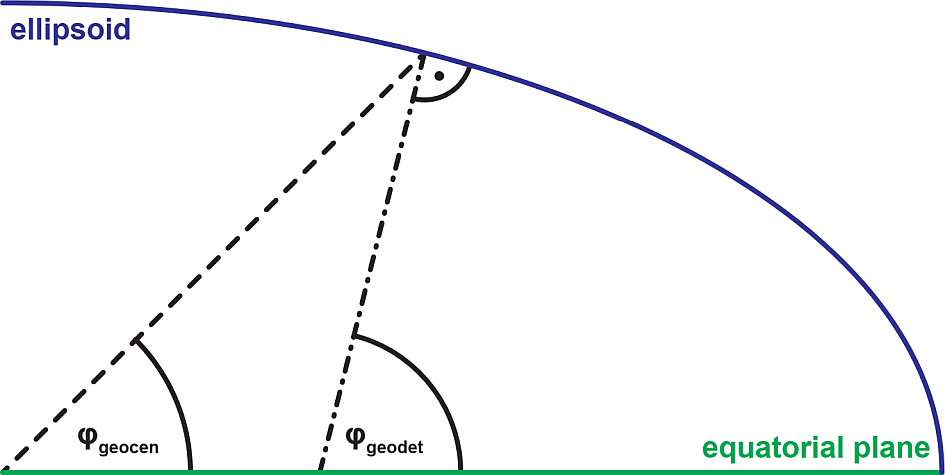
To mitigate such distortion effects on Psyche, one could use a mapping tool that enables mapping directly on the three-dimensional surface (Ernst et al.). However, to make use of the full capacity of the data, it is desirable to generate map products that can be used in standard geoinformation systems, such as QGIS. For such tools, a suited image projection needs be applied, that incorporates the ellipsoidal shape of Psyche. An improvement on distortion can be achieved when applying a geodetic projection, which projects surface images though an ellipsoid’s surface normal rather than a central point (Figure 2).

Figure 2: Illustration of the geocentric and geodetic latitude of a point on the surface of an ellipsoid.

In this work, we will access the effects of Psyche’s ellipsoidal shape on producing and interpreting cartographic products. As a guide to the future generation of Psyche cartographic products, we will show how potential surface features and measurements on Psyche in geocentric projection will be distorted compared to geodetic projections.


References:

Bell, J., et al., 2016. The Psyche Multispectral Imager Investigation: Characterizing the Geology, Topography, and Compositional Properties of a Metallic World. Presented at the 47th Lunar and Planetary Science Conference, The Woodlands, TX, USA, #1366.

Elkins-Tanton, L.T., et al., 2016. Asteroid (16) Psyche: The Science of Visiting a Metal World. Presented at the 47th Lunar and Planetary Science Conference, Woodlands, Texas, USA, #1631.

Ernst, C.M., et al., 2018. The Small Body Mapping Tool (SBMT) for Accessing, Visualizing, and Analyzing Spacecraft Data in Three Dimensions, in: 49th Lunar and Planetary Science Conference. Presented at the 49th Lunar and Planetary Science Conference, The Woodlands, Texas, USA, #1043.

Jaumann, R., et al., 2022. The Psyche Topography and Geomorphology Investigation. Space Sci Rev 218, 7. https://doi.org/10.1007/s11214-022-00874-7

Polanskey, C.A. et al., 2018. Psyche Science Operations Concept: Maximize Reuse to Minimize Risk, in: 2018 SpaceOps Conference. Presented at the 2018 SpaceOps Conference, American Institute of Aeronautics and Astronautics, Marseille, France. https://doi.org/10.2514/6.2018-2703

Roatsch, T., et al., 2013. High-resolution Vesta Low Altitude Mapping Orbit Atlas derived from Dawn Framing Camera images. Planetary and Space Science 85, 293–298. https://doi.org/10.1016/j.pss.2013.06.024

Roatsch, T., et al., 2012. High resolution Vesta High Altitude Mapping Orbit (HAMO) Atlas derived from Dawn framing camera images. Planetary and Space Science, Solar System science before and after Gaia 73, 283–286. https://doi.org/10.1016/j.pss.2012.08.021

Russell, C.T., et al., 2013. Dawn completes its mission at 4 Vesta. Meteorit Planet Sci 48, 2076–2089. https://doi.org/10.1111/maps.12091

Shepard, M.K., et al., 2021. Asteroid 16 Psyche: Shape, Features, and Global Map. Planet. Sci. J. 2, 125. https://doi.org/10.3847/PSJ/abfdba

Williams, D.A., et al., 2014. Introduction: The geologic mapping of Vesta. Icarus, Special Issue: The Geology of Vesta 244, 1–12. https://doi.org/10.1016/j.icarus.2014.03.001

How to cite: Otto, K., Elgner, S., Matz, K.-D., Kersten, E., Preusker, F., Roatsch, T., Bell, J., Jaumann, R., Polanskey, C., Williams, D., Elkins-Tanton, L., Marchi, S., Neesemann, A., Raymond, C., and Zuber, M. and the Psyche Team: Minimizing distortion introduced by Psyche’s ellipsoidal shape in cartographic products , Europlanet Science Congress 2024, Berlin, Germany, 8–13 Sep 2024, EPSC2024-385, https://doi.org/10.5194/epsc2024-385, 2024.

I3
|
EPSC2024-420
|
On-site presentation
Using “synthetic” sloan values of meteorites in support of multiband photometry data on Atira surface
(withdrawn)
Vasiliki Petropoulou, Paola Manzari, Cosimo Marzo, and Alessio Giunta
I4
|
EPSC2024-617
|
ECP
|
On-site presentation
|
Aditya Savio Paul

Performing geological investigations for small body surface bodies require a holistic understanding of their environments including the activities that relate to their dynamic behavior. Planetary bodies in the likes of asteroids, comets and other small solar system bodies are expected to host environments which are quite erratic in nature. The occurrence of various geological features like craters and boulders are resultant of such erratic activities including rubble disintegrations, inherent force effects due to rotations on varied axes, impacts from surrounding bodies including micro-meteorites, eminent cosmic dust interactions, as well as surface and sub-surface activities.

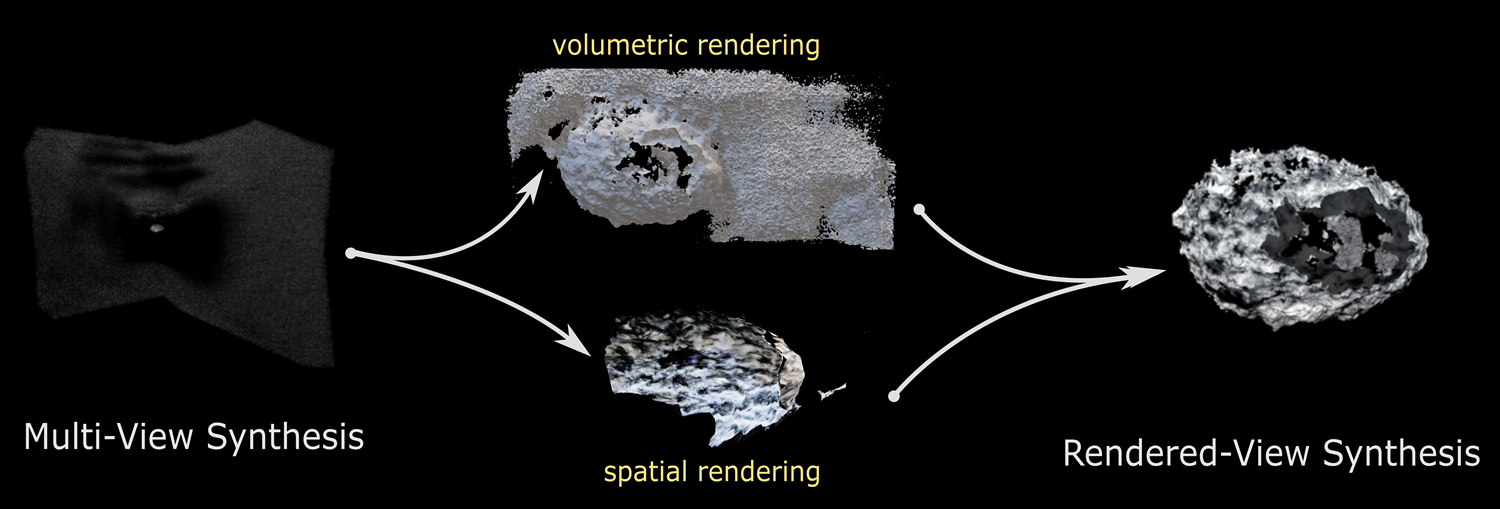
Fig 01. Schematic of target representation in volumetric and spatial views

It is these erratic activities that have propelled planetary sciences to advance techniques and methods to explore, navigate and investigate the processes occurring on these bodies. Missions relating to flybys and in-orbit exploration are therefore envisaged to better understand these bodies, as compared to remote observations. However, owing to the surface activities and orbital behavior, it is a challenge to plan missions to these bodies. A solution to this is developing scenarios that represent the morphologies of the target bodies. This provides an intuition regarding their structure and dynamics which brings enhanced cognition towards understanding the activities that may have led to the formation of such features. Probing the environments of small body surfaces requires models that can be spatially represented. These models can be synthesized with spatial observations that can be represented in the radiance and volumetric domains to develop coherent models of the target bodies.
In order to study these bodies and concurrent activities in their vicinity, it is essential that these scenarios are developed (with a sense of photorealism) that provide the intuition about the possible states of the target body that the spacecraft encountered during different mission phases or develop cognition for future spacecraft missions to yet-to-be-explored bodies in space.

This work leverages generative radiance fields to reconstruct varied geo-morphological representations of the surfaces of the target body allowing to render multi-angle views as insights to the surface features and morphology. This approach presents us the opportunity to visualize different geo-morphological views to pursue investigations on surface formations like craters ad boulders. The method synthesizes the scene descriptions as a continuous volumetric scene capturing the surface irradiance reflected off the bodies. Building on this information, we can generate varied states and directional views of the surface features.

Fig 02: Volumetric model reconstructed with spatially represented surface features

Deploying a neural network-based approach the scene representation adopts a fully-connected network using spatial location, and the viewing angles to output the volumetric extent and view-dependent emitted radiance. The neural model is trained over spatially obtained images and subsequent solar phase angles to produce iteratively-progressive minimum-loss environments delineating the surface features. For a holistic understanding, mission-relevant spacecraft trajectories are sampled that perform proximity fly-bys and in-orbit maneuvers capturing the simulated target body from spatially-optimal sampled positions. The neural output is optimized based on varied solar flux incidence angles that effectively illuminate the target body to produce representative surface geometry and geo-appearances. The generation models aid in developing a geomorphic map of the surface features like mounds, boulders and craters.
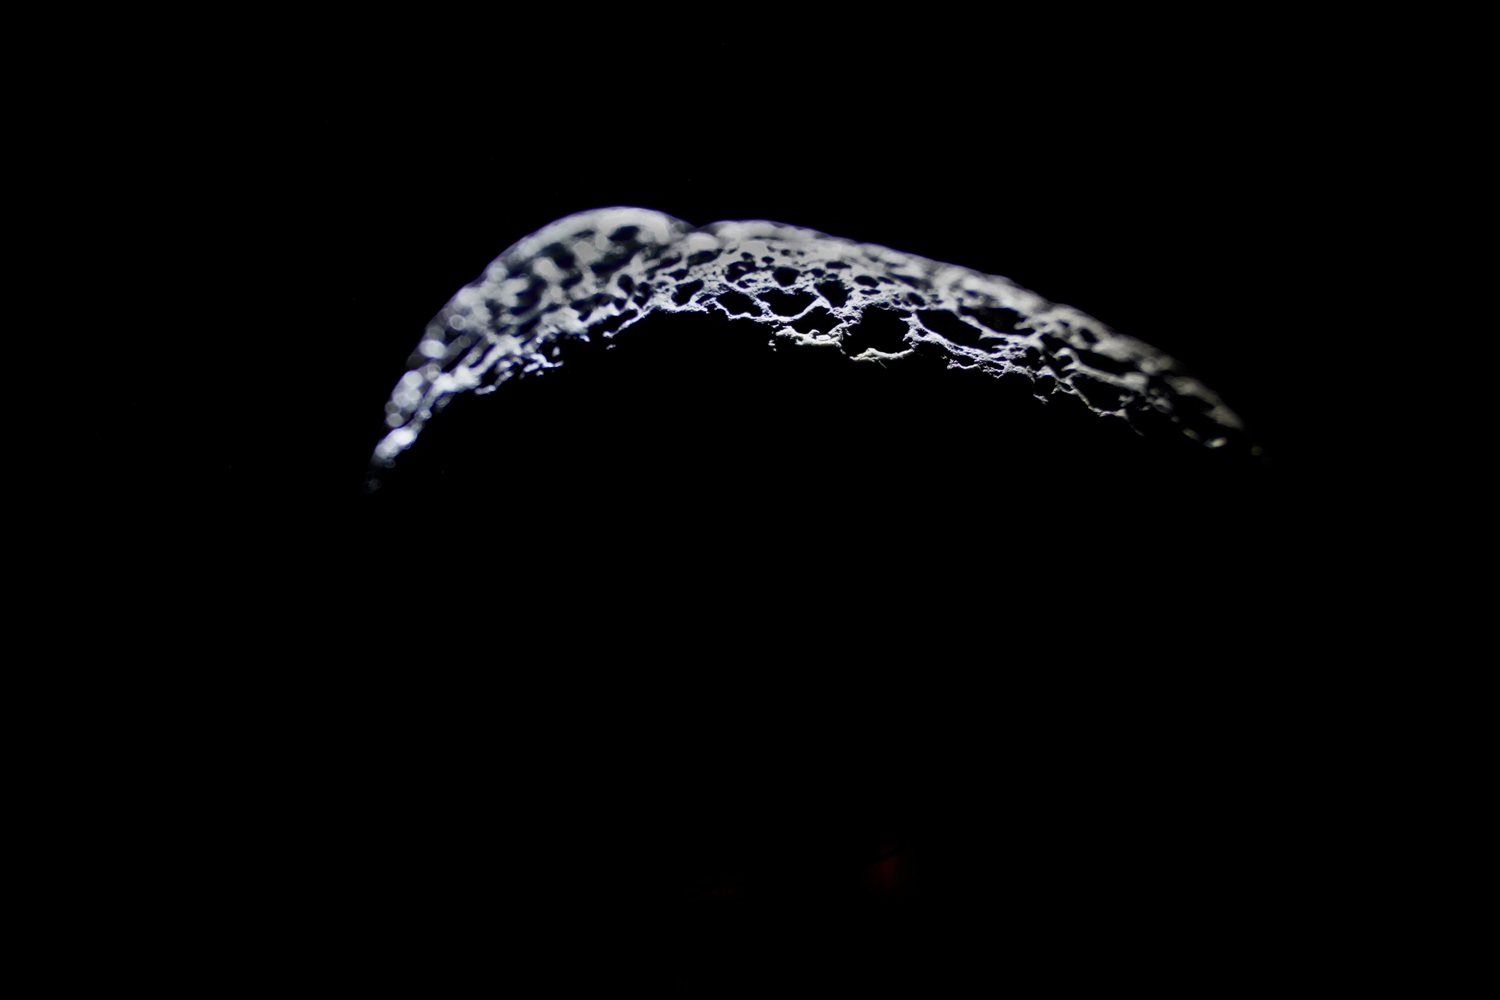
The research is pursued in two directions – Firstly, performing optimally-spatially renders within a physics-informed space simulation environment (as a requisite of multi-view synthesis) and secondly, obtaining observational data of proxy targets in the space analog within the Space Mission Simulation Centre located in the premises of Tartu Observatory, University of Tartu, Estonia.

Fig 03. Small Body target imaged at Tartu Observatory Facility

The simulations are designed over trajectory solutions to produce a sequence of images representing various orbital maneuvers, as a-priori information, to capture the object of interest from spatially-varied location and orientation. The analog environment at Tartu Observatory serves as a proxy for real-world spatial settings, allowing for controlled experimentation and detailed examination of various surface phenomena. Through a series
of defined trajectories in the form of flybys and proximity, images of the proxy-targets are samples. The targets are illuminated using varied pseudo-solar angles representing the solar illumination. Multiple data gathering campaigns produce images acquired that are used to train the neural network model for producing photo-realistic scene representations. The proposed key investigation surface features include factors influencing the formation and evolution of surface features and shedding light on fundamental geological processes such as weathering, erosion, and deposition. These scenes can produce educated representations of the environments that spacecrafts and satellites might encounter when they visit these pristine worlds.

The scenes help us to understand specific morphology and physical entrails of the target bodies that affect the dynamics of these bodies. The scene representations also help to model inherent forces like the gravitational influence, solar radiation pressure, Yarkowsky’s effect and their extent exerted by these bodies. Moreover, the representations also aid in producing models for endogenous activities like rubble and dust particulates in close vicinity of these bodies.

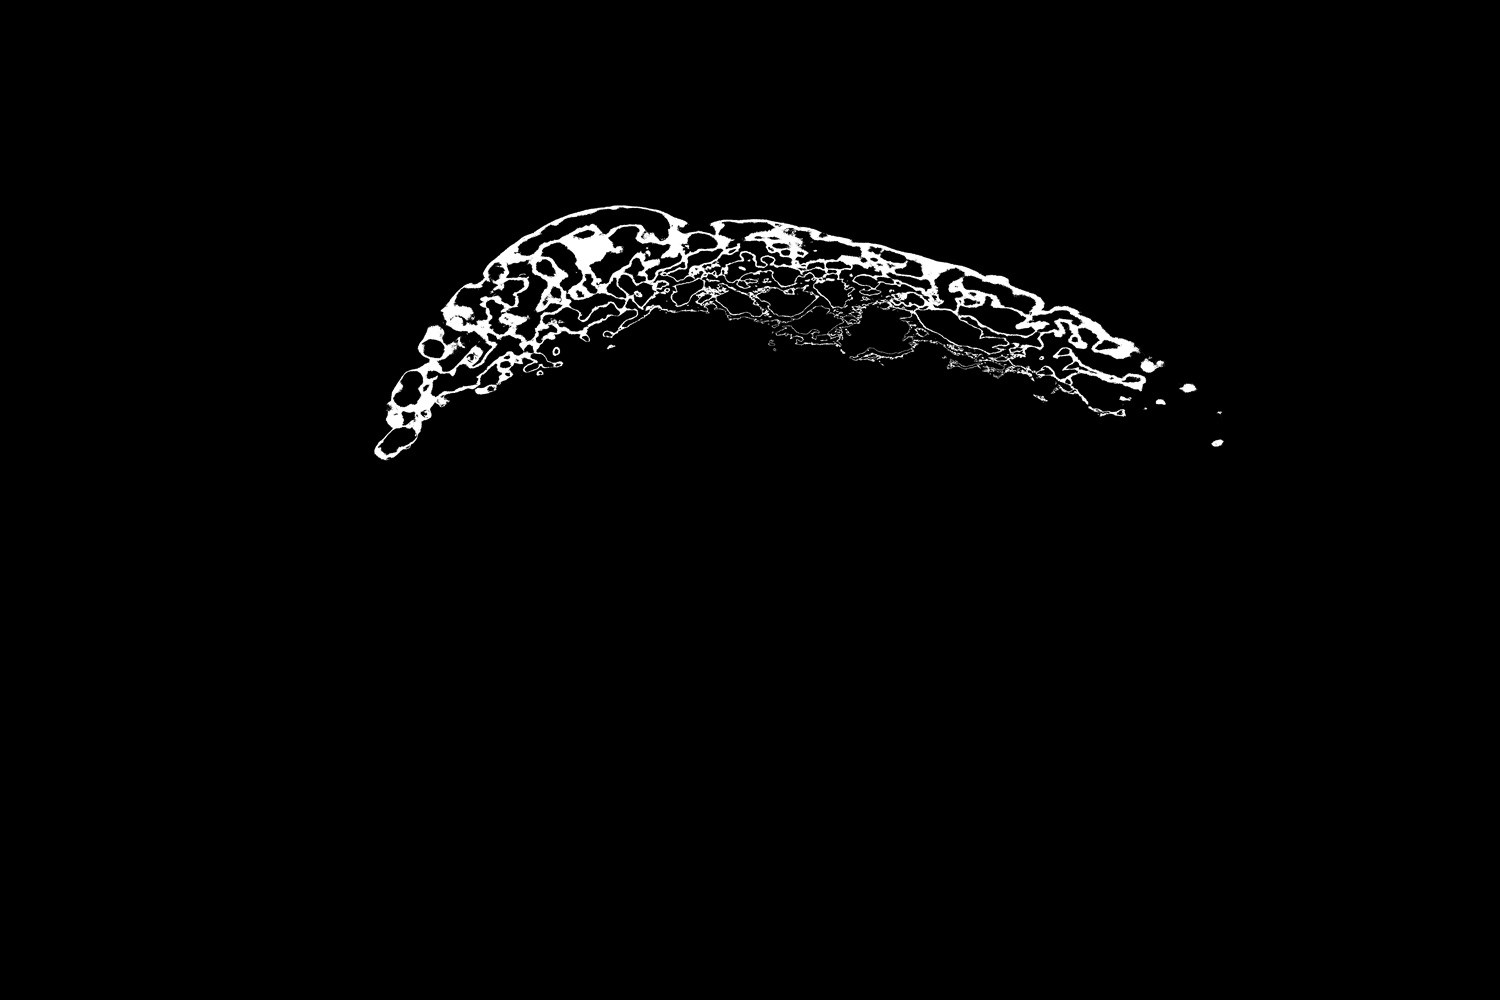
Fig 04. Feautre recognition for surface ridges

Fig 05. Feautre recognition for surface craters and impacts

In a broader perspective, the scene representations serve as initial understandings of the morphological features of the target body which helps in the design, planning, control and analysis of potential space missions. This helps us to characterize them better and eventually results in a high-scientific yield. The research has the potential to contribute to in-orbit mapping procedures where various orbits of exploration can be assimilated towards generating high fidelity environment maps. Moreover, endeavors with planetary defense also have parallel insights with scene representations and scenario development, especially in capturing transient event flybys in the case of Oumuamua or the impact and aftermath of endeavors like the DART and HERA mission objectives.

How to cite: Paul, A. S.: Radiance Morphological Mapping for Small Body Surface Investigations, Europlanet Science Congress 2024, Berlin, Germany, 8–13 Sep 2024, EPSC2024-617, https://doi.org/10.5194/epsc2024-617, 2024.

I5
|
EPSC2024-671
|
On-site presentation
Hiroshi Kikuchi, Goro komatsu, Hideaki Miyamoto, Ryodo Hemmi, Yuta Shimizu, Shingo Kameda, Naoya Sakatani, Naru Hirata, Eri Tatsumi, Hiroyuki Sato, Masahito Watanabe, and Seiji Sugita

Abstract
Active boulder movements were observed when the Hayabusa2 spacecraft ascended from the surface of (162173) Ryugu. This study focuses on boulders that have moved over long distances (>1 m) and compares their movements with the gravitational field on the surface. Our results suggest that boulders rolled and fell down into regions of lower gravity potential. Since such phenomena can also be expected from seismic shaking effects by impacts, repeated movements of boulders near the equator could potentially refresh the surface.

1. Introduction
During the operation of touchdown rehearsals on March 8, 2019, specifically during the low altitude observation, several boulders were observed to have moved as the spacecraft ascended during which thrusters were fired. The movements of the boulders were primarily induced by gas flow from the thrusters [1]. The slow speed of the boulder movements, along with their rolling motions, resulted in some boulders moved > 1 meter along the asteroid surface. To investigate how these boulders were influenced by the surface gravity field, this study examined the relationship between the trajectories of moved boulders and the Ryugu's surface gravity field.

2. Data and Method
To track the locations of the moved boulders, we used 24 the Optical Navigation Camera (ONC) images and mapped them onto a shape model (with 1,579,014 vertices and 3,145,728 plates). Additionally, we generated p-b (860 to 480 nm) ratio images similar to [2] using two ONC-T images for the moved boulders. Then, with a current rotation period of 7.63 hours, we calculated the surface gravity of Ryugu. The direction and magnitude of the slope were determined from the gravity direction vector and the surface normal vector of the shape model.

3. Results
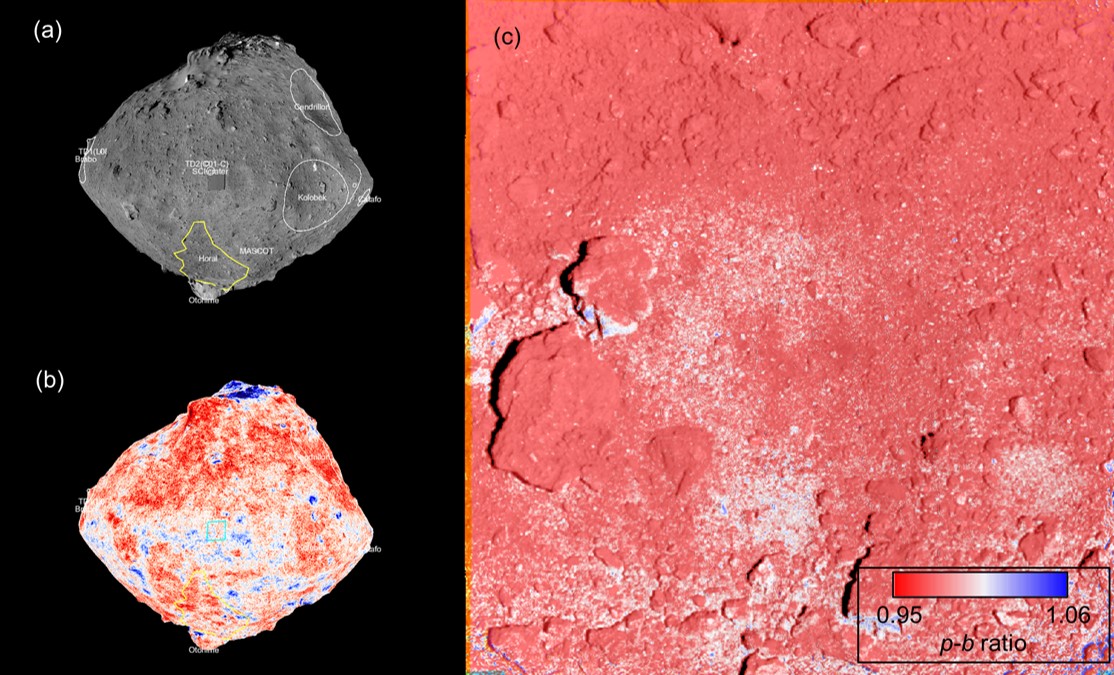
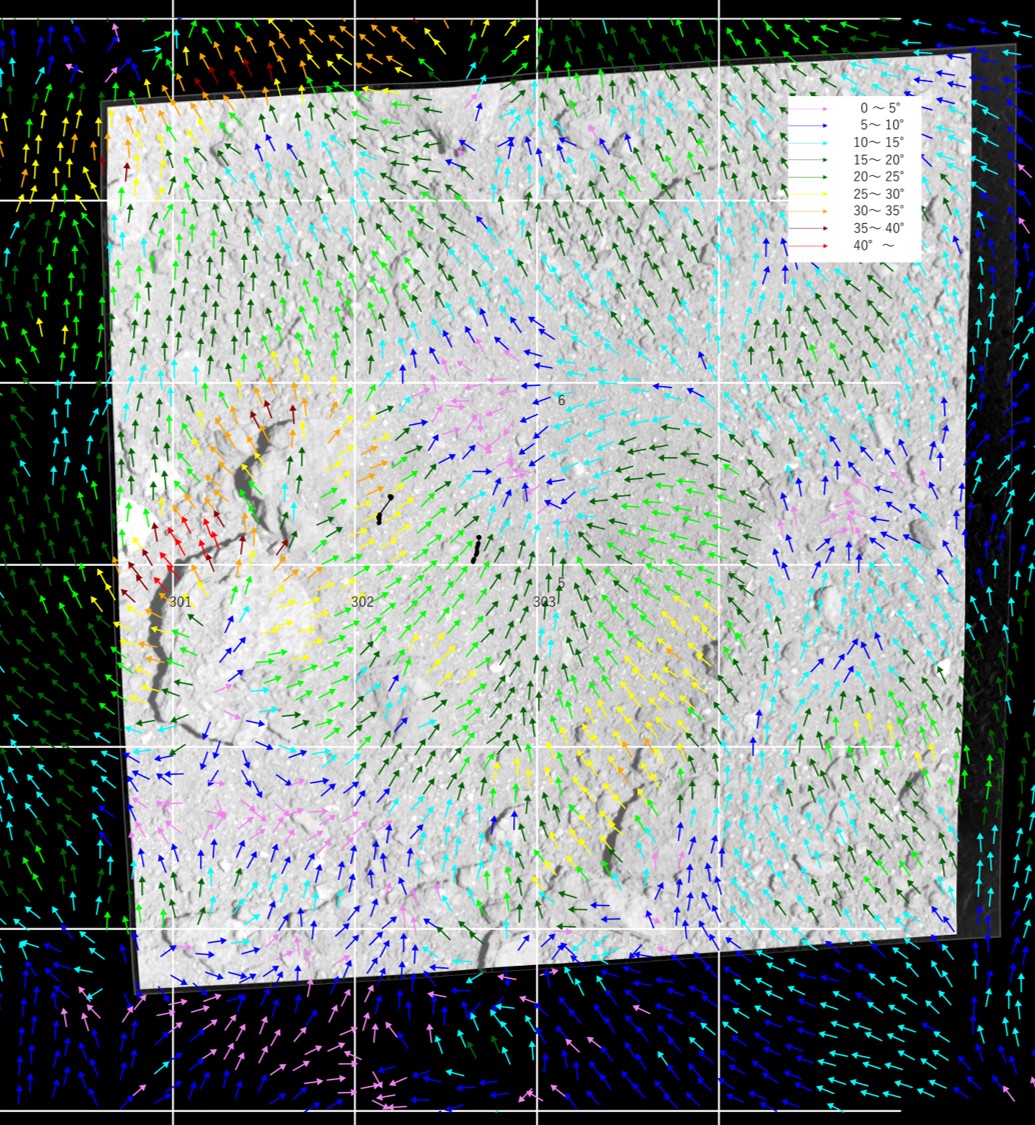
The observed locations of the moved boulders exhibit the red spctral slope (Fig. 1). The expected directions of boulders which are calculated from shape model closely align with the observed trajectories (Fig. 2). 

4. Discussion
The results indicate that after the boulders moved > 1 meter received momentum from the thrusters, they started to move along the direction of gravity. These movements of boulders can be similar to what is expected to be triggered by vibrations due to natural impacts on the asteroid surface. If such phenomena are to repeat, material movement in the equatorial region of Ryugu, where the gravitational potential is high may lead to resurfacing [2, 3].

Acknowledgements
This work is supported by the JAXA Hayabusa2# International Visibility Enhancement Project.

References
[1] Sakatani et al., 2024, LPSC 55, #1719. [2] Morota et al., 2020, Science, 368, 654-659. [3] Kikuchi et al., 2022, LPSC 53, #1943. 

Fig. 1. Observations of rolled boulder areas depicted using JADE (https://jade.darts.isas.jaxa.jp)(a, b). p-b ratio images obtained from ONC images (hyb2_onc_20190308_033713_txf_l2drc) (c).

Fig. 2. Direction of movement for rolled boulders influenced by surface gravity. The black paths track the movement of rolled boulders. The direction and color of the arrows indicate the direction and magnitude of the gravitational slope. Image (hyb2_onc_20190308_033713_txf_l2d) projected onto an equidistant latitude-longitude map.

How to cite: Kikuchi, H., komatsu, G., Miyamoto, H., Hemmi, R., Shimizu, Y., Kameda, S., Sakatani, N., Hirata, N., Tatsumi, E., Sato, H., Watanabe, M., and Sugita, S.: Active Boulder Falls on Asteroid Ryugu, Europlanet Science Congress 2024, Berlin, Germany, 8–13 Sep 2024, EPSC2024-671, https://doi.org/10.5194/epsc2024-671, 2024.

I6
|
EPSC2024-505
|
ECP
|
On-site presentation
Evelina Svanström, Katharina Otto, and Stefanus Schröder

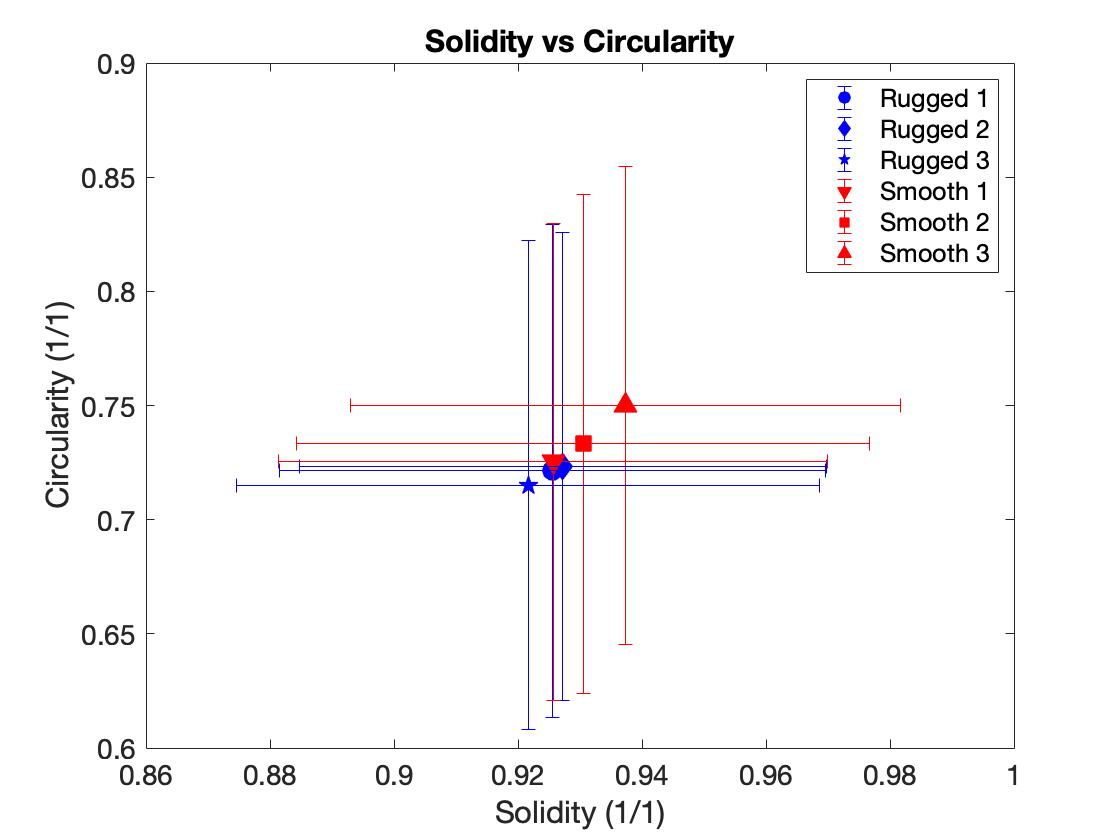
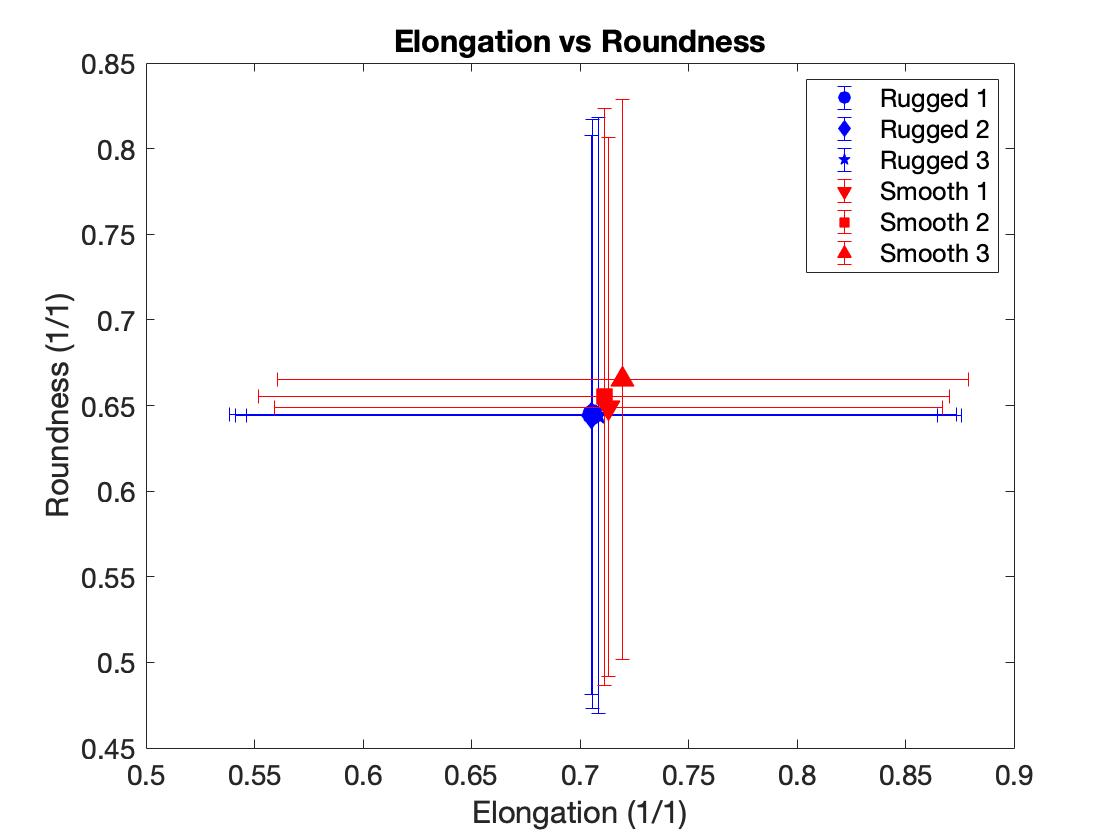
NASA’s Origins, Spectral Interpretation, Resource Identification, and Security-Regolith Explorer (OSIRIS-REx) spacecraft arrived at the near-Earth rubble pile asteroid (101955) Bennu in December 2018, and took high resolution images of the surface (3). The images revealed that the surface is covered with boulders of various sizes (6). The morphology and orientation of these boulders can provide valuable information about the body’s history and mechanical properties (1,4). In this work, we use images taken by the OSIRIS-Rex Camera Suite (OCAMS) (6) to map the outline of boulders on Bennu in two different geologic units: a rugged unit and a smooth unit (2). This work was implemented using the open-source software QGIS (5). The parameters we found in QGIS are show in Figure 1. We compare the two units’ boulder morphology in terms of boulder roughness by looking at the shape factors solidity (to what extent a boulder is convex) and circularity (to what extent a boulder’s perimeter is similar to the perimeter of a circle with the same area). The solidity plotted against the circularity can be seen in Figure 2. We also looked at the boulder shape by studying the shape factors elongation (how elongated a boulder is) and roundness (to what extent the area of the boulder resembles the area of a circle with its radius equal to the boulder’s semi-major axis). The elongation plotted against the roundness can be seen in Figure 3. Despite the geologic differences of the smooth and rugged units, we find no significant difference in boulder roughness and shape between these two units. Both regions’ boulders possess a large variation of values that overlap significantly. However, we do find that the smooth unit tends to have smaller boulders (0.579±0.35) m with more boulders mapped (total 2426) than the rugged unit ((0.711±0.48) m, total 1774 boulders mapped). Finally, we found that smaller boulders tend to be rounder and less rough than larger boulders in both units, however, this may be an effect of the image resolution. This work implies that boulder morphology is relatively uniform over the surface of Bennu, also indicating that the mechanical material properties are similar in the two units. Although the units are geologically distinct, the material they are made of seems to be homogenous.    


Figure 1: The boulder parameters identified in QGIS. A is boulder area (blue area), H is convex hull area (orange area), P is boulder perimeter(red line), a is the major axis and b is the minor axis. The green circle is the minimum circumscribed circle.

Figure 2: The shape factors that describe boulder roughness, solidity and circularity, plotted against each other in the six studied regions.


Figure 3: The shape factors that describe boulder shape, elongation and roundness, plotted against each other in the six studied regions.


(1): P Cambianica et al. “Quantitative analysis of isolated boulder fields on comet 67P/Churyumov-Gerasimenko”. In: Astronomy & Astrophysics 630 (2019), A15. doi: 10.1051/0004-6361/201834775.

(2): ER Jawin et al. “Global geologic map of asteroid (101955) Bennu indicates heteroge-
neous resurfacing in the past 500,000 years”. In: Icarus 381 (2022), p. 114992. doi:
10.1016/j.icarus.2021.114467.

(3): DS Lauretta et al. “OSIRIS-REx: sample return from asteroid (101955) Bennu”. In:
Space Science Reviews 212 (2017), pp. 925–984. doi: 10.1007/s11214-017-0405-1.

(4): T Michikami and A Hagermann. “Boulder sizes and shapes on asteroids: a comparative
study of Eros, Itokawa and Ryugu”. In: Icarus 357 (2021), p. 114282. doi: 10.1016/
j.icarus.2020.114282

(5): QGIS.org (2024). QGIS Geographic Information System. Open Source Geospatial Foundation Project. http://qgis.org

(6): B Rizk et al. Spectral Interpretation, Resource Identification, Security, Regolith Explorer
(OSIRIS-REx): OSIRIS-REx Camera Suite (OCAMS) Bundle. urn:nasa:pds:orex.ocams,
NASA Planetary Data System. 2019.

How to cite: Svanström, E., Otto, K., and Schröder, S.: Boulder Morphology on Asteroid Bennu, Europlanet Science Congress 2024, Berlin, Germany, 8–13 Sep 2024, EPSC2024-505, https://doi.org/10.5194/epsc2024-505, 2024.

I7
|
EPSC2024-566
|
ECP
|
On-site presentation
|
Lakshika Palamakumbure, David Korda, and Tomas Kohout

The surfaces of airless planetary bodies exposed to the interplanetary environment experience space weathering (SW). Over time, the SW process distorts certain reflectance spectral features such as spectral slope, albedo, or absorption band depths and widths. Extensive laboratory experiments studied the evolution of these spectral parameters under simulated SW conditions. However, despite these efforts, the precise relationship between SW duration and the alteration of reflectance spectra remains not fully understood. Various experiments give different, often non-linear evolution rates (Loeffler et al. 2009, Vernazza et al. 2009, Hapke et al. 2001). This research aims to develop and apply machine-learning models to estimate the surface exposure time of S-type asteroids as a function of space weathering agents and dose.

The primary source of the training spectral data are published empirical space weathering simulations. We gathered 200 spectra from publications and mineral and meteorite databases: Re-Lab, and C-TAPE. This included materials such as olivine (85), pyroxene (47), mixtures of olivine and pyroxene (9), as well as chondritic meteorites (59). These materials reflect the composition often found in S-type asteroids. Then we calculated the exposure time at 1 AU for the reflectance spectra based on the laboratory simulation conditions (Sasaki et al. 2002, Schwenn 2000). The exposure time of the dataset ranges from fresh material to 109 years. In this study, we developed a Convolutional Neural Network (CNN) model (model 1) and two models using the ensemble learning technique. The ensemble learning technique combines the results of several models to improve the overall model prediction (Phyo et al. 2022). In the first ensemble model (model 2), we combined four decision tree algorithms: Gradient Boosting Tree Regressor (GBT), Decision Tree Regressor (DT), Extra Tree Regressor (ET), and K-neighbors Tree Regressor (KNT). In the second ensemble model (model 3), we combined a CNN with GBT, DT, ET, and KNT. Then we trained and evaluated these models using the stratified K-fold cross-validation method to assess the performance and generalization ability of a predictive model. The models were fed with reflectance spectra and SW conditions as independent variables, while exposure time was predicted as the dependent variable.

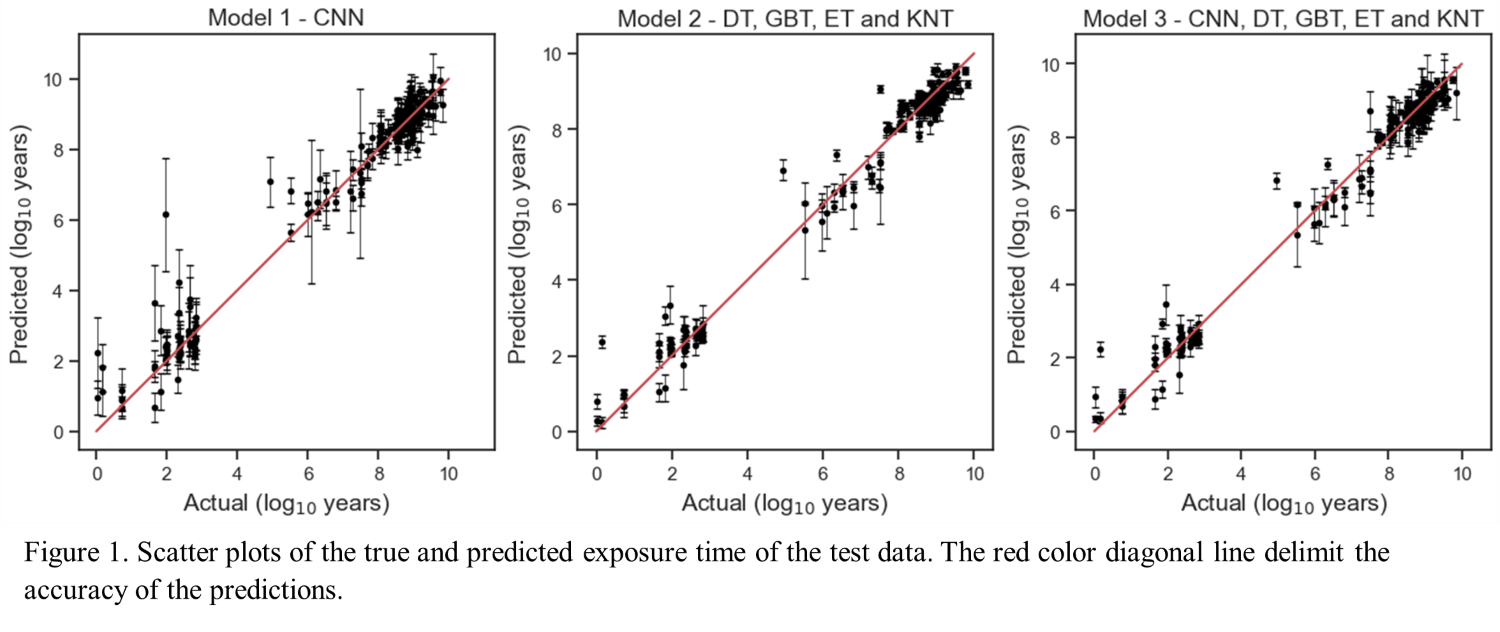
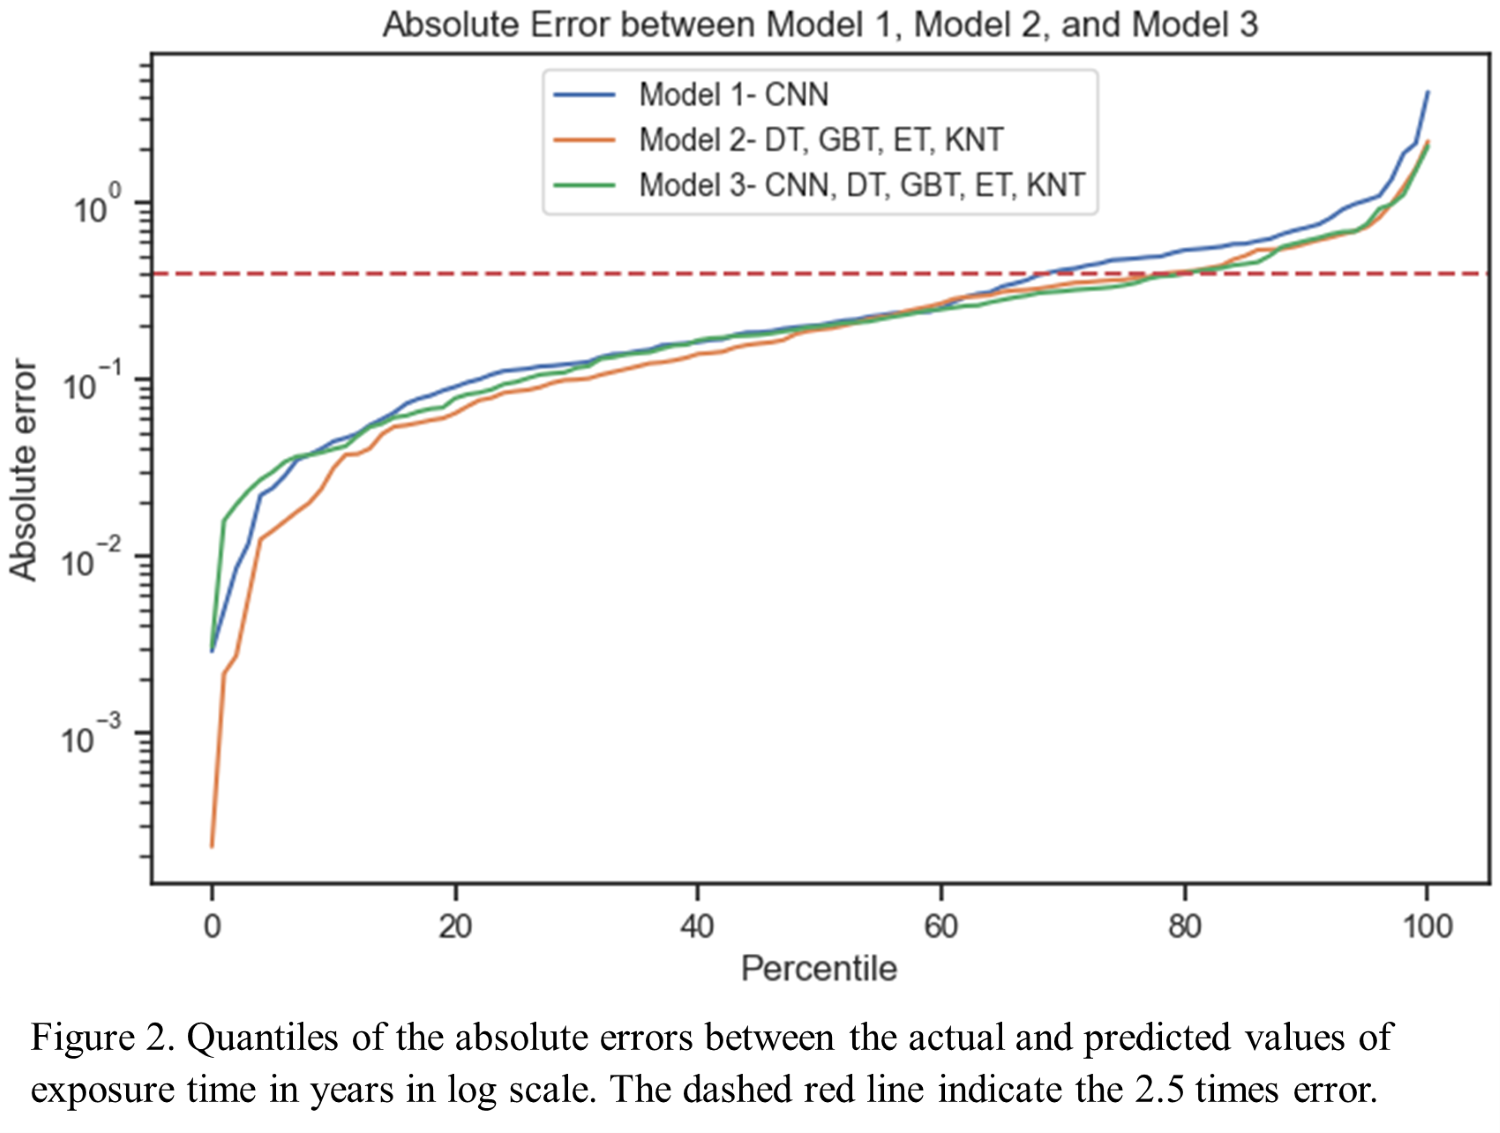
Figure 1 illustrates a comparative analysis of actual values versus predicted values from the three models, with the standard deviation across 10 iterations. Notably, as we progress from model 1 to model 3, there is a noticeable enhancement in prediction accuracy, coupled with a reduction in standard deviation. In Figure 2, it is observed that 68% of the predicted values from model 1 estimate time with accuracy better than 2.5 times. However, with the utilization of ensemble model 2 and ensemble model 3, this metric sees a notable improvement, reaching 77% and 80% accuracy respectively. The combination of the CNN model with decision tree algorithms not only reduces absolute error but also improves standard deviation, thus increasing the reliability of predictions. Consequently, the ensembled model, featuring CNN in combination with decision tree algorithms, yields more dependable prediction compared to a standalone CNN model. The constraint of a small dataset size limits the CNN model's capacity to assemble and extrapolate the relationship between SW and surface exposure time from irradiated samples. Conversely, decision tree-based algorithms have shown better performance under such circumstances. It is worth noting that various tree-based algorithms exhibit varying degrees of proficiency across different segments of the dataset. However, their combination notably enhances the overall performance of the model. Furthermore, the combination of the CNN model with the tree-based ensemble model yields further improvements in results. The next step of this work would be to apply this model to asteroid spectra to determine their exposure time.

Hapke, B. 2001 DOI 10.1029/2000JE001338

Loeffler et al. 2009 DOI 10.1029/2008JE003249

Phyo et al. 2022 DOI 10.3390/sym14010160

Sasaki et al. 2002 DOI 10.1016/S0273-1177(02)00012-1

Schwenn, R. 2000 DOI 10.1201/9781003220435

Vernazza et al. 2009 DOI 10.1038/nature07956


How to cite: Palamakumbure, L., Korda, D., and Kohout, T.: Predicting the surface exposure time of asteroids using the space weathering features in reflectance spectra: small data machine learning., Europlanet Science Congress 2024, Berlin, Germany, 8–13 Sep 2024, EPSC2024-566, https://doi.org/10.5194/epsc2024-566, 2024.

I8
|
EPSC2024-448
|
On-site presentation
Nikhil Keshav, Stefan Schröder, Ernst Hauber, and Axel Hagermann

The origin of the two Martian moons - Phobos and Deimos, remains enigmatic. Asteroid capture and accretion of the Martian debris disk (formed during planet formation or later induced by impact) are currently the two hypothesized explanations (Burns 1972, Craddock 2011). The upcoming JAXA mission, Martian Moon Explorer (MMX), aims to definitively resolve this debate by directly acquiring samples from Phobos for analysis on Earth. 

The observations of Phobos from the High-Resolution Stereo Camera (HRSC) onboard the Mars Express spacecraft can provide valuable information to support sample return mission planning. Surface physical properties, such as porosity and particle size, are critical for planning sample collection strategies and selecting suitable sampling locations. Earlier photometric studies have primarily focused only on integrated photometry or lacked sufficient spatial resolution (Simonelli et al. 1998, Pajola et al. 2012). Consequently, these studies offer limited constraints on surface physical parameters. The recent work of Fornasier et al. (2024) using the HRSC observations has found the opposition surge amplitude to be considerably lower than the earlier works based on the Viking mission observations (Simonelli et al. 1998). The difference in opposition surge parameters for different albedo regions has also been reported. 

Our work aims to establish disk-resolved empirically derived opposition surge parameters for various HRSC filters. This will serve as a verification for some of the parameters derived by Fornasier et al. (2024) through empirical photometric models. The disk-resolved parameters will also enable more accurate estimations of regolith porosity and particle size, facilitating safe and efficient rover operations on the Phobos surface. Additionally, we will analyze panchromatic filter images to generate high-resolution maps of scattering parameters. These maps will serve a dual purpose: facilitating the selection of optimal sampling locations while also improving our understanding of Phobos' global geological features. Finally, a comparative analysis of the derived regolith properties with those of other Solar System bodies is planned to glean deeper insights into Phobos' origin. This work aims to support the JAXA MMX mission and contribute to a more comprehensive understanding of the Martian moon's origin and evolution. 


References:  

Burns, J. (1972) "Dynamical characteristics of Phobos and Deimos", Reviews of Geophysics 10(2), p. 463-483, doi:10.1029/RG010i002p00463 

Craddock, R. (2011) "Are Phobos and Deimos the result of a giant impact?", Icarus 211, p. 1150- 1161, doi:10.1016/j.icarus.2010.10.023 

Simonelli, D. et al. (1998) "Photometric Properties of Phobos Surface Materials From Viking Images", Icarus 131(1), p. 52-77, doi:10.1006/icar.1997.5800 

Pajola, M. et al. (2012) "Spectrophotometric investigation of Phobos with the Rosetta OSIRIS-NAC camera and implications for its collisional capture", MNRAS, 427(4), p. 3230–3243, doi:10.1111/j.1365-2966.2012.22026.x 

Fornasier, S. et al. (2024) "Phobos photometric properties from Mars Express HRSC observations", A&A (forthcoming), doi:10.1051/0004-6361/202449220 

How to cite: Keshav, N., Schröder, S., Hauber, E., and Hagermann, A.: Opposition effect of Phobos from Mars Express HRSC observations , Europlanet Science Congress 2024, Berlin, Germany, 8–13 Sep 2024, EPSC2024-448, https://doi.org/10.5194/epsc2024-448, 2024.