SB6 | Surface and interiors of small bodies, meteorite parent bodies, and icy moons: thermal properties, evolution, and structure

SB6

Surface and interiors of small bodies, meteorite parent bodies, and icy moons: thermal properties, evolution, and structure
Convener: Wladimir Neumann | Co-conveners: Jürgen Blum, Marco Delbo, Cécile Deligny, Wataru Fujiya, Xian Shi
Orals
| Mon, 09 Sep, 14:30–16:00 (CEST)|Room Neptune (Hörsaal D), Tue, 10 Sep, 08:30–12:00 (CEST)|Room Neptune (Hörsaal D)
Posters
| Attendance Mon, 09 Sep, 10:30–12:00 (CEST) | Display Mon, 09 Sep, 08:30–19:00
Orals |
Mon, 14:30
Mon, 10:30
The asteroids in particular and the asteroid-comet-dwarf planet continuum in general bear the signature of the birth of the solar system. Their observed properties allow for testing theories regarding the evolution of the solar system's planetary objects and of their prospective development. Additional important insights into this exciting field of research are provided by the laboratory investigations of the samples delivered to the Earth in the form of meteorites and by sophisticated numerical models.
The session will gather researchers of different communities for a better understanding of the evolution and properties of small bodies, ranging from planetesimals or cometesimals to icy moons, and including meteorite parent bodies. It will address recent progresses made on physical and chemical properties of these objects, their interrelations and their evolutionary paths by observational, experimental, and theoretical approaches.

We welcome contributions on the studies of the processes on and the evolution of specific parent bodies of meteorites, investigations across the continuum of small bodies, including comets and icy moons, ranging from local and short-term to global and long-term processes, studies of the surface dynamics on small bodies, studies of exogenous and endogenous driving forces of the processes involved, as well as statistical and numerical impact models for small bodies observed closely within recent space missions (e.g., AIDA, Hayabusa2, Lucy, New Horizons, OSIRIS-REx).

Orals: Mon, 9 Sep | Room Neptune (Hörsaal D)

Introduction
Surface Properties
14:30–14:40
|
EPSC2024-151
|
ECP
|
On-site presentation
Hao Chen, Konrad Willner, Xuanyu Hu, Ramona Ziese, Friedrich Damme, Philipp Gläser, Wladimir Neumann, and Jürgen Oberst
  • Introduction

Image-based surface or shape modeling is a fundamental task for small body exploration within the solar system. While Deep Learning methods have been rapidly applied to retrieve topographic models of planets (Chen et al., 2022a; 2022b), stereo-photogrammetry (SPG) and stereo-photoclinometry (SPC) are still the two primary methods employed for shape modeling. To achieve detailed global shape modeling, SPG and SPC usually rely on a large number of images. In this study, we introduce a neural implicit shape modeling method utilizing a sparse set of images. Our approach diverges from traditional explicit representation methods like SPG, which utilizes discrete points to interpolate a surface, by employing a continuous implicit representation function to describe body surfaces. The performance is validated on the asteroid Ryugu explored by Hayabusa2 (Watanabe et al., 2019).

  • Method

The method implicitly models surface details and the overall shape using the signed distance function (SDF) (Chen et al. (2024a). The 3D scene of the target is represented in the form of neural implicit functions, encoded by multi-layer perceptrons (MLP), to derive the SDF and color (image gray intensity) from inputs (Chen et al. (2024b). To train the SDF and color network parameters, a volume rendering scheme is employed to render images from the proposed SDF-based representation. We include surrounding points with multi-scale receptive fields as additional input to train the network and design a mask-based classification strategy to capture detailed features on the surface and avoid over-smoothing.

  • Dataset

We selected 70 images with a resolution of 2.2 m captured by the Optical Navigation Camera Telescope (ONC-T; Kameda et al., 2017) to reconstruct the shape model of Ryugu. All images are obtained from camera viewpoints near the equatorial plane. Previously Watanabe et al. (2019) established a Ryugu shape model applying about three times as many images than used in this study with a better image resolution (about 0.7 m) than used here. Estimation of the exterior camera parameters is achieved within a preprocessing step applying structure from motion techniques.

  • Experiment Results

Fig. 1a shows the model derived by Watanabe et al. (2019) using SFM + multi-view stereo (MVS) in direct comparison with the shape model derived by our method (Fig. 1b). While the latter utilizes about 1/3 of the images with lower-resolution, the results still exhibit detailed features consistent with the model derived by Watanabe et al. (2019). Besides, our results demonstrate robustness even in areas with limited camera coverage. For instance, in polar regions where the SFM + MVS method falls short of retrieving some boulders, our approach successfully accomplishes this task.

Fig. 1. Polar views of the shape models of Ryugu reconstructed by Watanabe et al. (2019) (a) and this study (b).

  • Conclusion

We introduced a novel neural implicit shape modeling method utilizing a sparse set of images. It can effectively derive detailed features on the surface. Based on current experiments it appears to be a promising tool to support shape modeling in future small body explorations.

  • References

Chen et al., 2022a. Pixel-resolution DTM generation for the lunar surface based on a combined deep learning and shape-from-shading (SFS) approach. In: ISPRS 2022. Nice, France.

Chen et al., 2022b. CNN-based large area pixel-resolution topography retrieval from single-view LROC NAC images constrained with SLDEM. IEEE JSTARS 15, 9398–9416. https://doi.org/10.1109/JSTARS.2022.3214926.

Chen et al., 2024a. Image-based small body shape modeling using the neural implicit method. In EGU 2024, Vienna, Austria.

Chen et al., 2024b. Neural implicit shape modeling for small planetary bodies from multi-view images using a mask-based classification sampling strategy. ISPRS Journal of Photogrammetry and Remote Sensing, 212, 122-145, https://doi.org/10.1016/j.isprsjprs.2024.04.029.

Kameda et al., 2017. Preflight calibration test results for optical navigation camera telescope (ONC-T) onboard the Hayabusa2 spacecraft. Space Sci. Rev. 208, 17–31. https://doi.org/10.1007/s11214-015-0227-y.

Watanabe et al., 2019. Hayabusa2 arrives at the carbonaceous asteroid 162173 Ryugu--A spinning top–shaped rubble pile. Science 364 (6437), 268–272. https://www.science.org/doi/10.1126/science.aav8032.

How to cite: Chen, H., Willner, K., Hu, X., Ziese, R., Damme, F., Gläser, P., Neumann, W., and Oberst, J.: Small Planetary Body Shape Modeling Using a Sparse Image Set, Europlanet Science Congress 2024, Berlin, Germany, 8–13 Sep 2024, EPSC2024-151, https://doi.org/10.5194/epsc2024-151, 2024.

14:40–14:50
|
EPSC2024-137
|
On-site presentation
Liang-Liang Yu

Regolith, materials of mixture of dusts and boulders, are believed to widely exist on asteroidal surface. However, evidences from recent asteroidal space missions show that regolith on different asteroids can be quite different. There are asteroids that have regolith dominated by fine dust, for example, 433 Eros. There are also asteroids with regolith dominated by porous boulders, for example Ryugu and Bennu. Besides, there exist asteroids, where part of the surface are covered by fine dust, and the other regions are boulders with different size and porosity, for example Itokawa.The physical status of asteroidal regolith can tell us inforation about the origin and evolution of the asteoids. Here we report a method to probe the regolith characteristics of asteroids from multi-epoch infrared light curves, from which the surface albedo, roughness, thermal inertia or mean grain size or boulder porosity can be investigated. Besides, through analysis of multi-epoch infrared light curves, surface heterogeneity can be also evaluated. These physical characteristics of regolith can be helpful for study about the origin and evlution of asteroids.

How to cite: Yu, L.-L.: Probe the regolith characteristics of asteroids from multi-epoch infrared light curves, Europlanet Science Congress 2024, Berlin, Germany, 8–13 Sep 2024, EPSC2024-137, https://doi.org/10.5194/epsc2024-137, 2024.

14:50–15:00
|
EPSC2024-815
|
ECP
|
On-site presentation
Lukas Bannemann, Carsten Güttler, and Bastian Gundlach

Introduction

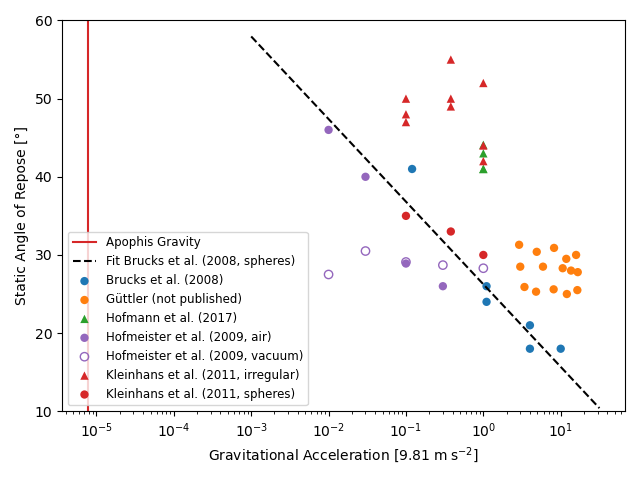
Near-Earth asteroid (99942) Apophis will fly by Earth with a distance of approximately 35,000 km on April 13, 2029. Initial predictions gave Apophis an impact possibility of 2.7% (4 on Torino scale) during its 2029 approach but an impact was subsequently ruled out [1]. Nevertheless, Apophis sparked interest of the scientific and planetary defense communities leading to the planning of missions like Satis, RAMSES, and OSIRIS-APEX. The close fly-by of Apophis will lead to interactions of the approximately 370 m large object and the gravitational field of Earth, potentially resulting in regolith avalanches on the asteroid surface (e.g., [2]). Through the aforementioned space missions, it will be possible to observe and analyze regolith avalanches during the Apophis fly-by, providing important insights into properties and behavior of granular materials. One important property of granular materials regarding regolith avalanche formation is the static angle of repose which describes the angle of a slope that has to be exceeded to start an avalanche (e.g., [3]). The static angle of repose of granular materials in microgravity conditions can be experimentally determined on Earth (Fig. 1). These types of experiments, if they come close to the cohesion limit (i.e., small particles and/or small gravity), are sensitive to humidity. Because most microgravity experiments were not performed in vacuum (e.g., [3-6]), microscopic water pockets may have affected the cohesive properties of the granular material and thus the static angle of repose (e.g., [3], [7]). Extrapolation of non-vacuum experiments to Apophis gravity based on a fit from [4] indicates a static angle of repose of about 80°. Furthermore, few results from vacuum experiments [5] show unconclusive results which is why we plan a new set of experiments to study the angle of repose of Apophis’ surface material.

Figure 1: The static angle of repose of several granular materials was determined by experiments [3-6] under varying gravity conditions. Most experiments were performed under atmospheric pressure (filled symbols) and with spherical particles. Only a few in vacuum (open symbols) or with irregular grains (triangles). A fit of experiment results from [4] would predict a static angle of repose for Apophis gravity of about 80°.

Experiment

Our goal is to measure the static angle of repose of different non-cohesive granular materials as well as cohesive granular materials in a tumbler experiment similar to e.g., [3]. The experiment is designed to be performed under Earth gravity in a laboratory environment at the Institut für Planetologie (University of Münster) as well as under microgravity conditions at the ZARM Drop Tower in Bremen. A tumbler of up to 60 mm inner diameter and variable depth is placed inside a stainless-steel vacuum chamber with an inner diameter of 70 mm and will be connected to a Pirani pressure gauge and a ball valve.  A glass blanking flange with a diameter of 87 mm will seal the vacuum chamber and the inner experiment volume to fully encompass the granular material in vacuum. The described setup will be slowly rotated along the tumbler axis. We will ensure tumbler rotation rates which will cause the granular material to flow in the discrete avalanching regime [8]. The tumbler system will be placed on a baseplate which can be mounted on a wall for further use in the laboratory or on a centrifuge inside the ZARM drop capsule for experiments in microgravity.  The rotation of the centrifuge will simulate artificial gravity during the drop by the acting centrifugal force. Before the start of an experiment, the granular material will be filled to about half of the sample chamber. This is followed by the evacuation of the experimental setup to about 10-2 mbar. The vacuum pump will then be disconnected from the experiment and the chamber shall maintain a pressure better than 1 mbar. Determination of the static angle of repose will be done by analyzing video footage taken by an observation camera. First results of this novel experiment will be presented at the EPSC conference.

Perspective

We aim to run an extensive campaign under Earth gravity (g0) with different shapes and sizes of particles, including sizes that behave cohesive. A reduced parameter set will be studied under reduced gravity, which is expected to be limited to values greater than 10-3 or 10-2 g0. This shall create a sufficient dataset which can be used to extrapolate the static angle of repose of regolith on the surface of Apophis. Combined with computer simulations of the Apophis-Earth interactions, the static angle of repose of Apophis regolith can then be used to determine areas on the surface of Apophis with high probabilities of regolith avalanches and thus areas of interest for imaging. Moreover, comparison of those observations with our experiments shall help to constrain Apophis regolith properties.

References

[1] S.R. Chesley, 2005. Proc. Int. Astron. Union 1. https://doi.org/10.1017/S1743921305006769

[2] G. Noiset et al., 2022. EPSC 2022-1159. https://doi.org/10.5194/epsc2022-1159

[3] M.G. Kleinhans et al., 2011. J. Geophys. Res. 116, E11. https://doi.org/10.1029/2011JE003865

[4] A. Brucks et al., 2008. Earth & Space 2008. https://doi.org/10.1061/40988(323)9

[5] P.G. Hofmeister et al., 2009. AIP Conf. Proc. 1145. https://doi.org/10.1063/1.3180028

[6] M. Hofmann et al., 2017. MNRAS 469. https://doi.org/10.1093/mnras/stx1190

[7] H.M.B. Al-Hashemi and O.S.B. Al-Amoudi, 2018. Powder Technol. 330. https://doi.org/10.1016/j.powtec.2018.02.003

[8] A. Brucks et al., 2007. Phys. Rev. E. 75. https://doi.org/10.1103/PhysRevE.75.032301

How to cite: Bannemann, L., Güttler, C., and Gundlach, B.: Static angle of repose on asteroid (99942) Apophis: development and first tests of a microgravity-vacuum experiment, Europlanet Science Congress 2024, Berlin, Germany, 8–13 Sep 2024, EPSC2024-815, https://doi.org/10.5194/epsc2024-815, 2024.

15:00–15:10
|
EPSC2024-283
|
ECP
|
On-site presentation
Zhijun Song, Yang Yu, Stefania Soldini, Bin Cheng, and Patrick Michel

The mass movement on asteroid surfaces is governed by their weak but complex gravitational fields and is highly coupled with the asteroid's surface topography. Consequently, unlike mass movement on Earth, the movement range of regolith particles on asteroid surfaces can expand from the granular scale to the asteroid scale [1–5]. For instance, during YORP spin-up, local landslides of regolith materials may be initiated when the local slope angle exceeds the friction angle. Depending on the spin rate of asteroids, the scale of movement of these regolith particles can continuously expand from meters during surface local landslides to tens of kilometers during orbital motion after mass-shedding. The DEM (Discrete Element Method) simulation of such regolith movement is confronted with 1) the interactive dynamics between the regolith particles and the asteroid; 2) the modeling of high-resolution asteroid surface topography and the efficient algorithm for computing particle-surface contact forces; 3) the precise computation of irregular gravitational fields on asteroid surfaces; and 4) the scale-span simulation of the regolith migration. To address these challenges, this paper presents a DEM modeling strategy for tracking the scale-span evolution of the asteroid regolith materials, which can efficiently track the scale-span movement process of asteroid regolith materials with high-resolution surface topography at the particle sizes approaching the actual sizes of regolith grains on asteroid surfaces. Using the strategy, a specific DEM code that integrates key mechanical models, including the irregular gravitational fields, the inter-particle and particle-surface interactions, and the coupled dynamics between the particles and the asteroid, is developed to track the asteroid regolith mass movement processes.
Using this code, we investigated the landslide of sand piles on asteroid surfaces during spin-up. The results indicate that: 1) landslides on asteroids are similar to that on Earth, exhibiting distinct particle size segregation, with small particles at the bottom and large particles on the surface; 2) due to the influence of asteroid surface topography, small particles tend to deposit in stable regions on the asteroid surface, resulting in a particle size sieving effect in the landslide-shedding process of the regolith; 3) at the spin rate near the shedding failure limit, the cohesionless surface regolith grains flow toward the equator from the middle latitudes regions and these particles sliding to the equator continues to slide towards the minimum geopotential area and ultimately shed from the near minimum geopotential area; and 4) the centrifugal force significantly deflects the direction of the surface particle flow caused by landslides.
The code has great potential in both theoretical and applied studies. It can serve as a powerful tool for high-resolution investigation of surface activities on asteroids, offering insights into the fine geological processes that shape the landscapes of these celestial bodies. For instance, it can be used to analyze the possible effects of Apophis’ 2029 close encounter with Earth on Apophis' surface and nearby dynamics. Additionally, for the engineering designs in asteroid surface exploration missions, it can provide a reliable way to model the tricky maneuvers of spacecraft landing or contacting the asteroid surface. For example, the code can predict the global cruise trajectory of a hopping lander with high fidelity, providing strong theoretical support for asteroid surface exploration mission design.

Acknowledgements
This work is supported by the National Natural Science Foundation of China under Grant 12272018.
References
[1]    Scheeres, D. J. Landslides and Mass shedding on spinning spheroidal asteroids. Icarus 247, 1–17 (2015).
[2]    Jawin, E. R. et al. Global Patterns of Recent Mass Movement on Asteroid (101955) Bennu. J. Geophys. Res. Planets 125, (2020).
[3]    Sánchez, P. & Scheeres, D. J. Cohesive regolith on fast rotating asteroids. Icarus 338, 113443 (2020).
[4]    Cheng, B. et al. Reconstructing the formation history of top-shaped asteroids from the surface boulder distribution. Nat. Astron. 5, 134–138 (2020).
[5]    Banik, D., Gaurav, K. & Sharma, I. Regolith flow on top-shaped asteroids. Proc. R. Soc. Math. Phys. Eng. Sci. 478, 20210972 (2022).


How to cite: Song, Z., Yu, Y., Soldini, S., Cheng, B., and Michel, P.: An integrated DEM code for tracing the entire regolith mass movement on asteroids, Europlanet Science Congress 2024, Berlin, Germany, 8–13 Sep 2024, EPSC2024-283, https://doi.org/10.5194/epsc2024-283, 2024.

15:10–15:15
15:15–15:25
|
EPSC2024-438
|
On-site presentation
Leonard Schirner, Georgios Tsirvoulis, and Mikael Granvik

Using our Space and High-Irradiance Near-Sun Simulator (SHINeS) [Tsirvoulis 2022] and high-fidelity CI asteroid simulant [Britt 2019] we recreate the vacuum, insolation and material conditions on asteroid surfaces close to the Sun (0.06 - 0.25 au). We observe instantaneous explosive events triggered solely by solar-like irradiation. Depending on the level of irradiation the process results in centimeter-sized samples to be destroyed in minutes or hours. The observed phenomenon could explain what causes active asteroids similar to (3200) Phaeton to emit particles at their closest passage to the Sun.
It may also partially explain why there is an observed lack of asteroids with small perihelion distances compared to predictions from dynamical models [Granvik 2016]. Here we present destruction time scales at different heliocentric distances, allowing us to estimate first order survival lifetime depending on distance. 

Furthermore we report on experiments to assess the influence of material parameters such as porosity and grain size on the destruction process. For this we created porous samples using a vacuum drying process, which over time inflates the samples. This enables us to control the porosity levels within our simulant samples. We then experiment with these samples of varying porosity at the same simulated heliocentric distance. This approach lets us systematically examine how variations in porosity affect the destruction timescales of the porous samples when subjected to solar-like irradiation.

We also investigated the exact mechanism of the destruction process. Initial insights suggest a correlation between the destruction process and sulfur outgassing, alongside potential chemical reactions [MacLennan 2023] occurring within the simulant material. Additionally, we observed that grain size may also influence this process. These preliminary findings hint at complex interactions between these parameters. Further research is necessary to understand the interplay of these processes in detail.

Looking ahead, the deployment of the DESTINY Dust Analyzer aboard the JAXA mission DESTINY+ presents an exciting opportunity to corroborate our experimental results in situ. By analyzing the chemical and physical properties of the dust emitted by Phaeton, the DESTINY Dust Analyzer could provide invaluable data for comparison with the materials generated in our laboratory experiments.


References:


[1] Tsirvoulis, G., Granvik, M., Toliou, A.: Shines: Space and high-irradiance near-
sun simulator. Planetary and Space Science 217, 105490 (2022) https://doi.org/
10.1016/j.pss.2022.105490
[2] Britt, D.T., Cannon, K.M., Donaldson Hanna, K., Hogancamp, J., Poch, O., Beck,
P., Martin, D., Escrig, J., Bonal, L., Metzger, P.T.: Simulated asteroid materials
based on carbonaceous chondrite mineralogies. Meteoritics amp; Planetary Science
54(9), 2067–2082 (2019) https://doi.org/10.1111/maps.13345
[3] Granvik, M., Morbidelli, A., Jedicke, R., Bolin, B., Bottke, W.F., Beshore, E.,
Vokrouhlick ́y, D., Delb`o, M., Michel, P.: Super-catastrophic disruption of asteroids
at small perihelion distances. Nature 530(7590), 303–306 (2016) https://doi.org/
10.1038/nature16934
[4] MacLennan, E., Granvik, M.: Thermal decomposition as the activity driver of
near-earth asteroid (3200) phaethon. Nature Astronomy 8(1), 60–68 (2023) https:
//doi.org/10.1038/s41550-023-02091-w

How to cite: Schirner, L., Tsirvoulis, G., and Granvik, M.: Recreating the instantaneous destruction of asteroid surfaces via sunlight, Europlanet Science Congress 2024, Berlin, Germany, 8–13 Sep 2024, EPSC2024-438, https://doi.org/10.5194/epsc2024-438, 2024.

15:25–15:35
|
EPSC2024-206
|
On-site presentation
Nicol Latsia, Johan Borg, Erika Kaufmann, Heikki Suhonen, Georgios Tsirvoulis, Mikael Granvik, and Axel Hagermann

Thermal fatigue is produced by diurnal and/or annual variations of the surface temperature on asteroids and its efficiency depends on the heliocentric distance, the rotation period, and the thermal inertia of the asteroid’s surface. A fundamental assumption of previous studies [1,2], is that thermal fatigue remains effective over thousands, or even millions, of thermal cycles. However, the Kaiser effect, extensively studied in the field of fracture mechanics on terrestrial rocks, states that fracturing on materials ceases when previously exerted load levels are not exceeded [3]. The thermal expansion coefficient of each mineral at specific temperature changes can be translated into different mechanical loads resulting from thermal fatigue.

We aim to observe the time-resolved crack propagation induced by thermal stresses over subsequent thermal load cycles in meteorites – acting as asteroid analogues – in order to understand the role of thermal fatigue in eroding asteroid surfaces using non-destructive methods. We investigate CV, CM, and, for comparison, LL chondrites to examine the behaviour of thermal fatigue on different petrographic types of meteorites. The samples are subjected to a minimum of 100 cycles at ΔT=210K as a typical temperature variation of C-type NEAs is 200K [2]. To identify the spatial occurrence of pre-existing and propagating cracks, the samples have been scanned using X-ray μCT. If the Kaiser effect is applicable, we expect to see the effects of thermal fatigue wane after a few thermal cycles, suggesting that other mechanisms, such as chemical alteration, are contributing to the breakdown process of asteroids.

[1] Delbo M. et al. 2014. Nature 508(7495) 233-236. [2] Molaro J.L. et al. 2015. JGR Planets 120(2) 255-277. [3] Kaiser J. 1950. A study of acoustic phenomena in tensile heat (PhD Thesis).

How to cite: Latsia, N., Borg, J., Kaufmann, E., Suhonen, H., Tsirvoulis, G., Granvik, M., and Hagermann, A.: Temporal variability of thermal-cycling induced fracturing in chondrites, Europlanet Science Congress 2024, Berlin, Germany, 8–13 Sep 2024, EPSC2024-206, https://doi.org/10.5194/epsc2024-206, 2024.

15:35–15:45
|
EPSC2024-315
|
On-site presentation
Maximilian Hamm, Moritz Strauß, Jens Biele, Robert Luther, Jörg Knollenberg, and Matthias Grott

Introduction: The JAXA Hayabusa2 sample return mission investigated asteroid (162173) Ryugu via remote sensing (Tsuda et al., 2013, Watanabe et al., 2019), deployed the DLR/CNES MASCOT (Ho et al., 2021), performed an artificial impact experiment (Arakawa et al., 2020) and returned samples to Earth (Yada et al., 2022). Ryugu is a rubble-pile asteroid with similarities to aqueously altered carbonaceous chondrites, in particular CI chondrites (Kitazato et al., 2021, Hamm et al., 2022, Nakamura et al. 2022, Yokoyama et al., 2022). One of the biggest surprises was the prevalence of boulders and dm-sized pebbles on the surface and the deficiency of smaller particles (Jaumann et al., 2019, Sugita et al., 2019). Such finer particles were expected to dominate the surface based on thermal inertia estimates from telescopic infrared observations (Müller et al., 2011). The MASCOT radiometer MARA and the main spacecraft’s TIR infrared imager confirmed the thermal inertia estimates from telescopic observations despite the boulder-dominated surface (Grott et al., 2019, Okada et al., 2020). The low thermal inertia was confirmed to be an intrinsic property of the boulders themselves (Grott et al., 2019, Hamm et al., 2020, Sakatani et al., 2021, Hamm et al., 2022). More specifically, the presence of a layer of dust masking the thermophysical properties of the boulder was limited to small patches of thin dust layers, or no dust at all (Biele et al., 2019, Hamm et al., 2023). In contrast to these in-situ results, the analysis of sample fragments by lock-in thermography resulted in a much higher thermal inertia more comparable to that of meteorites samples (Ishizaki et al., 2023). In this study we attempt to reconciliate the results from spacecraft observations and laboratory analysis by expanding our thermophysical mode to incorporate horizontal fractures. This procedure has been proposed by Elder et al., 2022. We investigate if it is possible to explain the MARA observations with a fracture boulder of higher bulk thermal inertia. This work has implication on the regolith gardening on asteroids like Ryugu as weak and porous boulders would respond to impacts of micro-meteorites differently than fracture boulders with low porosity (Cambioni et al., 2021).

Methods: We start from the 1D-thermal model as used in Hamm et al., 2020. The heat conduction equation is solved for a 1D grid of N points from x0 = 0 to xN  . At the lower boundary condition, the flux is set to zero. The upper boundary condition is given by the energy balance. Illumination is calculated by averaging over those DEM-facets of the boulder shape model within the MARA field of view.  The emissivity of the surface reduced by thermal reradiation as described in Hamm et al., 2023. Here we modify the model such that the heat conduction equation is given by:

ρcp ∂T/∂t = σ(T4(xd,t)- T4(xu,t))

For xu <=x <= xd, with xd the lower edge of the fracture and xu the upper  edge, i.e., closer to the surface.  Elsewhere on the grid the heat conduction equation is:

ρcp ∂T/∂t = k ∂2T/∂x2

This adaption accounts for radiative transfer across a horizontal fracture that blocks the conductive heat transfer. It is valid locally within the material if the fracture is spread far enough to neglect conduction over contact points. Also, the model assumes that the fracture is wide enough to neglect heat transfer contributions by evanescent waves (Persson and Biele, 2022).

We vary the depth of the crack and vary the thermal conductivity  of the bulk material. For specific heat capacity and density we use the bulk values of the Ryugu samples as reported in Nakamura et al., 2022:  cp = 865J/K and ρ = 1800 kg/m3. The thermal conductivity is varied such that the thermal inertia TI = (kρcp)0.5  varies from 300 to 1000 Jm-2K-1s-1/2,(units assumed hereafter).

Preliminary Results:

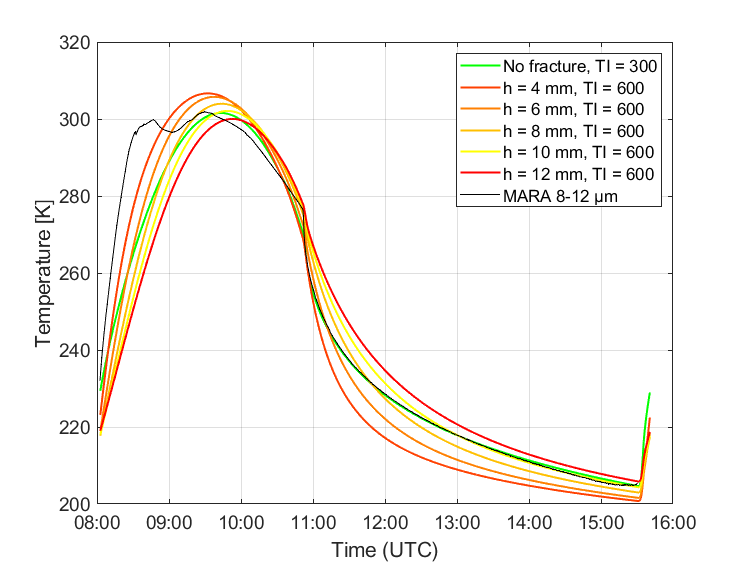
Figure 1 shows preliminary results of the thermophysical model in comparison to the surface temperature observations by MARA. For reference we show the result for a simplified thermal model with no fracture and a thermal inertia of 300 (Hamm et al., 2023). A fracture placed at 1 cm depth results in a similar nighttime temperature curve even for a bulk thermal inertia of 600. At shallow fracture depth the resulting temperature curve mainly depends on the depth of the fracture rather than bulk thermal inertia. Nevertheless, the model cannot reproduce the temperature drop after local sunset. This could be due to the simplicity of our model. It could also mean that the average thermal inertia of layer observed by MARA is lower than that of the returned sample due to a selection effect caused by the destructive sampling mechanism.  

Figure 1: Surface temperature derived from the MARA 8-12 µm filter in comparison to result of the thermopysical model with various parameters. In green is the best fitting model curve for a homogenous 1D-model with no modelled fracture. In shades of orange is the model assuming a fracture at depth h and a much higher bulk thermal inertia.

Acknowledgement: This work is funded by the Deutsche Forschungsgemeinschaft (DFG, German Research Foundation) – Project-No. 497966340. 

References:

Arakawa, M., et al. (2020), Science, 368, 6486, 67-71

Biele, J., et al., (2019), PEPS, 6:48

Cambioni, S., et al., (2021), Nature, 598(7879), 49–52

Elder, CM., (2022) AGU Fall Meeting 2022, Chicago, IL, 12-16 December 2022, id. P24D-01.

Grott, M., et al., (2019) Nat Astron. 3, 971–976

Hamm, M., et al., (2020), MNRAS, 496, 2776–2785

Hamm, M., et al., (2023), GRL, 50, e2023GL10479

Ho, T.-M. et al., (2021), PSS, 200, 105200

Ishizaki, T., et al., (2023), International  Journal  of  Thermophysics, 44(4),  51

Jaumann, R., et al., (2019), Science, 365, 817-820

Kitazato, K., et al., (2021) Nat. Astron., 5, 246-250

Müller, T.G., et al., (2011), A&A 525, A145

Nakamura, T. et al., (2022) Science, 10.1126/science.abn8671

Okada, T., et al., (2020), Nature 579, 518–522

Persson, B.N.J., and Biele, J., (2022), AIP Advances, 12(10), 105307

Sugita, S., et al., (2019), Science, 364, aaw0422

Sakatani, N., et al., (2021), Nat Astron, 5, 766-774

Tsuda, Y.  et  al.  (2013), Acta  Astronautica,  91,  356-362. 

Watanabe, S., et al., (2019), Science, 364, eaav8032

Yada, T., et al., (2022) Nat. Astron., 6, 214-220


How to cite: Hamm, M., Strauß, M., Biele, J., Luther, R., Knollenberg, J., and Grott, M.: Numerical Model of Reduction of Apparent Thermal Inertia by Interrupted Vertical Heat-Flow, Europlanet Science Congress 2024, Berlin, Germany, 8–13 Sep 2024, EPSC2024-315, https://doi.org/10.5194/epsc2024-315, 2024.

15:45–15:55
|
EPSC2024-1236
|
Virtual presentation
Edoardo Rognini, Angelo Zinzi, Veronica Camplone, Marianna Angrisani, and Monia Vadrucci

Introduction. The surface temperatures of asteroid Ryugu and the Moon have been measured by the TIR instrument onboard the Hayabusa 2 mission of JAXA [1] and the DIVINER of NASA's Lunar Reconnaissance Orbiter [2]. The comparison between observed and calculated temperature allows the retrieval of thermophysical properties of an object; this is a link with the primordial solar system, since the physical structure and composition can be retrieved. Furthermore, the thermal inertia causes an asimmetric thermal emission and non gravitational perturbation on orbital parameters (Yarkovsky effect). In the lunar case, an indication for future landing sites may be also possible.

Methods. We developed a thermophysical model for the calculation of surface temperature as function of thermal inertia and emissivity [3]. The temperatures can be projected on the target shape model with the MATISSE tool [4].

Results and future work. Some theoretical lunar temperatures have been checked with the measurements of the DIVINER instrument. In the future we want to study the permanently shadowed areas. The comparison theoretical-observed temperature for Ryugu will allow to properly modelize the rubble-pile asteroids.

References.

[1] Okada, T., et al. (2017), Space Sci. Rev., 208

[2] Paige, D. A., et al. (2010), Space Sci. Rev., 150

[3] Rognini, E., et al. (2019), Journal of Geophysical Research: Planets, 125

[4] Zinzi, A., et al. (2016), Astronomy and Computing, 15

How to cite: Rognini, E., Zinzi, A., Camplone, V., Angrisani, M., and Vadrucci, M.: Thermal Analysis of 162173 Ryugu and the Moon, Europlanet Science Congress 2024, Berlin, Germany, 8–13 Sep 2024, EPSC2024-1236, https://doi.org/10.5194/epsc2024-1236, 2024.

15:55–16:00

Orals: Tue, 10 Sep | Room Neptune (Hörsaal D)

Icy Objects: Comets, Moons, TNOs
08:30–08:40
|
EPSC2024-22
|
On-site presentation
Christopher Kreuzig, Gerwin Meier, Christian Schuckart, Moritz Goldmann, Johanna Noria Brecher, and Jürgen Blum

The formation of a cometary dust tail is phenomenon that has been known for a very long time and can be seen from earth with the naked eye if the comet is close enough. The mechanism for the formation of the cometary dust tail is believed to be caused by the sublimation of volatile components, which drag away the dust particles. In the lab, we aim to reproduce this effect by placing mixtures of ice and dust in a cooled vacuum chamber and illuminating them with an artificial sun. In preparation of these experiments, we placed samples consisting entirely of µm-sized spherical water-ice grains in the chamber. As soon as the illumination is turned on, solid particles are being ejected from the surface, hence the water-ice sample ejects a fraction of its own mass in the form of solid grains, which are accelerated by the surrounding gas. We analysed the particle motion, using multiple cameras in high-speed and low-speed mode, as well as a scale, a mass spectrometer, an infrared camera, several distributed temperature sensors and a scanning line-laser system. From the high-speed camera images, we determined that most of the ejected particles are flat disks with a height of ∼ 20 µm and a diameter of ∼  80 µm. Furthermore, we performed 3D particle tracking to gain information about the trajectories and accelerations of the particles. We discovered that the speed of the particles at the first image visible in the cameras is much higher than expected. From that point on, the particle trajectories can be fit with the expected value for a gas-driven acceleration with and a gas-flow rate determined by the surface temperature using the Hertz-Knudsen equation. However, if we extrapolate the trajectory backwards in time using the same acceleration, the zero-velocity starting point of the particles would be several centimeters below the sample surface. Since this is impossible, the particles must possess an unresolved starting acceleration about tenfold higher than what could be explained by the vapour pressure of the water ice. This finding means that the initial acceleration must be driven by another process, which we aim to explain by thermal modelling and by combining data from all instruments used during the experiments.

How to cite: Kreuzig, C., Meier, G., Schuckart, C., Goldmann, M., Brecher, J. N., and Blum, J.: Experimental results from the CoPhyLab - determination of particle size and acceleration in comet-simulation experiments, Europlanet Science Congress 2024, Berlin, Germany, 8–13 Sep 2024, EPSC2024-22, https://doi.org/10.5194/epsc2024-22, 2024.

08:40–08:50
|
EPSC2024-21
|
ECP
|
On-site presentation
Gerwin Meier, Christopher Kreuzig, and Jürgen Blum

Water is the driving force of life as we know it. Therefore, it is essential to study its properties and behaviour in various environments. In outer space, water occurs, e.g., in comets. Measurements on comets are challenging and expensive. Thus, it is easier to simulate the environment of outer space in the laboratory.

One laboratory where this environment can be simulated is the Comet Physics Laboratory (CoPhyLab) at the TU Braunschweig. Outer space is simulated with a thermal vacuum chamber enabling pressures as low as 106mbar and temperatures of around 100 K. Insolation, either permanent or following a diurnal cycle, can be simulated via a focused halogen lamp and rotating shutter blades. With this setup, the most abundant ingredients of comets, i.e. granular water ice and dust, can be studied in their natural environment and repetitive measurements can be performed.

One observed property of comets, which is not yet fully understood on a physical basis, is the ejection of dust particles due when approaching the sun. In the CoPhyLab, this dust activity can be quantitatively measured by the difference of total mass loss and mass loss by ice sublimation alone. The latter can be measured with a mass spectrometer and can, furthermore, be inferred from the surface temperature measured by an infrared camera and using the Hertz-Knudsen equation for the sublimation of water ice. The total mass loss of the sample on the other hand can either be measured by using a scale or by measuring the shrinking volume of the sample via a line laser system. The combination of all instruments determines the ratio of mass loss in gas and particles and its evolution over time.

The latest results on the dust and gas activity of granular ice samples under different illumination conditions will be presented, from which ideas of the enigmatic dust-emission mechanism can be formulated.

How to cite: Meier, G., Kreuzig, C., and Blum, J.: Experimental results from the CoPhyLab – determination of the mass loss balance, Europlanet Science Congress 2024, Berlin, Germany, 8–13 Sep 2024, EPSC2024-21, https://doi.org/10.5194/epsc2024-21, 2024.

08:50–09:00
|
EPSC2024-834
|
ECP
|
On-site presentation
Linus Stoeckli, Rafael Ottersberg, Antoine Pommerol, and Nicolas Thomas

The exact physical structure of the interior of comets is unknown. Further in-situ exploration is required to discover the relationship between non-volatile and volatile materials.

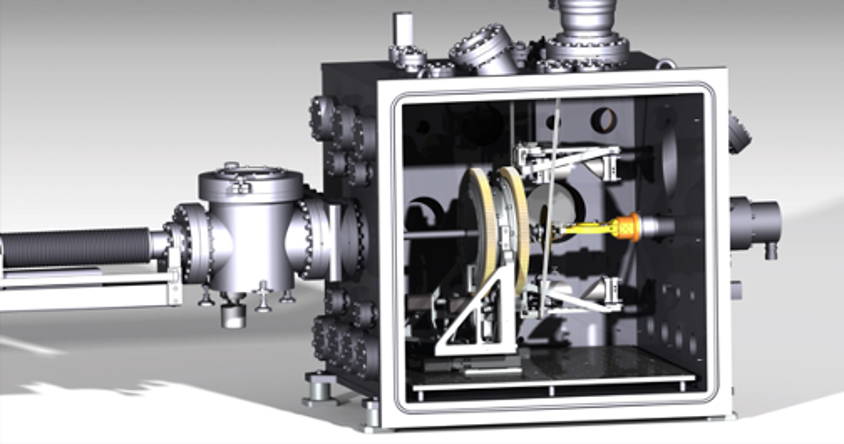
Advancements in the last decades have been able to close the THz gap, thus allowing the study of materials between microwave and IR wavelengths. THz spectroscopy is being used more and more to analyze materials and study the hydration of samples. This makes the application of THz spectroscopy promising for investigations in resolving the sub-surface structure of comets. Our novel laboratory setup COCoNuT (Characteristic Observation of Cometary Nuclei using THz-spectroscopy) provides the capabilities to simulate the conditions we would encounter on a comet.

Figure 1: A rendered image of the CAD model of our in-house designed vacuum chamber. To the left we see the load-lock chamber, which enables us to exchange the sample without flooding the main chamber. The sample holder (yellow) is then pushed along the central axis of the goniometer and pressed onto the cryo-cooler. The goniometer is mounted on an x-y stage, enabling us to scan the sample. A window is attached diagonally onto the right hand side of the chamber, which will server as a mounting point for a solar simulator (lamp). By shining light onto the sample we expect to observe sublimation.

The vacuum chamber contains a commercial time domain THz-spectrometer to perform proof-of-concept measurements with frequencies from 0.1 THz to 5 THz. The in-house produced simulants, consisting of water ice and cometary dust analogues, can either be measured in transmission or reflection and at various pressures down to 10-7 mbar and temperatures down to 50 K. As opposed to ground penetrating radar, THz-spectroscopy provides a better resolution (sub-centimeter) while still penetrating the surface layer on a centimeter level.

Due to the fingerprint absorption spectrum of water vapor, THz-spectroscopy can also be used to analyze the sublimation above the surface. Analyzing the ejection of small particles can provide information about the sub-surface structure as well.

The findings of our proof-of-concept setup will lay the groundwork for a future in-situ mission to a comet.

We present our first measurements with our newly built setup.

How to cite: Stoeckli, L., Ottersberg, R., Pommerol, A., and Thomas, N.: Observing Cometary Simulants using THz-Spectroscopy, Europlanet Science Congress 2024, Berlin, Germany, 8–13 Sep 2024, EPSC2024-834, https://doi.org/10.5194/epsc2024-834, 2024.

09:00–09:10
|
EPSC2024-1071
|
ECP
|
On-site presentation
Fernando Tinaut-Ruano, Julia Maria de Leon, Juan Luis Rizos, Eri Tatsumi, Noemí Pinilla-Alonso, Faith Vilas, and Amanda Hendrix

Giant planets have numerous moons with various origins and evolutionary paths. During their formation, they had disks of material, whereas regular satellites formed similarly to planetesimals in the solar disk. During their migration, they also captured objects in their orbits, known as irregular satellites. Iapetus is Saturn’s third largest and second oldest regular satellite, with only Phoebe being older (Bottke et al., 2024). It is tidally locked and embedded in Phoebe’s ring. Its orbit and tidal location suggest significant impacts during its formation (Bottke et al., 2024). Iapetus has intrigued researchers for decades due to its extreme albedo bimodality, with one hemisphere very dark (2-6%) and the other much brighter (50-60%). The dark material’s origin has been debated: Cook & Franklin (1970) suggested an exogenic origin, while Smith et al. (1981, 1982) proposed geological activity. Burns et al. (1979), Porco et al. (2005), and Filacchione et al. (2010) supported the exogenic hypothesis, naming Phoebe as the source. However, spectral analyses by Cruikshank et al. (1983) and others found discrepancies between Iapetus and Phoebe’s spectra. Le Gall et al. (2019) stated the dark contaminant must be present at certain depths, as observed by Arecibo radar. Other potential sources include debris from regular moons or impacts from irregular satellites (Thomas & Veverka, 1985; McDonald et al., 1994; Owen et al., 2001; Buratti et al., 2005b). The nature of the dark material remains uncertain. Our work aims to explore NUV data from the Cassini-Huygens spacecraft to gain new insights into Iapetus’ dark terrain.

We used high spatial resolution images and Visual to IR spectra of the surface of Iapetus, a moon of Saturn, observed by the NASA-ESA Cassini-Huygens spacecraft (Cassini spacecraft, hereafter). This mission, launched in 1997, was conceived to study the planet Saturn, its rings, and its family of icy moons. The spacecraft orbited Saturn between 2004 and 2017, and in September of that year, it plunged into the planet’s atmosphere in what was called "the Grand Finale." We used the Imaging Science Subsystem (ISS), composed of two CCDs with different fields of view. The Narrow-Angle Camera (NAC) had 24 filters mounted in a wheel, allowing it to take images in multiple wavelengths between 0.2 to 1.1 μm. In 2007 this spacecraft made the closest flybys over Iapetus, taking high spatial resolution images in 4 filters between 0.34 and 0.75 μm during each pass, covering 50 deg in longitude and 30 deg in latitude with a resolution of a hundred meters. We also used the Visible and Infrared Mapping Spectrometer (VIMS) which covered from 0.35 to 5.1 μm. This instrument allowed us to study the 3μm absorption band but with a spatial resolution of several kilometers per pixel. Both instruments observed the same region allowing us to compare the reflectance in both wavelength ranges.

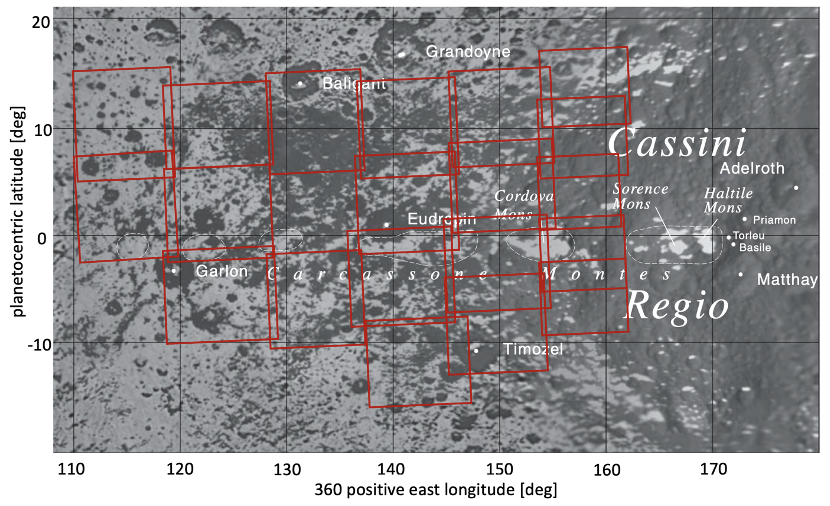
Preliminary analysis of different regions on the Iapetus surface made us focus on the transition region between the icy and the dark faces, as there was local variability in the NUV reflectance of the primitive material. Thus, we decided to use the highest spatial resolution images in different filters along this region, see its footprint in Fig. 1.

  • Figure 1– ISS footprints of the final regions analyzed in this work. It is important to notice that the images were taken in the transition region between the icy trailing face and the dark leading face.


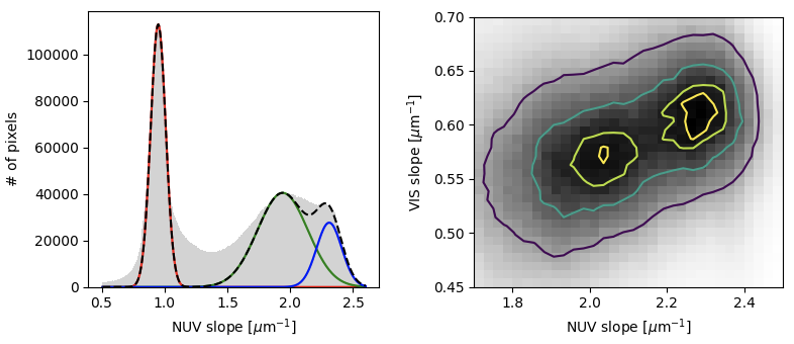
From the analysis of the distribution of the NUV slope values in the transition region between the ice and dark hemispheres of Iapetus, we obtained three different populations on its surface: the ice (red curve on Fig. 2), and two different populations of dark material (green and blue curves on Fig. 2). We showed an agreement in the NUV slope of one of the found populations with the lithosphere of Iapetus. The other population is located in the leading face of the moon and is assumed to have an exogenous origin (e.g., Porco et al., 2005). Using the NUV slope of high spatial resolution we were able to infer the IR spectra for the unresolved lithospheric material at each VIMS pixel. We compare the IR spectra between the lithospheric and the exogenous material trying to infer different compositions.

  • Figure 2 – Left panel: Histogram of computed NUV slope values for the transition region shown in Fig. 1 (red squares). We added a dashed black curve and its individual components in solid red, green and blue lines, associated with ice, and two dark components respectively. Right panel: Density plot of the visible versus NUV spectral slopes centered on the values of the dark material. Isolines at 50, 75, 90 and 95 % of the maxima are shown in purple, blue, green, and yellow, respectively, clearly showing two populations


Furthermore, we found a correlation between the UV and the 3 μm absorptions in the exogenous material, similar to the one we detected in Tatsumi et al. (2023) for primitive asteroids. (see Fig. 3).

  • Figure 3– Density plot of IR slope (between 3.3 and 3.7 μm)  from VIMS spectra versus UV slope from ISS photometry. Both are proxies of the respective band depths.


Finally, we found a systematic deeper UV absorption in the interior of the craters than in their surroundings. As craters’ interiors are fresher than their surroundings this result points to an observational proof of space weathering shallowing the UV absorption band, as proposed by Hendrix & Vilas (2019). However, an age estimation of the surface is needed to make this conclusion stronger.

How to cite: Tinaut-Ruano, F., de Leon, J. M., Rizos, J. L., Tatsumi, E., Pinilla-Alonso, N., Vilas, F., and Hendrix, A.: The Iapetus’ case: NUV as tracer of two populations of dark material, Europlanet Science Congress 2024, Berlin, Germany, 8–13 Sep 2024, EPSC2024-1071, https://doi.org/10.5194/epsc2024-1071, 2024.

09:10–09:15
09:15–09:25
|
EPSC2024-419
|
On-site presentation
Bruno Reynard and Christophe Sotin

Current models suggest the five regular moons of Uranus formed rapidly from a planetary disk after a giant impactor hit Uranus and caused its large spin axial tilt of ~98° (Ida et al., 2020; Woo et al., 2022). A power-law relationship between size and density of moons evidences varying rock/ice ratios in the moons. This relationship is not well described by differential diffusion of rock and ice in the disk (Woo et al., 2022). We find that this relationship is well explained by a mild enrichment of rock with respect to ice in the solids that aggregate to form the moons, following Rayleigh law for distillation (Rayleigh, 1896). In this model, moon composition and density reflect their order of formation in a closed-system circumplanetary disk. For Uranus, the largest and densest moons Titania and Oberon (R ~ 788 and 761 km, respectively) first formed, then the mid-sized Umbriel and Ariel (585 and 579 km), satellites in each pair forming simultaneously with similar composition, and finally the small rock-depleted Miranda (236 km). Fractionation of rock and ice during aggregation of planets and moons may occur in other planetary disks. Rayleigh distillation in the Saturnian disk may for instance account for early formation of rock-poor Rhea, Iapetus and Tethys. This mechanism adds to those affecting the composition of accreting planets and moons in disks such as temporal/spatial variation of disk composition due to differential diffusion, advection, and large impacts. 

Ida, S., Ueta, S., Sasaki, T., Ishizawa, Y., 2020. Uranian satellite formation by evolution of a water vapour disk generated by a giant impact. Nature Astronomy 4, 880-885.

Rayleigh, L., 1896. L. Theoretical considerations respecting the separation of gases by diffusion and similar processes. The London, Edinburgh, and Dublin Philosophical Magazine and Journal of Science 42, 493-498.

Woo, J.M.Y., Reinhardt, C., Cilibrasi, M., Chau, A., Helled, R., Stadel, J., 2022. Did Uranus' regular moons form via a rocky giant impactor? Icarus 375, 114842.


How to cite: Reynard, B. and Sotin, C.: Formation of Uranus regular satellites: insights into planetary accretion and differentiation in spreading disks, Europlanet Science Congress 2024, Berlin, Germany, 8–13 Sep 2024, EPSC2024-419, https://doi.org/10.5194/epsc2024-419, 2024.

09:25–09:35
|
EPSC2024-46
|
On-site presentation
Pierre Vernazza, Laurent Jorda, Marin Ferrais, Pierre Beck, Tanjona Ralaimihoatra, Michael Marsset, Sarah Anderson, Francesca DeMeo, Richard Binzel, and Paul Simon

Decades of observations have provided a preliminary understanding of the architecture of our solar system and of the compositional distribution among inner (<5AU; see Vernazza & Beck 2017 for a review) and outer solar system small bodies (e.g., Barucci & Merlin 2020). Previous observations have revealed a number of puzzling features in each dynamical population of small bodies including the compositional distribution and diversity of the asteroid belt, the inclination distribution of the Jupiter and Neptune Trojans, and the peculiar orbital distribution of TNOs. These findings have led the path to new models of the formation and evolution of the solar system, notably the Nice model (e.g., Morbidelli et al. 2005, Levison et al. 2009, Nesvorny et al. 2018). In turn, the Nice and other models make predictions about the small bodies that must be verified to validate or dismiss these models.

In order to probe the dynamical and chemical evolutionary scenarios that would explain their present-day compositions, we measured the mid-infrared spectral properties of 4 Centaurs (representing bodies formerly in the Kuiper Belt) with JWST/MIRI (GO 2820, PI: Pierre Vernazza) over the 5-28 micron range. These observations will provide elements of answers to the following fundamental yet still open questions:

Question 1:  What types of silicates are present among Centaurs and TNOs? The use of MIRI in spectroscopic mode over the 5–28-micron range allows us to characterize the composition of the silicates as done in the past for comets and Jupiter Trojans with the Spitzer space telescope (e.g., Emery et al. 2006, Vernazza et al. 2012, 2015). This is the ideal wavelength range for detecting fine-grained silicates and characterizing their composition as they display strong emissivity bands.

Question 2: Are there compositional differences between less red and very red objects that would inform us about a compositional heterogeneity in the protoplanetary disk at heliocentric distances greater than ~10 AU? Our proposed observations will shed light on possible compositional differences (in terms of silicate mineralogy, and in particular the amorphous/crystalline and the olivine/pyroxene ratios) between less red and very red objects and may thus provide unique constraints on the primordial heliocentric compositional gradient in the outer (~15-35 AU) protoplanetary disk.                           

Question 3:  Do inner solar system P/D-type asteroids and Jupiter Trojans share the same origin as Centaurs, hence TNOs?  The ways in which these object classes are potentially linked are explained in the Nice model. The most up-to-date version of that model (Nesvorny et al. 2018, Morbidelli & Nesvorny 2020) - invoking an outward migration of Uranus and Neptune during the first 100 My of solar system history - implies that the P/D-type main belt asteroids (MBAs) and the Trojans of Jupiter could be compositionally related to outer small bodies such as Centaurs, short-period comets and small (D<300km) TNOs. Spectroscopy with JWST/MIRI of Centaurs (former small TNOs)  is essential for establishing a definitive link between these presently dynamically isolated populations by probing the mineralogical composition of the silicates present at the objects’ surfaces. Unlike ices and organics, silicates are thermally stable over the considered heliocentric range that goes from the main belt to the Kuiper Belt and thus appear as the only robust tracers of a primordial common origin. It is actually the presence of similar silicate emission features in the mid-infrared spectra of P/D MBAs, Jupiter Trojans, and comets that previously succeeded in establishing a likely common origin for these bodies (e.g. Emery et al. 2006, Vernazza et al. 2015).

Here, we will present an overview of the results obtained from this JWST Cycle 2 observing program.  

How to cite: Vernazza, P., Jorda, L., Ferrais, M., Beck, P., Ralaimihoatra, T., Marsset, M., Anderson, S., DeMeo, F., Binzel, R., and Simon, P.: Deciphering the silicate composition of Centaurs and small TNOs , Europlanet Science Congress 2024, Berlin, Germany, 8–13 Sep 2024, EPSC2024-46, https://doi.org/10.5194/epsc2024-46, 2024.

Origin and Structure
09:35–09:50
|
EPSC2024-14
|
solicited
|
On-site presentation
Michaël Marsset, Pierre Vernazza, Miroslav Brož, Cristina Thomas, Francesca DeMeo, Brian Burt, Richard Binzel, Vishnu Reddy, Allison McGraw, Chrysa Avdellidou, Benoit Carry, Stephen Slivan, and David Polishook

Studies of micrometeorites in mid-Ordovician limestones and Earth’s impact craters indicate that our planet witnessed a massive infall of ordinary L chondrite material ~466 million years (My) ago (Heck et al. 2017, Schmieder & Kring 2020, Kenkmann 2021) that may have been at the origin of the first major mass extinction event (Schmitz et al. 2019). The breakup of a large asteroid in the main belt is the likely cause of this massive infall. In modern times, material originating from this breakup still dominates meteorite falls (>20% of all falls) (Swindle et al. 2014). We will present spectroscopic observations and dynamical evidence that the Massalia collisional family is the only plausible source of this catastrophic event and of the most abundant class of meteorites falling on Earth today.

How to cite: Marsset, M., Vernazza, P., Brož, M., Thomas, C., DeMeo, F., Burt, B., Binzel, R., Reddy, V., McGraw, A., Avdellidou, C., Carry, B., Slivan, S., and Polishook, D.: The Massalia asteroid family as the origin of ordinary L chondrites, Europlanet Science Congress 2024, Berlin, Germany, 8–13 Sep 2024, EPSC2024-14, https://doi.org/10.5194/epsc2024-14, 2024.

09:50–10:00
Coffee break
Origin and Structure (continued)
10:30–10:45
|
EPSC2024-409
|
solicited
|
On-site presentation
Chrysa Avdellidou, Marco Delbo, David Nesvorny, Kevin Walsh, and Alessandro Morbidelli

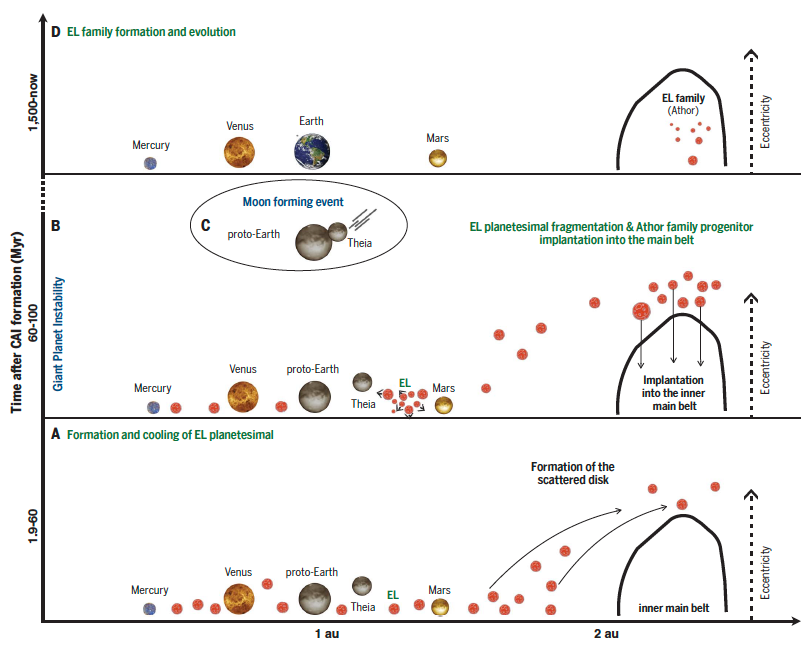
The identification of meteorite parent bodies provides the context for understanding planetesimal formation and evolution as well as the key solar system dynamical events they have witnessed. We identified that the family of asteroid fragments whose largest member is asteroid (161) Athor is the unique source of the rare EL enstatite chondrite meteorites (Avdellidou et al. 2022), the closest meteorites to Earth in terms of their isotopic ratios. The Athor family was produced by the collisional fragmentation of a parent body 3 Gyr ago in the inner main belt (Delbo et al. 2019), however the diameter of the Athor family progenitor was much smaller than the putative size of the EL original planetesimal (Triellof et a. 2022). Therefore, we deduced that the EL planetesimal that accreted in the terrestrial planet region underwent a first catastrophic collision in that region, and one of its fragments (the progenitor of the Athor family) suffered a more recent catastrophic collision in the main belt, generating the current source of the EL meteorites.

How and when did the Athor family progenitor implanted into the inner main belt?

To answer this question we used an interdisciplinary methodology where we combined laboratory meteorite thermochronometric data, thermal modelling, and dynamical simulations. 

First we showed that planetesimal fragments from the terrestrial planet zone must have been implanted into the main asteroid belt at least 60 Myr after the beginning of the solar system in order to explain the EL thermochronometric data. Then we investigated the possible dynamical ways that could have implanted the Athor family progenitor in its current position in the inner main belt. 

We concluded that the giant planet instability is the only dynamical process that can enable such implantation so late in the solar system timeline (Avdellidou et al. 2024). The low limit of the instability window at 60 Myr is defined by the earliest time that the EL planetesimal could have been broken, while the upper limit at 100 Myr had been defined by the survival of the Patroclus-Menoetius Jupiter trojan binary asteroid (Nesvorny et al. 2018). The giant impact that formed the Moon occurred within this range, so it might be related to the giant planet instability.


Acknowledgements. We acknowledge support from the ANR ORIGINS (ANR- 18-CE31-0014) and European Research Council advanced grant no. 101019380. This work is based on data provided by the Minor Planet Physical Properties Catalogue (MP3C) of the Observatoire de la Côte d’Azur (mp3c.oca.eu).

References

Avdellidou, Delbo, A. Morbidelli, Walsh, Munaibari, Bourdelle de Micas, Devogèle, Fornasier, Gounelle, & van Belle. Athor asteroid family as the source of the EL enstatite meteorites, 2022, A&A, 665, id.L9, 13 pp.

Delbo, Avdellidou, & Morbidelli, Ancient and primordial collisional families as the main sources of X-type asteroids of the inner main belt, 2019, A&A, 624, A69 

Trieloff, Hopp & Gail. Evolution of the parent body of enstatite (EL) chondrites, 2022, Icarus, 373, 114762

Nesvorny,Vokrouhlický, Bottke, Levison, Evidence for very early migration of the Solar System planets from the Patroclus-Menoetius binary Jupiter Trojan, 2018, Nature Astronomy, 2, 878–882

Avdellidou, Delbo, Nesvorny, Walsh, Morbidelli, Dating Solar System's giant planet instability with enstatite meteorites, 2025, Science, 384, 348–352 

How to cite: Avdellidou, C., Delbo, M., Nesvorny, D., Walsh, K., and Morbidelli, A.: Enstatite chondrite meteorites date the giant planet instability , Europlanet Science Congress 2024, Berlin, Germany, 8–13 Sep 2024, EPSC2024-409, https://doi.org/10.5194/epsc2024-409, 2024.

10:45–10:55
|
EPSC2024-368
|
On-site presentation
Wladimir Neumann, Audrey Bouvier, and Mario Trieloff

Context

Observations by Hayabusa2 revealed that Ryugu is dominated by aqueously altered material spectrally similar to CI and CM chondrites [1]. In the context of accretion times suggested for water-bearing CI, CM, CR, and Flensburg chondrites of ≈3-3.9 Ma, ≈3-3.8 Ma, ≈3.7 Ma, and ≈2.7 Ma [2-5] after the formation of Ca-Al-rich inclusions (CAIs), respectively, this could imply a relatively late accretion in the carbonaceous reservoir of the protoplanetary disk. Porosity evolution modeling [4] suggested two options for Ryugu’s parent body: an accretion time of ≈2-3 Ma, a radius of <10 km, and a throughout highly porous interior or a radius of up to hundred km, but a high porosity only in a surface layer, from which Ryugu’s material was produced. Later studies support a small parent body [6,7].


Data

Conclusive constraints on the parent body age were expected from Hayabusa2 sample analysis. Recent lab work confirms aqueous alteration and indicates a strong similarity of Ryugu’s material with CI chondrites [8]. In particular, thermo-chronological investigations that provide precise dating of the formation or cooling ages of various mineralogical components after the parent body accretion have been carried out [7-9]. However, there are still strongly conflicting results on Mn-Cr dating of carbonates, specifically dolomite. While [7] infer dolomite formation within 1.8 Ma after CAIs and suggest a <10 km radius planetesimal, which, therefore, accreted even earlier, [8] infer 5.2 Ma after CAIs, allowing a much later accretion than within 1.8 Ma and a much larger parent body radius than 10 km. In particular, ages inferred spread from 0.4 Ma or 0.8 Ma after CAIs at a closure temperature of 283 K [7], over 2.6 Ma at 288 K [9], to 5.2 Ma at 310 K [8]. The age derived by [8] is equal within uncertainties with the Mn-Cr dolomite age of CI chondrites of 5.5 Ma [3].


Results

The meteorite record provides only weak accretion time estimates from chondrule or mineral phases’ formation ages, and no information about the parent body sizes. However, thermal evolution and differentiation modeling provides a valuable tool that can be combined with the sample chronology derived from lab work in order to constrain the parent body accretion time, size, internal structure, and the depths samples originate from [e.g., 10].

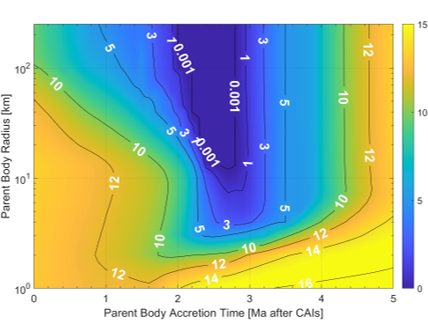
We fit thermal evolution models to the thermo-chronological data of CI chondrites and Ryugu in separate parent bodies and also of Ryugu and CI data assuming the same parent body. Our fits indicate radically different accretion times for different Mn-Cr Ryugu sample ages. The Ryugu parent body accretion times derived range from 0 Ma for the data from [7] to 3 Ma for the data from [8], while the CI PB accretes between 2 and 2.8 Ma after CAIs and has a radius of >10 km (Figure 1). Accretion times obtained for Ryugu for the data from [8] and [9] agree with the interval of 2-3 Ma derived by [4]. Parent body radius estimates of >2 km or >4 km can be provided only for fits to the data from [9] and [8], respectively. However, bodies that fit the data from [7] or [9] best, experience too strong heating in the interior and are largely dehydrated.

Fitting Ryugu and CI data in one and the same parent body produces a good fit quality only for the late Mn-Cr age from [8]. In this case, the accretion time is ≈2.8 Ma, which is still consistent with the result by [4]. However, in this case the parent body radius is >10 km.


Figure 1: Quality of the fit of thermal evolution models to the CI dolomite Mn-Cr data. Exceptionally good fits are obtained for an accretion time interval of 2-2.8 Ma after CAIs and a radius of >10 km.


Discussion

These results suggest accretion times for Ryugu’s parent body and for the CI parent body that are closer to that of the parent body of the Flensburg chondrite and are earlier by ≈0.7 Ma than the accretion of the CR parent body [5] as well as previous estimates for the CI and CM parent bodies [2-4].

Only weak estimates of the parent body size of >2 km or >4 km for the Ryugu data from [9] and [8] are marginally consistent with a parent body radius of <10 km suggested by [4] if a throughout porous interior is required. An estimate of >10 km for the Ryugu [8] and CI [3] data fitted in one object implies an alternative structure suggested by [4] and [11] with a consolidated interior and a porous surface layer. Shallow layering depths, e.g., ≈5 km for Ryugu samples (assuming Mn-Cr age from [8]) and ≈12 km for CI samples fitted in a planetesimal radius of 100 km that accretes at 2.7 Ma are consistent with this structure. A deeper layering for CI samples is consistent with lower porosities of CI chondrites than for Ryugu samples. In such a case, high-porosity material represented only a small outer fraction of the parent body volume from which Ryugu’s material originates.


References

[1] Sugita S. et al. (2019) Science 364, eaaw0422.

[2] Fujiya W. et al. (2012) Nature Communications 3, 627.

[3] Fujiya W. et al. (2013) EPSL 362, 130-142.

[4] Neumann W. et al. (2021) Icarus 358, 114166.

[5] Neumann W. et al. (2024) Scientific Reports, under revision, arXiv:2302.13303.

[6] Tang, H. et al. (2023) The Planetary Science Journal 4, 144.

[7] McCain K. A. et al. (2023) Nature Astronomy 7, 309-317.

[8] Yokoyama T. et al. (2023) Science 379, eabn7850.

[9] Nakamura T. et al. (2023) Science 379, eabn8671.

[10] Neumann W. et al. (2023) The Planetary Science Journal 4, 196.

[11] Grott M. et al. (2019) Nature Astronomy 3, 971-976.

How to cite: Neumann, W., Bouvier, A., and Trieloff, M.: Constraining the accretion time of Ryugu’s parent body from the chronological record of samples returned by Hayabusa2, Europlanet Science Congress 2024, Berlin, Germany, 8–13 Sep 2024, EPSC2024-368, https://doi.org/10.5194/epsc2024-368, 2024.

10:55–11:05
|
EPSC2024-366
|
On-site presentation
Marco Delbo, Chrysa Avdellidou, Marjorie Galinier, and Laurent Galluccio

We present our observational survey devoted to the search of asteroids with a spectral class that is consistent with an olivine-rich composition. We will present our findings and their implications for the "missing mantle problem" (Burbine et al., 1996). This issue is a long-standing question in planetary science that refers to the observed scarcity of olivine-rich asteroids in the main belt. This scarcity appears to contrast with the theories suggesting that differentiated asteroids, which contain substantial amounts of olivine, should have been abundant during the early stages of our solar system's formation (e.g. Kruijer et al., 2014).

Our observational survey is based on reflectance spectra of solar system objects obtained in the visible light by ESA’s Gaia space mission (Galluccio et al., 2022). We show that analysis of Gaia spectra reveals that asteroids with a spectral class that is consistent with an olivine-rich composition are overabundant of more than a factor of 10 compared to previous results of ground based telescopic surveys dedicated to detection these type of asteroids (DeMeo et al., 2019).

We followed up several of these asteroids by obtaining near infrared spectra using the SpeX instrument (Rayner et al., 2003) at the NASA Infrared Telescope Facility (IRTF). We then combined Gaia visible and IRTF near-infrared spectra to obtain a more compositionally diagnostic description of the reflectance of these asteroids than that offered by the Gaia data alone.

We will discuss how the abundance of Gaia olivine-rich asteroid is dependent on the heliocentric distance, possibly contrasting with previous findings (DeMeo et al., 2019). A first collisional family discovered to be mostly populated by potentially olivine-rich asteroids has been reported earlier this year (Galinier et al., 2024). Here, we will also discuss the existance of olivine rich asteroids in collisional families, which are logical to be expected to form from the break-up of a differentiated parent body.


References:

Burbine, T.H., Meibom, A., Binzel, R.P., 1996. Mantle material in the main belt: Battered to bits? Meteoritics and Planetary Science 31, 607–620. https://doi.org/10.1111/j.1945-5100.1996.tb02033.x

DeMeo, F.E., Polishook, D., Carry, B., Burt, B.J., Hsieh, H.H., Binzel, R.P., Moskovitz, N.A., Burbine, T.H., 2019. Olivine-dominated A-type asteroids in the main belt: Distribution, abundance and relation to families. Icarus 322, 13–30. https://doi.org/10.1016/j.icarus.2018.12.016

Galinier, M., Delbo, M., Avdellidou, C., Galluccio, L., 2024. Discovery of the first olivine-dominated A-type asteroid family. A&A 683, L3. https://doi.org/10.1051/0004-6361/202349057

Galluccio, L., Delbo, M., Angeli, F.D., Pauwels, T., Tanga, P., Mignard, F., Cellino, A., Brown, A., Muinonen, K., Penttilä, A., Jordan, S., 2022. Gaia Data Release 3: Reflectance spectra of Solar System small bodies. A&A. https://doi.org/10.1051/0004-6361/202243791

Kruijer, T.S., Touboul, M., Fischer-Gödde, M., Bermingham, K.R., Walker, R.J., Kleine, T., 2014. Protracted core formation and rapid accretion of protoplanets. Science 344, 1150–1154. https://doi.org/10.1126/science.1251766

Rayner, J.T., Toomey, D.W., Onaka, P.M., Denault, A.J., Stahlberger, W.E., Vacca, W.D., Cushing, M.C., Wang, S., 2003. SpeX: A Medium‐Resolution 0.8–5.5 Micron Spectrograph and Imager for the NASA Infrared Telescope Facility. PUBL ASTRON SOC PAC 115, 362–382. https://doi.org/10.1086/367745


Acknowledgments:

We acknowledge financial support from CNES, the Action Specifique Gaia, the Programme National de Planetologie, and the ANR ORIGINS (ANR-18-CE31-0014). This work has made use of data from the European Space Agency (ESA) mission Gaia (http://www. cosmos.esa.int/gaia), processed by the Gaia Data Processing and Anal- ysis Consortium (DPAC, https://www.cosmos.esa.int/web/gaia/dpac/ consortium). Funding for the DPAC has been provided by national institutions, in particular the institutions participating in the Gaia Multilateral Agreement. The authors made use of the great SpeX instrument at the Infrared Telescope Facility, which is operated by the University of Hawaii under contract 80HQTR19D0030 with the National Aeronautics and Space Administration. This work is based on data provided by the Minor Planet Physical Properties Catalogue (mp3c.oca.eu) of the Observatoire de la Côte d’Azur.

How to cite: Delbo, M., Avdellidou, C., Galinier, M., and Galluccio, L.: Gaia reflectance spectra reveal unexpected abundance of asteroids potentially originating from the mantle of differentiated bodies.  , Europlanet Science Congress 2024, Berlin, Germany, 8–13 Sep 2024, EPSC2024-366, https://doi.org/10.5194/epsc2024-366, 2024.

11:05–11:10
11:10–11:20
|
EPSC2024-267
|
On-site presentation
Sonia Fornasier, Elisabetta Dotto, Pasquale Panuzzo, Marco Delbo, Irina Belskaya, Yuri Krugly, Raguli Inasaridze, Maria Antonietta Barucci, Davide Perna, John Brucato, and Mirel Birlan

The Japan Aerospace Exploration Agency's (JAXA) Hayabusa2 mission, following the successful return of samples of the near-Earth asteroid (NEA, 162173) Ryugu, in December 2020, has been extended to explore two more NEAs. These are (98943) 2001 CC21, which is scheduled for a flyby in 2026, and the fast-spinning 1998 KY26, for a rendez-vous on 2031. The extended mission has been named Hayabusa2#, where the # character stands for "SHARP" (Small Hazardous Asteroid Reconnaissance Probe). Several observing campaigns of these two targets have been and will be carried out to better understand their physical properties in support of the Hayabusa2# mission, and to optimize the observing strategy.

In this work we present a new estimate of the size, albedo and rotational period of 2001 CC21. This is based on observations of 2001 CC21 spectral energy distribution in the thermal infrared obtained by NASA’s Spitzer Space Telescope and new ground-based photometric observations carried out at the 3.5m New Technology Telescope of ESO, at the 1.2m Haute Provence Observatory, and at the 0.7m Abastumani telescope. In the optical, we obtained three complete lightcurves in 2023-2024.

The Spitzer observations of (98943) 2001 CC21 were obtained on November 20, 2005 from 10:17 to 12:26 UT with the Infrared Spectrograph (IRS). Data were acquired in low resolution mode covering the 5.2-38 micron range in 4 IRS long slit segments. The data were reduced starting from the basic calibrated data generated by the Spitzer Space Center automated pipeline, and  the sky background was removed by differencing two consecutive images taken at different nodding positions for each spectral segment. Finally, spectra were extracted using the Spitzer IRS Custom Extraction (SPICE) software. Data were modeled with the Near Earth Asteroid Thermal Model  to determine the asteroid size and albedo.

From ground-based observations, we determine an absolute magnitude of H=18.94±0.05, and a rotational period of 5.02124±0.00001 hours, with a large lightcurve amplitude of ˜0.8 magnitude at a phase angle of 22o, indicating a very elongated shape with estimated a/b semiaxis ratio > 1.8, or a close-contact binary body.  The emissivity of 2001 CC21 is consistent with that of silicates, and its albedo is 21.6+1.1-1.0 %.  Finally, the spherical-equivalent diameter of 2001 CC21 is 465±15 m.

The albedo value and emissivity here determined, coupled with results from polarimetry and spectroscopy from the literature, confirm that 2001 CC21 is an S-complex asteroid, and not a L-type, as previously suggested. The size of 2001 CC21 is less than 500 m, which is smaller than its first size estimation (˜700 m). These results are relevant in preparation of the observing strategy of 2001 CC21 by Hayabusa2 extended mission.

How to cite: Fornasier, S., Dotto, E., Panuzzo, P., Delbo, M., Belskaya, I., Krugly, Y., Inasaridze, R., Barucci, M. A., Perna, D., Brucato, J., and Birlan, M.: Size, albedo and rotational period of the Hayabusa2# target (98943) 2001 CC21 from SPITZER and groundbased observations, Europlanet Science Congress 2024, Berlin, Germany, 8–13 Sep 2024, EPSC2024-267, https://doi.org/10.5194/epsc2024-267, 2024.

11:20–11:30
|
EPSC2024-162
|
ECP
|
On-site presentation
Wen-Han Zhou

1. Introduction

It was initially assumed that asteroid rotation distribution had to take a Maxwellian form, peaking at about four revolutions per day as the result of the collision-induced random distribution of their spin vectors in three-dimensional velocity space (Harris & Burns, 1979). However, as observations progressed, an excess of slow rotators was noted for small asteroids. The abnormal excess of slow rotators is not captured by the prevailing model involving the YORP effect and collisions (Pravec et al, 2008). Moreover, recent observations (Durech & Hanus, 2023) reveal an obvious drop in the number density in specific size-dependent periods, forming a visible ``gap'' that separates the slow rotators from the faster rotators.

Another puzzle relates to the asteroids in non-principal rotation states, termed “tumblers” (Harris, 1994). Observation shows that nearly all observed tumblers are distributed in the slow rotation zone. The distribution of these tumblers is constrained by a transition line fitting a power-law on period-diameter diagram, which coincidentally matches the newly discovered ``gap''. A plausible explanation for the distribution of tumblers is still lacking, especially for its correlation with the visible gap in the spin distribution of asteroids. 

In this work, we constructed a self-consistent rotational evolution model that takes into account collisional excitation, internal friction damping, and the YORP effect on tumblers. We also developed a semi-supervised machine learning method to identify the gap in the period-diameter diagram.

2. Results

Our model successfully produced the observational features in the period-diameter diagram of main belt asteroids, including the excess of slow rotators, the gap separating slow rotators from fast rotators, and the distribution of tumblers. Our model suggests that the slow rotator group is mainly populated by “tumblers”, i.e., asteroids with unstable rotation vectors, which are less affected by radiative torques than principal-axis rotators and therefore get stranded in a size-dependent region of long rotation periods. The distribution of these bodies is, hence, determined by the competition between the effects of collisions and internal friction damping, the latter depending on the body's viscosity.

By fitting the gap in the simulation results to that in Gaia data, our best-fit model suggests Q/k2 ~ 5× 10⁸ (D/km)-2 or μQ ~ 4 × 10⁹ Pa. This is much smaller than usually assumed  μQ > 1011 Pa for monolithic boulders or 1013 Pa for cold imporous solid minerals, indicating that rubble piles are weaker (e.g. have a high porosity or a thick regolith layer) and more susceptible to the tidal effect which leads to a faster evolution and a larger equilibrium separation of binary asteroids.

References

Harris, A. W., & Burns, J. A. (1979). Asteroid rotation: I. Tabulation and analysis of rates, pole positions and shapes. Icarus40(1), 115-144.

Pravec, P., Harris, A. W., Vokrouhlický, D., Warner, B. D., Kušnirák, P., Hornoch, K., ... & Goncalves, R. (2008). Spin rate distribution of small asteroids. Icarus197(2), 497-504.

Ďurech, J., & Hanuš, J. (2023). Reconstruction of asteroid spin states from Gaia DR3 photometry. Astronomy & Astrophysics675, A24.

Harris, A. W. (1994). Tumbling asteroids. Icarus107(1), 209-211.

How to cite: Zhou, W.-H.: Rotational Evolution of Asteroids: The Confined Tumbling State as the Origin of the Excess of Slowly Rotating Asteroids, Europlanet Science Congress 2024, Berlin, Germany, 8–13 Sep 2024, EPSC2024-162, https://doi.org/10.5194/epsc2024-162, 2024.

11:30–11:40
|
EPSC2024-980
|
ECP
|
On-site presentation
Andrew Marshall-Lee, Marco Delbo, Apostolos Christou, Rogerio Deienno, and Kevin Walsh

The Hierarchical Clustering Method (HCM) has been the main algorithm for clustering asteroids into groups of similar origins, i.e. into families, since the early 1990s [1][2]. With surveys such as NEOWISE, GAIA and the future LSST providing large amounts of asteroid observations it is necessary to analyse the efficiency of the HCM at handling the exponentially larger volumes of data. Our work aims to investigate how the effectiveness of the HCM can be characterised, with respect to an asteroid family’s age, location, and the density of the background it is situated in. 


The efficiency of an algorithm can primarily be noted through two conditions, its ‘accuracy’ and its ‘precision’. These are the metrics  we have used to measure the HCM. The accuracy of an algorithm is a measure of the completeness of correct identification of background and family asteroids. Precision measures the ratio to correctly and incorrectly identified asteroids within a sample from the data set. Accuracy is useful for estimating the number of family members that the HCM will have missed, and precision for the number of interlopers that have contaminated the sample the HCM returns. This experiment was undertaken using a synthetic background generated by Rogerio Deienno, akin to his investigation into the Yarkovsky V-Shape Method [3]. Four families were generated at different points in the main-belt, and with ages varying from 10 Myr to 4.5 Gyr. 


The HCM was varied with cut-off velocities ranging from 10 to 1000 m/s.The cut-off with the highest overall accuracy was taken, and the precision at this point was measured. Our results show that position within the main belt made little difference to the efficiency of the algorithm. At the theoretical peak accuracy, the youngest families returned accuracy values ranging from 80-91%, with precision varying between 90-95%. No family older than 1.5 Gyr had an accuracy value of greater than 50%, and families older than 2.5 Gyr scored maximum values of 19% or lower. The precision for older families varied greatly as the cut-off velocity was increased. By limiting the survey cut-off velocity, it was possible to keep the precision higher, however this was at the expense of accuracy, trading family completeness for a reduction in interlopers. 


The HCM algorithm suffers from a problem of ‘chaining’. When the algorithm branches from a parent body to agglomerate nearby asteroids, clusters of nearby interloper asteroids act as a bridge that can cause the branching to extend outside of the family. This problem worsens as families age and dissipate, or if there are more background asteroids that will interfere and act as interlopers. With the growing datasets this problem will be exacerbated, and the continued use of the HCM as a tool for asteroid family clustering ‘as is’ must be addressed.

Figure 1: The plot depicts the variation of peak accuracy of the HCM with respect to a families position and age within the main belt. Older families are lighter coloured, and younger families darker.

References:

[1] Zappala, V., Cellino, A., Farinella, P., and Knezevic, Z., (1990). Asteroid Families. I. Identification by Hierarchical Clustering and Reliability Assessment, The Astronomical Journal, vol. 100, IOP, p. 2030, 1990. doi:10.1086/115658.

[2] Zappala, V., Cellino, A., Farinella, P., & Milani (1994), Asteroid Families. II. Extension to Unnumbered Multiopposition Asteroids, A. Astronomical Journal (ISSN 0004-6256), vol. 107, no. 2, p. 772-801, 1994AJ....107..772Z

[3] Deienno, R., Walsh, K., Delbo, M., (2021). Efficiency characterization of the V-shape asteroid family detection method. Icarus. 357. 114218. 10.1016/j.icarus.2020.114218.

How to cite: Marshall-Lee, A., Delbo, M., Christou, A., Deienno, R., and Walsh, K.: The Efficiency of the Hierarchical Clustering Method, Europlanet Science Congress 2024, Berlin, Germany, 8–13 Sep 2024, EPSC2024-980, https://doi.org/10.5194/epsc2024-980, 2024.

11:40–11:55
|
EPSC2024-561
|
solicited
|
Virtual presentation
Harold Levison and the Lucy Team

On November 1, 2023, <i>Lucy</i> passed within 430 km of the smallest Main Belt asteroid yet to be encountered by a spacecraft, (152830) Dinkinesh. This target was a late addition to the <i>Lucy</i> mission [1] and was intended primarly as an in-flight test of <i>Lucy</i>’s autonomous range-finding and tracking system [2]. Dinkinesh orbits the Sun near the inner edge of the Main Asteroid Belt with a heliocentric semimajor axis of 2.19 AU. Its ground-based reflectance spectrum shows a silicate band at 0.95 µm best fit as an Sq-type [3,4].

<i>Lucy</i> approached Dinkinesh at a solar phase angle of 120°; at close approach the phase dropped rapidly, going through near-zero and then increased to an out-bound phase of 60°. The relative velocity of <i>Lucy</i> and Dinkinesh was 4.5 km/s.

All of the instruments aboard <i>Lucy</i> [2] successfully observed Dinkinesh during the encounter.  Here we present the results from L'LORRI and L'Ralph.  L'LORRI, which stands for <i>Lucy</i>’s LOng Range Reconnaissance Imager, is a panchromatic (350 — 850 nm) imager with a 20.8 cm, f/13 telescope feeding a 1024 × 1024 pixel CCD focal plane [5]. L'LORRI revealed Dinkinesh, which has an effective diameter of only ~720 m, to be an unexpectedly complex system. Of particular note is the discovery of the first confirmed contact binary asteroid satellite, now named (152830) Dinkinesh I Selam.  Figure 1 shows a L’LORRI image of the Dininesh system taken about 6 minutes after close approach when the spacecraft was ~1600 km from the primary.  It clearly shows that Selam consists of two near-equal sized lobes of ∼200 m each. It orbits Dinkinesh at a distance of roughly 3km.  

<p style="margin-left: 25px;">
<b> Figure 1</b>
</p>

Figure 2 shows three cross-eyed stereo images of Dinkinesh taken on approach, near close approach, and on departure, respectively. Dinkinesh has two major geological features: a longitudinal trough and an equatorial ridge (the yellow and rose colored dots, respectively). The ridge overlays the trough implying that it is the younger of the two structures. However, there is as yet no information to better constrain their relative ages, and thus they could potentially have formed in the same event.  Indeed, Dinkinesh’s ridge and trough are likely the result of mass failure and the reaccretion of material, and may both be linked to the formation of Selam.

<p style="margin-left: 25px;">
<b> Figure 2</b>
</p>

The L’Ralph instrument on the <i>Lucy</i> mission consists of two focal planes sharing a common optical path: MVIC, a multi-spectral visible/NIR camera and LEISA, a shortwave infrared hyperspectral imager [6]. MVIC obtains images in 5 color bands with band-centers ranging from 430 nm to 850 nm,  while LEISA covers the spectral range from 0.9 to 3.95 mm.  Observations of the Dinkinesh system were taken near closest approach.  As a result, the phase angle was changing rapidly, and the reflectance had to be corrected accordingly.  It was also found that both MVIC and LEISA data were consistent with that expected for an S/Sq-type asteroid such as Dinkinesh (e.g. see Figure 3 for a comparison to 433 Eros[7]).  The spectra of Dinkinesh and Selam were identical to within measurement uncertainties.

<p style="margin-left: 25px;">
<b> Figure 3</b>
</p>


<b>Acknowledgements:</b> The <i>Lucy</i> mission is funded through the NASA Discovery program on contract No. NNM16AA08C. The authors thank the entire <i>Lucy</i> mission team for their hard work and dedication.

<b>References:</b> [1] Levison H. et al. (2021), PSJ 2(5), 171. [2] Olkin C. et al. (2021) PSJ 2(5), 172. [3] Bolin B. (2023) Icarus 400, 115562. [4] de León J. et al. (2023) A&A, 672, A174. [5] Weaver H. et al. (2023) SSRv, 219, 82. [6] Reuter, D. et al. (2023), Space Science Rev. 219, 69. [7] Binzel, R. et al. (2004), Icarus 170, 259-294

How to cite: Levison, H. and the Lucy Team: An overview of NASA Lucy misson’s encounter with the main belt asteroid Dinkinesh, Europlanet Science Congress 2024, Berlin, Germany, 8–13 Sep 2024, EPSC2024-561, https://doi.org/10.5194/epsc2024-561, 2024.

11:55–12:00

Posters: Mon, 9 Sep, 10:30–12:00

Display time: Mon, 9 Sep 08:30–Mon, 9 Sep 19:00
EPSC2024-467
|
ECP
|
On-site presentation
Delaram Darivasi, Jürgen Oberst, and Wladimir Neumann

Introduction

Enceladus, Saturn's sixth-largest moon, with a radius of 252.0±0.2 km [1] was observed by NASA’s Cassini spacecraft in 2005. During its close flybys, Cassini’s imaging science subsystem captured images revealing a region of intense geological activity near Enceladus´ South Pole [2] where it was found to be the source of fine icy particles that form Saturn’s E ring [3]. This suggests the existence of a subsurface water ocean [2].

Enceladus´ density of 1608±5 kg/m³ and its icy surface [2] indicates an ice-rich bulk composition. Additionally, the moment of inertia (MOI) coefficient, ranging from 0.33-0.34 with a confidence level linked to the 2σ range, suggests a differentiated body [4] with a rocky core beneath an H2O mantle [5].

Our current investigation focuses on exploring various internal structures for Enceladus and their corresponding MOI coefficients to determine which internal structure aligns most closely with the MOI coefficient obtained from gravity field data.

Methodology

Several researchers have explored Enceladus's thermal and internal structure. This study builds upon the work of Neumann and Kruse [5], which examined the thermal evolution and differentiation of Enceladus heated by radionuclides and tidal dissipation.

The Neumann-Kruse model incorporates wet olivine, dry olivine, and antigorite for the core's rock rheology. This results in a differentiated Enceladus structure with a core radius of ≈185–205 km, a porous core layer of ≈2–80 km, a subsurface ocean of ≈10–27 km, and an ice-rock crust layer of ≈30–40 km.

Additionally, we adjusted Neumann-Kruse models to incorporate the subduction of an undifferentiated ice-rock crust and the settling of its rock fraction atop the core. This resulted in changes in crust density and an enlarged core radius. Various suggested crust densities were examined: 850 kg/m³ [1], 918 kg/m³, and 925 kg/m³ [6,7].

We calculated MOI for each of the Neumann-Kruse models and the adjusted models derived in this study using equation (1), where ρ(r) represents the density as a function of the radial coordinate r, and θ and φ denote the polar and azimuth angles, respectively:

(1)

The MOI coefficient is computed using:

MOI Coe Eq(2) 

where M represents Enceladus' total mass, and R is its radius.

Results

Figure 1 shows the MOI coefficients calculated for differentiated Neumann-Kruse models and adjusted models for a differentiated crust with a crust density of 850 kg/m³ [1], 918 kg/m³, and 925 kg/m³ [6,7] for both dry and wet olivine core rheologies.

The results show that models without crust subduction have the lowest agreement with the derived MOI from the gravity field by [4]. However, when accounting for undifferentiated crust subduction resulting in an icy crust with a density of 925 kg/m³, most models align within the accepted range of MOI coefficients. Additionally, our findings suggest that models with a higher crust density require a higher core density, while those with a lower crust density should have a lower core density to fall within the accepted range of MOI coefficients.

Figure 1: Results for the moment of inertia coefficient.

Figure 1: Results for the moment of inertia coefficient."D" and "W" denote dry and wet olivine core rheologies. "NK" signifies a crust density of 1609 kg/m³ from Neumann-Kruse models, while subscripts "850," "918," and "925" represent crust densities of 850 kg/m³, 918 kg/m³, and 925 kg/m³, respectively. The colorbar displays core densities ranging from 2150-2633 kg/m³. The solid green line marks a MOI coefficient range of 0.33-0.34, matching the 2σ range confidence level, while the red line represents a range of 0.333-0.338, matching the 1σ range confidence level [4].

When examining the radius of the outer porous core under the condition that the MOI falls within the range of 0.33-0.34 [4], the thickness of this outer porous core varies depending on the type of olivine core rheology. For dry olivine, the outer porous core's thickness ranges from ≈3-73 km, with ≈60% of models under 10 km thick and ≈80% below 20 km. Conversely, for wet olivine, the range is ≈2-80 km, ≈50% of models show a porous outer core under 10 km thick, while ≈65% are below 20 km.

Conclusions

Our study builds upon the differentiated internal structure models proposed by [5], initially based on a rock-ice crust model. We further refined these models by incorporating a differentiated crust with varying densities. Our analysis indicates that most models, with a crust density of 925 kg/m³, align with the MOI range of 0.333-0.338 [4]. This trend persists regardless of whether the core rheology is dry or wet olivine. As expected, lower crust densities result in lower average MOI coefficients. Overall, approximately 54% of the models fall within the accepted 2σ range of MOI, suggesting their compatibility with observed gravity data.

Acknowledgment

This work was supported by the Berlin University Alliance (BUA), by the Deutsche Forschungsgemeinschaft (DFG), and by the International Space Science Institute (ISSI) in Bern and Beijing, through ISSI/ISSI-BJ International Team project “Timing and Processes of Planetesimal Formation and Evolution”. 

References

[1] P.C. Thomas. et al., Icarus 264, 37 (2016).

[2] C.C. Porco. et al., Science 311, 1393 (2006).

[3] F. Spahn. et al., Science 311, 1416 (2006).

[4] L. Iess. et al., Science 344, 78 (2014).

[5] W. Neumann and A. Kruse, The Astrophysical Journal 882, 47 (2019).

[6] W.B. McKinnon, Geophysical Research Letters 42, 2137 (2015).

[7] D.J. Hemingway and T. Mittal, Icarus 332, 111 (2019).

How to cite: Darivasi, D., Oberst, J., and Neumann, W.: Exploring Enceladus: Internal Structure Models and Moment of Inertia , Europlanet Science Congress 2024, Berlin, Germany, 8–13 Sep 2024, EPSC2024-467, https://doi.org/10.5194/epsc2024-467, 2024.

EPSC2024-614
|
ECP
|
On-site presentation
Julie Vermersch, Michaël Marsset, Nicolas Rambaux, and Bruno Sicardy

1. Introduction

The asteroid (2) Pallas is the largest main-belt object not yet visited by a spacecraft. Its surface geology and internal structure remain poorly constrained. However, by means of adaptive-optics-fed ground-based instrumentation, its three-dimensional shape is now fairly well known with a spatial resolution of about 20km (Fétick et al. 2019). High-angular-resolution observations of Pallas’s north and south poles (Fig. 1, a) south, b) north), provided by ESO/VLT/SPHERE, have been analysed by Marsset et al. (2020). Additionally, in 2023, new adaptive-optics images have been performed under an equator-on geometry (Fig. 1, c)), allowing for a revision of its polar axis and, thus, of its volume and bulk density. 

Fig. 1 Deconvolved images of the asteroid (2) Pallas (ESO/VLT/SPHERE) with different observation geometries: a) south pole, b) north pole and c) equator.  


2. Method

Based on these two observation sets and the reconstructed shape model, the global shape and topography of Pallas can be described with a spherical harmonics decomposition (e.g. Rambaux et al. 2022). This description allows us to differentiate large spatial structures related to the equilibrium figures (small degree terms) from smaller local structures (high degree terms) that arise due to collisional history. 


3. Probation of shape model

The extraction of Pallas limbs, acquired over three different epochs, and their projection on the topographic map highlight their homogenous spatial distribution, almost covering the full surface (Fig. 2). The fine match between the topographic features along the limbs and on the projected shape model reveals the accuracy of the model. In order to assess a confidence interval on the shape measurements, we computed residuals between observed limbs and reconstructed ones in spherical harmonics. Furthermore, to estimate the global shape of Pallas, we used its Digital Terrain Model (Jorda et al. 2016). From the estimation of the degree 2 of the DTM spherical harmonic decomposition, we determined the degree limit of the influence of higher degrees.

Fig. 2 Projection of the observed limbs profiles on topographic surface map, obtained from shape model. 


4. Discussion

This shape study will be continued with the determination of an internal structure, exploring a differentiated interior. The important craterisation of the surface, reported by Marsset et al. (2020), will lead to a geological analysis of the crust rheology (Asphaug et al. 1996, Fu et al. 2014, Johnson et al 1973), probing its density, strength and viscosity. Relaxation times needed to reach a near zero shear stress state will be discussed.


References: 

Asphaug, E., Moore, J. M., Morrison, D., Benz, W., Nolan, M. C., & Sullivan, R. J. (1996). Mechanical and geological effects of impact cratering on Ida. Icarus, 120(1), 158-184.

Fétick, R. J., Jorda, L., Vernazza, P., Marsset, M., Drouard, A., Fusco, T., ... & Yang, B. (2019). Closing the gap between Earth-based and interplanetary mission observations: Vesta seen by VLT/SPHERE. Astronomy & Astrophysics, 623, A6.

Fu, R. R., Hager, B. H., Ermakov, A. I., & Zuber, M. T. (2014). Efficient early global relaxation of asteroid Vesta. Icarus, 240, 133-145.

Johnson, T. V., & McGetchin, T. R. (1973). Topography on satellite surfaces and the shape of asteroids. Icarus, 18(4), 612-620.

Jorda, L., Gaskell, R., Capanna, C., Hviid, S., Lamy, P., Ďurech, J., ... & Wenzel, K. P. (2016). The global shape, density and rotation of Comet 67P/Churyumov-Gerasimenko from preperihelion Rosetta/OSIRIS observations. Icarus, 277, 257-278.

Marsset, M., Brož, M., Vernazza, P., Drouard, A., Castillo-Rogez, J., Hanuš, J., ... & Yang, B. (2020). The violent collisional history of aqueously evolved (2) Pallas. Nature Astronomy, 4(6), 569-576.

Rambaux, N., Lainey, V., Cooper, N., Auzemery, L., & Zhang, Q. F. (2022). Spherical harmonic decomposition and interpretation of the shapes of the small Saturnian inner moons. Astronomy & Astrophysics, 667, A78.

How to cite: Vermersch, J., Marsset, M., Rambaux, N., and Sicardy, B.: Asteroid (2) Pallas: a trip from the limbs profiles to the interior, Europlanet Science Congress 2024, Berlin, Germany, 8–13 Sep 2024, EPSC2024-614, https://doi.org/10.5194/epsc2024-614, 2024.

EPSC2024-233
|
On-site presentation
Anna Marciniak, Antoine Choukroun, and Julia Perła and the Justitia team

Context
Asteroid (269) Justitia is a main-belt asteroid with unusual surface properties. Its reflectance spectrum is extremely red, unlike any other taxonomic type found in the main belt, and not even within the Jupiter Trojan population (Hasegawa et al. 2021). However, such a spectrum closely resembles spectra of trans-Neptunian Objects. Also polarimetric properties of (269) Justitia are unusual (Gil-Hutton & García-Migani 2017), with both very small depth of negative polarisation branch and also small angle of minimum polarisation. These findings suggest Justitia origin within the trans-Neptunian population, making it an easy-reach target for a space mission, MBR Explorer (El-Maarry et al. 2023, Filacchione et al. 2023).

Aims
In preparation to the mission a possibly most detailed knowledge of the target properties like spin, shape, size, and properties of the surface are essential. For these aims a detailed thermophysical model of Justitia was created.

Methods
By a fortunate coincidence asteroid Justitia has been on our list of Slow Rotators since a few years already, when the MBR Explorer mission was announced (see Marciniak et al. 2015 and 2021 for the project description and example results). As such, it has been observed for lightcurves by our team in each apparition since the year 2019. These data combined with literature lightcurves enabled obtaining a unique model using lightcurve inversion (Kaasalainen & torppa 2001, Kaasalainen et al 2001). Next, these dense lightcurve data have been combined with sparse data from ATLAS survey (Tonry et al. 2018) and thermal data from three infrared missions (IRAS, AKARI and WISE). We used all these data as an input to simultaneous optimisation using Convex Inversion Thermophysical Model (CITPM, Durech et at. 2017).

Results
We obtained a thermophysical of this asteroid that well fits all types of data, both in the visible and in the infrared range. Thanks to high quality data the shape model is smooth (Fig. 1), and obtained parameters reliable (Tab. 1). Together with the shape model we determined spin axis orientation, sidereal period, thermal inertia and size. Our model of Justitia was confirmed by an extensive stellar occultation campaign in August 2023 (Buie et al., in prep.).

Fig. 1. Shape model of asteroid (269) Justitia from simultanous fit to visible lightcurves and thermal data.. Solution for pole 1. Two equatorial views on lhe left and in the middle, pole-on view on the right.

Fig. 1. Shape model of asteroid (269) Justitia from simultanous fit to visible lightcurves and thermal data. Solution for pole 1. Two equatorial views on the left and in the middle, pole-on view on the right.


 Model prameter             value
                  λp          73°+/- 11°
                  βp         -81° +/- 15°
                  Psid        33.12962 +/- 0.00001 h
                  Deq        58 +/- 2 km
                  pV        0.058 +/- 0.006

                   Γ

       41+110-40 SIu

Tab. 1. Parameters of the model: spin axis longitude (λp) and latitude (βp), sidereal rotation period (Psid), diameter of equivalent surface sphere (Deq), geometric albedo (pV), and thermal inertia (Γ). All the parameters are for pole solution 1, mirror pole not shown here.


Acknowledgement
This work was supported by the National Science Centre, Poland, through grant no. 2020/39/O/ST9/00713.

References

El-Maarry, M. R., Landis, M. E., Capaccioni, F., & Filacchione, G. 2023, in LPI Contributions, Vol. 2851, LPI Contributions, 2385
Filacchione, G., Ciarniello, M., De Sanctis, M. C., et al. 2023, in LPI Contributions, Vol. 2851, LPIContributions, 2157
Gil-Hutton, R., & García-Migani, E. 2017, A&A, 607, A103
Hasegawa, S., Marsset, M., DeMeo, F. E., et al. 2021, ApJL, 916, L6
Kaasalainen, M., & Torppa, J. 2001, Icarus, 153, 24
Kaasalainen, M., Torppa, J., & Muinonen, K. 2001, Icarus, 153, 37
Marciniak, A., Pilcher, F., Oszkiewicz, D., et al. 2015, Planet. Space Sci., 118, 256,
Marciniak, A., Durech, J., Alí-Lagoa, V., et al. 2021, A&A, 654, A87
Tonry, J. L., Denneau, L., Heinze, A. N., et al. 2018, PASP, 130, 064505

How to cite: Marciniak, A., Choukroun, A., and Perła, J. and the Justitia team: Thermophysical model of asteroid (269) Justitia:  a main-belter out of place, Europlanet Science Congress 2024, Berlin, Germany, 8–13 Sep 2024, EPSC2024-233, https://doi.org/10.5194/epsc2024-233, 2024.

EPSC2024-380
|
ECP
|
On-site presentation
Oriel Humes and Josef Hanus

During its 2021 apparition, large Main Belt asteroid (203) Pompeja was observed to have an extremely steeply red sloped spectrum in the visible and near-infrared [1]. The resemblance of this ultra-red spectrum to that of some classes of trans-Neptunian Objects (TNOs) led to the hypothesis that Pompeja originated from the primordial TNO parent population and was transported to its current location in the Main Belt during the era of giant planet migration [1]. However, subsequent observations of Pompeja [2, 3] showed that the asteroid’s VNIR spectrum was not consistently ultra-red, suggesting that the spectral appearance of Pompeja varies across its surface and thus varies with time, related to rotational phase and viewing geometry at the time of observation [2]. 


Understanding the viewing geometry for any given spectral observation requires knowledge of Pompeja’s rotational state (shape and spin pole), which can be derived from light curves using convex inversion [4,5]. Obtaining ground-based, densely sampled light curves of Pompeja is complicated by its Earth commensurate (~24 hour) rotational period [6], necessitating observations via either a global network of telescopes or a space-based observing platform with an observation cadence unaffected by Earth’s rotational period. To this end, we obtained photometric measurements of Pompeja from TESS Full Frame Images using existing open-source software tools for accessing TESS data [7, 8] to obtain a dense, continuous light curve of Pompeja. We compare the results of shape modeling incorporating TESS data to previous models of Pompeja’s rotational state and shape and discuss the implications for the hypothesis of spectral variability on Pompeja’s surface in light of the TESS observations, including recommendations for future observations of Pompeja that target the ultra-red material.  


Figure 1: Light curve of Pompeja derived via photometric measurements of TESS FFIs, folded to the best fit synodic period of 24.0921 hours. A rotational phase of 0 corresponds to JD = 2457000.


References: 


[1] Hasegawa, S., Marsset, M., DeMeo, F. E., et al. 2021 ApJL, 916, L6, doi: 10.3847/2041-8213/ac0f05


[2] Hasegawa, S., DeMeo, F. E., Marsset, M., et al. 2022 ApJL, 939, L9, doi: 10.3847/2041-8213/ac92e4


[3] Humes, O. A., Thomas, C. A., & McGraw, L. E. 2024, PSJ, 5, 80, doi: 10.3847/PSJ/ad2e99


[4] Kaasalainen, M., & Torppa, J. 2001, Icarus, 153, 24,doi: 10.1006/icar.2001.6673


[5] Kaasalainen, M., Torppa, J., & Muinonen, K. 2001, Icarus,153, 37, doi: 10.1006/icar.2001.6674


[6] Pilcher, F., Ferrero, A., Hamanowa, H., & Hamanowa, H. 2012, Minor Planet Bulletin, 39, 99


[7] Brasseur, C. E., Phillip, C., Fleming, S. W., Mullally, S. E., & White, R. L. 2019, Astrocut: Tools for creating cutouts of TESS images, Astrophysics Source Code Library,121 record ascl:1905.007


[8] Lightkurve Collaboration, Cardoso, J. V. d. M., Hedges, C., et al. 2018, Lightkurve: Kepler and TESS time series analysis in Python, Astrophysics Source Code Library. http://ascl.net/1812.013

How to cite: Humes, O. and Hanus, J.: Insights on Ultra-red Main Belt Asteroid (203) Pompeja from TESS Photometry, Europlanet Science Congress 2024, Berlin, Germany, 8–13 Sep 2024, EPSC2024-380, https://doi.org/10.5194/epsc2024-380, 2024.

EPSC2024-296
|
On-site presentation
Xiao-Duan Zou, Jian-Yang Li, Scott Mest, Jeffrey Kargel, Stefano Mottola, and Stefan Schröder

Introduction:

We have performed a detailed spectrophotometric modeling and mapping of three geologically young regions on Ceres, including the one of the youngest craters, Haulani[1], the cryovolcanic Ahuna Mons[2], and the Occator crater region. We aim to identify potential cryovolcanic features and constrain geologic processes on Ceres. The focus questions include 1) How does light scattering, such as photometric phase functions and their color dependence, reflectance, and albedo relate to grain size and packing, surface roughness and composition? 2) How do spectrophotometrically distinct geologic units further relate to putative cryovolcanic or cryomagmatic features or other processes/landforms? and 3) Are the peculiar light scattering properties of Cerealia Facula related to active haze forming over the region?

We have reported our results for the Haulani crater and Ahuna Mons previously [3,4]. Different from these two areas, Occator crater region is much more complicated than the other two in terms of photometric modeling because of the diverse compositional variations within this crater including the faculae, the drastic albedo contrast between the faculae and the background region, and the diffuse nature of the bright material especially in the Vinalia Facula. The Cerealia and Vinalia Faculae inside the Occator crater region, which are carbonate- and chloride-rich evaporites [5] formed from brine extrusion with evidence of recent activity [6]. In this report, we will discuss the photometric behavior of the Facula regions and compare it to other regions.


Analysis of Occator region:

The different regions must be divided such that the photometric behavior within each ROI is relative uniform. We went through many iterations to define the ROIs, particularly for the faculae and the surrounding areas. We finally decided to exclude the transition region surrounding the Cerealia Facula from any ROIs, because including that region into either the facula ROI or crater floor ROI would significantly degrade the model quality. The possible reason could be that the transition region contains a mix of the bright facula material and the dark crater floor material in the spatial scale below the pixel resolution. Although visually undiscernible, the mix significantly changes the photometric behavior of either the facula material or the crater floor material. The modeling quality for Cerealia Facula and crater floor has been significantly improved with this ROI definition. The Vinalia Facula is diffuse in nature, and therefore a satisfactory model cannot be derived (Fig. 2).

Following the same procedure as for the previous two regions, we performed modeling to the ROIs in the Occator region. The modeled parameters based on the final ROI definitions, with the roughness parameters fixed to 20º, are shown in Fig. 4. Overall, the models for Cerealia Facula and Vinalia Facula were improved from the previous results but not fully satisfactory. For example, the roughness parameter, if set free, returned all zero for Cerealia/Pasola faculae, in contrast to the previously reported results that the bright material may display a high roughness [7]. The asymmetry factor values have a large range of oscillation with respect to wavelength rather than a trend, which is another indication that the modeling is not reliable. That is why we need to perform a more careful analysis to determine the photometric behavior of the bright material, utilizing higher resolution images and terrain model. Generally, we performed a preliminary synthesis analysis with the preliminary results of the Occator regions. It appears that the overall trend that showed up for the Haulani crater region and Ahuna Mons region still hold, but some inconsistency exists. In particular, the whole Occator region appears to be redder than other regions in terms of SSA, which is inconsistent with previous results (e.g.,[8]). We also compared the differences and similarities between regions, further interpretation will benefit in the context of Ceres’s geologic activity and cryovolcanic history.


Acknowledgments: This research is supported by NASA Grant #80NSSC21K1017. All data used in this study are directly downloaded from the Small Bodies Image Browser (SBIB) from the PDS small body node Asteroid/Dust Subnode.


Reference:

[1] Krohn K. et al. (2018) Icarus 316, 84.

[2] Ruesch O. et al. (2016) Science, 353, 1005.

[3] Li, J. Y., et al. (2022). EPSC 2022

[4] Zou, X.D., et al. (2023) LPI Contributions2806, p.1936.

[5] Raponi A. et al. (2019) Icarus, 320, 83.

[6] De Sanctis M.C. et al. (2020) Nature Astron. 4, 786.

[7] Li, J. Y., et al. (2016). Astrophys. J. Lett. 817, 22.

[8] Schröder, S.E., et al., (2017) Icarus 288, 201-255.


How to cite: Zou, X.-D., Li, J.-Y., Mest, S., Kargel, J., Mottola, S., and Schröder, S.: Inside the Occator Crater Region: A Spectrophotometric Analysis, Europlanet Science Congress 2024, Berlin, Germany, 8–13 Sep 2024, EPSC2024-296, https://doi.org/10.5194/epsc2024-296, 2024.

EPSC2024-293
|
On-site presentation
Wei Zhao, Wei Han, and Peng Liu

Inverting kinetic energy impacts of high-speed meteoroids is an effective means to study the dynamics of celestial impact, thereby, evaluate the impact effects and hazards. This paper uses a Smoothed Particle Hydrodynamics method based Celestial Impact Dynamics (PySPH-CID) to simulate the ejecta and crater evolution process of meteorites colliding into Earth; and a Kernel Gaussian Mixture Ridge Regression (KGMRR) method is proposed to fit the one-to-many mapping between cause and effect of an impact with multiple sets of feasible solutions; a solution space is obtained using Gaussian Process (GP), for the formation conditions of craters after a small celestial body impacts. An inversion of colliding crater of Yilan in Heilongjiang Province, Northeast China, 46°23'03'' N and 129°18'40'' E, with 1.85km diameter, which located entirely on the cretaceous granite bedrock and preserved the remnants of two-thirds of the crater rim, was made. Assuming the impactor diameter is around 120m, preliminary experiment gives colliding cause vectors that impact velocities range between 17.8~15.0 km/s with 60.7°~66.6° obliquely incident, impactor density varying in scope of 2772~2815 kg/m3. This work provides a direct reference for effectively defending against the threat of foreign celestial bodies to the Earth, developing and transforming controlled impact technologies, as well as implementing precise and controllable impacts.

How to cite: Zhao, W., Han, W., and Liu, P.: Meteorites Colliding Craters Inversion based on Kernel Gaussian Mixture Ridge Regression, Europlanet Science Congress 2024, Berlin, Germany, 8–13 Sep 2024, EPSC2024-293, https://doi.org/10.5194/epsc2024-293, 2024.

EPSC2024-1181
|
On-site presentation
Bojan Novakovic, Marco Fenucci, Dusan Marceta, and Debora Pavela

We developed the new model and corresponding publicly available software for determining the surface thermal inertia (TI) of asteroids [1,2]. We named it ASTERIA (Asteroid Thermal Inertia Analyzer). The model allows TI estimation based mostly on population-modeled input parameters in its basic variant. However, as in general cases the model may not work well if all physical parameters are population-based, we identified the set of critical parameters, which includes the diameter, albedo, and rotation periods of an object.

ASTERIA has been validated using data from Bennu and ten other well-characterized NEAs. The results agree well with the literature values, demonstrating the model's reliability for TI analysis.

We have identified a set of 38 near-Earth asteroids (NEAs) for which all the input parameters critical for the ASTERIA model to work reliably are available and presented the new TI for those objects. Among these 38 NEAs, 29 are classified as PHAs. It makes our results highly relevant from the planetary defense point of view. Our sample of new TI estimates also includes 31 sub-kilometer-sized asteroids. At the same time, there are only 17 other literature values in this size range, highlighting the importance of the ASTERIA model for determining the surface TI of small asteroids  (see Figure).


A general advantage of the ASTERIA model is that it may be applied to smaller asteroids than TPM, because the Yarkovsky effect is more substantial in smaller objects and, therefore, easier to detect. Additionally, TPM requires thermal infrared observations and good shape models, which are currently challenging for asteroids below some 100 m in size. Based on the astrometric measurements and the detection of Yarkovsky-induced acceleration of orbital motion, it is primarily independent of the most widely used approach for the asteroid TI estimations based on TPM. As such, ASTERIA may also serve as a benchmark test to independently verify the results derived from TPM, one of the long-standing challenges of TPM models [3].

References:

[1] Novakovic, B., Fenucci, M., Marceta, D., and Pavela, D., 2024, PSJ, 5, 11.

[2] Fenucci M., Novaković B., Marčeta D. and Pavela D. 2023 Fenu24/D-NEAs: ASTERIA v1.0.0 Zenodo, doi: 10.5281/zenodo.8365840

[3] Hung D., Hanuš J., Masiero J. R. and Tholen D. J., 2022 PSJ, 3, 56

Acknowledgments

The authors appreciate the support from the Planetary Society STEP grant, made possible by the generosity of the Planetary Society's members.

How to cite: Novakovic, B., Fenucci, M., Marceta, D., and Pavela, D.: Asteroid Thermal Inertia Analyzer, Europlanet Science Congress 2024, Berlin, Germany, 8–13 Sep 2024, EPSC2024-1181, https://doi.org/10.5194/epsc2024-1181, 2024.

EPSC2024-499
|
ECP
|
On-site presentation
Calvin Knoop, Christopher Kreuzig, Gerwin Meier, Johanna Noria Brecher, Christian Schuckart, Maximilian Timpe, and Jürgen Blum

Cometary activity is not yet fully understood. One goal is to determine the
locations on a comet more likely to be active. This work focuses on how surface
structures influence cometary activity. Therefore, laboratory experiments were
conducted to examine different surface structures. To simulate the most simple
version of a comet, the samples were made out of granular water ice. Different
structures were embedded into the samples. Three structures were chosen for
the experiment to simulate some possible structures to find on a surface. A nar-
row but deep hole, a cliff with a 45° angle and an even square imitating a crack
are realized.
The prepared samples then were inserted into an actively cooled vacuum cham-
ber. At a pressure of about 1 · 105mbar the samples were illuminated with
a halogen lamp which simulates the Sun. Exposed to a radiation of around 2
solar constants, the samples show the first signs of activity. The whole process
is filmed with a camera. Every video is about 20 minutes long. In the end, all
the recorded images are stacked and color coded to visualize the most active
regions of the sample. In Fig. 1, the results of an experiment with a cliff are
presented. The upper plot shows the accumulated brightness of the particles
over the position on the sample. The peaks mark the most active areas. The
color coded trajectories of the particles are visualized in the middle plot. The
lower plot indicates the location and shape of the realized structure.
The required intensity of radiation to show activity is lowered by structuring
the samples as observed in the experiments. A reason for that might be less
bound material on the edges of the structures. Another reason could be that
structured surfaces can produce up to 61 % higher sublimation rates than flat
surfaces as results from simulations ( Höfner, 2021).

Further, structured samples feature areas with directed jets. This might be due
to directed gas flow carrying the particles in a certain direction. Since the struc-
tures were embedded into the sample and the camera is observing the sample
parallel to the surface, there is no information about the activity inside the
structures. This setup only observes particles leaving the surface of the sample.
Improving the setup to investigate the structure’s inside will be part of future
work.

Figure 1: (center) Color coded trajectories of ejected particles from a sample
after 20 minutes of illumination with an artificial sun. (bottom) Schematics of
the position of the structure inside of the sample. (top) Accumulated brightness
of each column of the particle trajectories. The two peaks at 3.5 mm and 5 mm
are not related to the measurements but result from pixel errors.


Figure 2: Sample holder filled with micro-granular water ice. Inserted into
the sample holder is a bridge with a stamp used to create the embedded struc-
ture. The left side of the stamp is located in the middle of the sample holder to
compare the flat and structured parts of the sample.


How to cite: Knoop, C., Kreuzig, C., Meier, G., Brecher, J. N., Schuckart, C., Timpe, M., and Blum, J.: Experimental results from the CoPhyLab -Detection of the influences of surface structureson particle ejection in comet-simulationexperiments, Europlanet Science Congress 2024, Berlin, Germany, 8–13 Sep 2024, EPSC2024-499, https://doi.org/10.5194/epsc2024-499, 2024.

EPSC2024-543
|
ECP
|
On-site presentation
Maximilian Timpe, Christopher Kreuzig, and Jürgen Blum

To describe comets and planetesimals with models and simulations, the material properties are required. To determine the compression behaviour of polydisperse spherical silicon dioxide dust as an analog material for these objects, a hand-operated 15t(US) hydraulic press was used to perform compression experiments. The force of this press was directed into a carbide piston of 12.25mm diameter to achieve pressures of almost 1.2GPa in the samples. Four different particle size distributions of dust were used in the experiments to investigate the effect of particle size distribution. The median particle radii for the dust types are: 0.01micron for C1, 0.35micron for C2 0.57micron for C4 and 2.2micron for C6 with differing distribution widths. The results of these experiments show that the polydisperse dust can be compressed to higher filling factors than the theoretical maximum of monodisperse dust. It also becomes clear that the dust is elastic and partially expands again when the pressure is released. The size distribution appears to have a significant effect, with wider distributions leading to higher compressibility as seen in Figure 1 (C4 has the widest size distribution). In measurements that subjected the dust to multiple pressure cycles, the filling factor kept increasing with every cycle (Figure 2).


Figure 1: Mean compression curves for the 4 different size distributions.

Figure 2: Pressure cycles with C6 dust

How to cite: Timpe, M., Kreuzig, C., and Blum, J.: Compression measurements with polydisperse SiO2 dust, Europlanet Science Congress 2024, Berlin, Germany, 8–13 Sep 2024, EPSC2024-543, https://doi.org/10.5194/epsc2024-543, 2024.

EPSC2024-557
|
ECP
|
On-site presentation
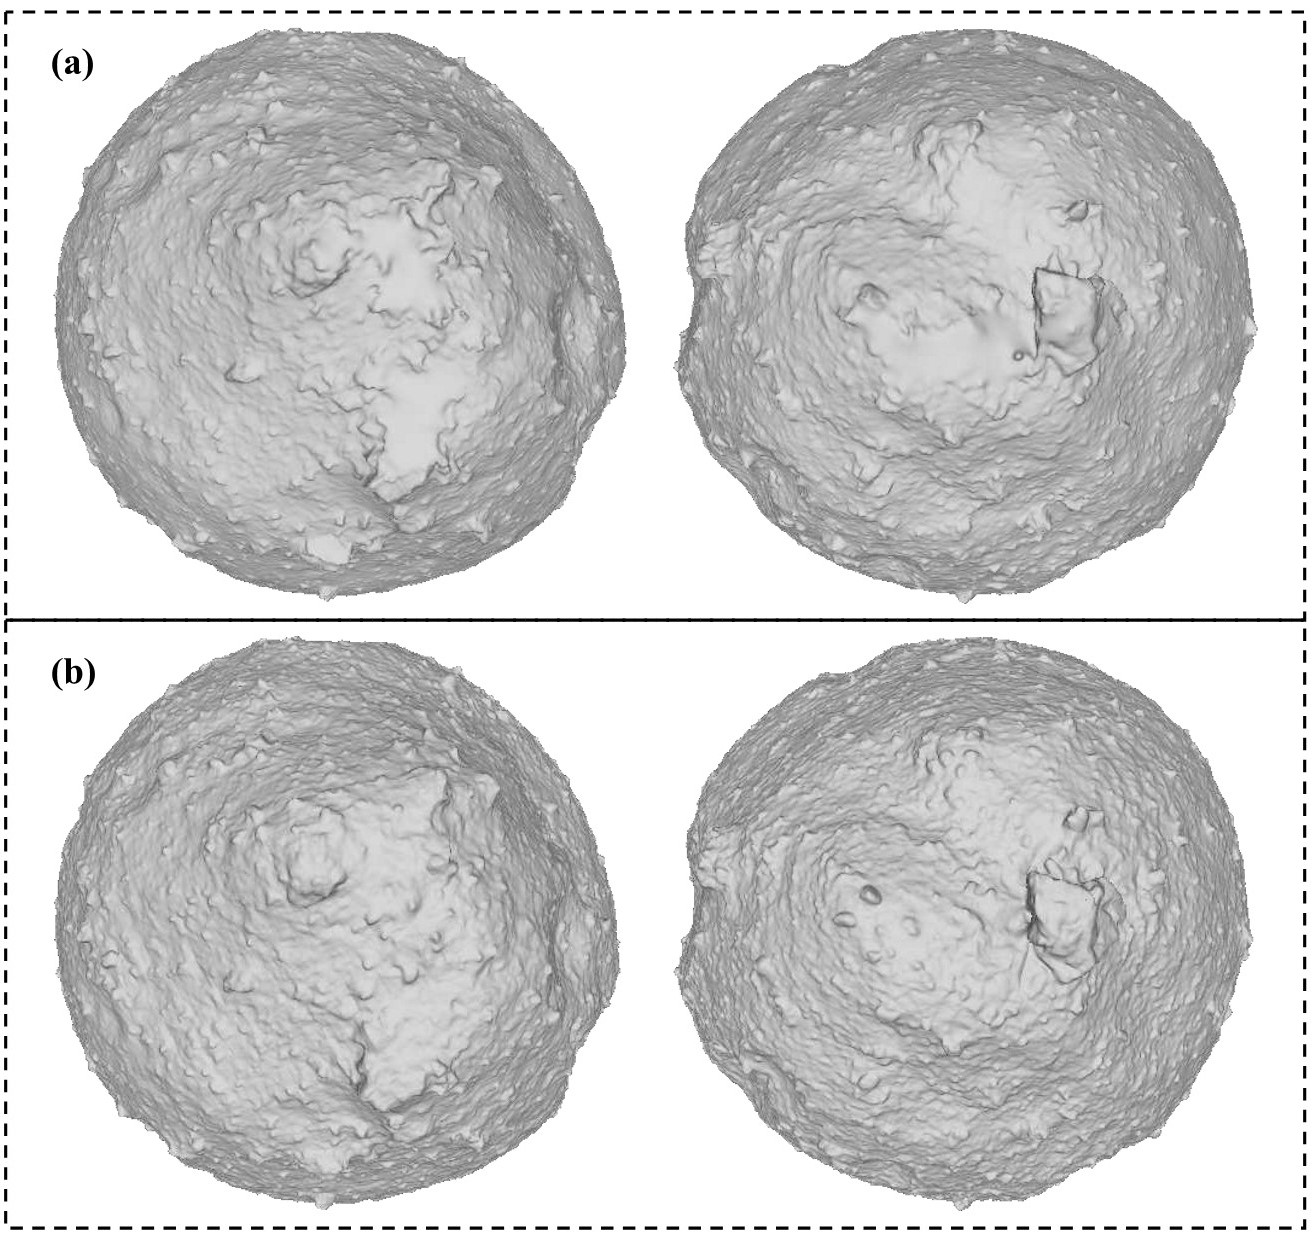
Bhuvan Agrawal, Matthias Grott, Jörg Kollenberg, Jens Biele, Bastian Gundlach, Jürgen Blum, Ansgar Greshake, and Hirdy Miyamoto

Introduction: The Hayabusa2 mission [1] investigated the near-Earth asteroid (162173) Ryugu by remote sensing and in-situ measurements. A comprehensive analysis of the asteroid’s thermophysical properties [2] revealed a discrepancy between results obtained at the asteroid and measurements performed on the returned samples. While it has been proposed that the low thermal conductivities observed in-situ would be caused by the high porosity of boulders in the Ryugu [3], it has been hypothesized that thermal properties may be scale dependent [4]. The latter, for example, be caused by thermal fatigue induced cracks as a result of diurnal temperature forcing.

Fig. 1: Results of simulating heat flow through beds of monodisperse particles driven by a temperature gradient between two plates. (a) Temperature distribution within a particle bed in simple cubic packing, where color represents particle temperatures going from red (hot) to blue (cold). (b) Same as (a), but for a random packing of particles. (c) Thermal conductivity as a function of contact radius normalized to particle radius for a suite of particle beds in simple cubic packing with particle diameters between 0.5 mm (pink) to 5 mm (green). (d) Same as (c), but a random packing of particles.


Modeling: We aim to investigate the thermophysical properties of carbonaceous material using numerical simulations. To this end, we simulate heat transfer in a particle bed where individual particles are connected through sintering bonds at the particle necks [4]. We use the open source software LIGGGHTS®-PUBLIC package [5] which implements the discrete element method to calculate interactions between particles. Fig. 1 shows two such particle beds, with 1a showing a simple cubic packing of particles, while 1b represents a randomly packed bed of particles. The beds are subjected to temperature boundary conditions on the left and right side of the computational domain, while keeping the other boundaries adiabatic.

Once the simulation reaches a quasistatic state, we determine the flux through the bed by evaluating flow through particle layers perpendicular to the temperature gradient. Layers are spaced equally through the bed between hot and cold boundaries. We use the particles which intersect (or touch) the planes to determine the heat flux through them. For each layer m and particle i, heat flow into the particle (and thus into the plane) is determined by summing up all the heat flow contributions from neighboring particles j, considering only the net influx of heat (in thermal equilibrium, the total flow through layer is zero). Assuming particle thermal conductivity kp as well as contact radii rc between particles to be constant, heat flow  into a particle is given by

Qm,i = Σj max(Tm,j - Tm,i, 0)·((kp,i·kp,j)/(kp,i+kp,j))·rc

(1)


where Tm,i is the temperature of particle i. The term on the right-hand side corresponds to the thermal conductance between particles  and  in the units of [W/K]. Heat flow Qm into layer  is then given by summing all contributions from particles in that layer

Qm = Σi Qm,i

(2)


and average flow through the entire packing (of m layers) is then given by

Q =(Σi Qi )/m

(3)


Bulk thermal conductivity kbulk of the particle bed can now be calculated using Fourier’s law given by the area A of the bounding plates, their separation Δz, and the temperature gradient ΔT between them:

kbulk = (Q/A)·(Δz/ΔT)

(4)


This approach accounts for the statistical variation of heat flow inside the randomly packed particle bed and we have run benchmark tests using a simple cubic packing as well as randomly packed particle bed varying particle radius Rp and radius of contacts rc.

Results: Fig. 1 shows the results of calculating heat transport through particle beds in a simple cubic packing (fig. 1c) and through randomly packed beds (fig. 1d). Thermal conductivities have been determined as delineated and the results have been compared to an analytical model that parameterizes the particle contacts in terms of particle bed porosity and the average particle coordination number [6]. Assuming smooth particles of radius Rp, and thermal conductivity kp, the bulk thermal conductivity kbulk,m of the particle bed is given by [6]

kbulk,m = (4/π2)·kp ·(1-φ)C·(rc/Rp)

(5)


where φ and C are porosity and average coordination number for the particle bed, respectively. For the benchmark, particles have been assumed to be monodisperse to facilitate the comparison, but the method is readily extended to arbitrary grain-size distribution.

Fig. 1c shows thermal conductivity as a function of normalized contact radius for particle sizes between 2 and 10 mm assuming a simple cubic packing. Results of the numerical simulations are in excellent agreement with the analytic model and bulk thermal conductivity is a function of normalized contact radius only, as would be expected from Eq. (5). Results for the random packing are shown in Fig. 1d, and we observe a slight deviation from the model which remains to be investigated in further detail.

Outlook: Having established a method to calculate bulk thermal conductivity in randomly packed particle beds, we will now continue to study the influence of porosity on bulk thermal conductivity. To this end, we will use the sphere placer algorithm developed by [7] to generate particle beds with predefined porosities. The algorithm employs random ballistic deposition of particles and is able to achieve packing porosities between 42% and 85%. As the particle beds thus generated are not in mechanical equilibrium, we will introduce predefined bonds between particles or use cohesion between particles to stabilize the beds. Bulk thermal conductivity of the packing can then be determined as a function of porosity to further investigate the relationship between sample porosity and its thermal conductivity.

 References: [1] S. Watanabe et al. Space Science Reviews 208, 1 (2017), p. 3–16. [2] K. Otto et al. Earth, Planets and Space 75, 1 (2023), p. 51. [3] M. Grott et al. Nature Astronomy, 3, 971-976 (2019). [4] B. Agrawal et al. LPSC 2024 Abstract No. 1471. [5] C. Kloss et al. Progress in Computational Fluid Dynamics, An Int. J. 12, 2/3 (2012). [6] N. Sakatani et al. AIP Advances 7, 015310 (2017). [7] L. Klar et al. Granular Matter 26, 59 (2024)

How to cite: Agrawal, B., Grott, M., Kollenberg, J., Biele, J., Gundlach, B., Blum, J., Greshake, A., and Miyamoto, H.: A numerical method to determine bulk thermal conductivity of randomly packed particle beds, Europlanet Science Congress 2024, Berlin, Germany, 8–13 Sep 2024, EPSC2024-557, https://doi.org/10.5194/epsc2024-557, 2024.