SB5
Session assets
Please decide on your access
Please use the buttons below to download the presentation materials or to visit the external website where the presentation is linked. Regarding the external link, please note that Copernicus Meetings cannot accept any liability for the content and the website you will visit.
Forward to presentation link
You are going to open an external link to the presentation as indicated by the authors. Copernicus Meetings cannot accept any liability for the content and the website you will visit.
We are sorry, but presentations are only available for users who registered for the conference. Thank you.
Oral and Poster presentations and abstracts
Understanding cometary activity is key to exploring their materials and surface physics, with implications for comet formation and subsequent evolution. Outgassing produces a reaction force on nuclei that can alter their trajectory and spin, allowing constraints to be placed on comet models by measuring the observed orbit and rotation changes. For comet 67P/Churyumov-Gerasimenko, detailed measurements have been made by the Rosetta spacecraft and various attempts have been made to model the activity (see, e.g. [1,2]).
Here we will present ongoing work, testing various activity distributions in an effort to fit Rosetta outgassing, trajectory, and rotation data using the activity model of [2]. We test a number of different activity distributions over the surface of the comet by varying the Effective Active Fraction (EAF), relative to pure water ice, of facets on a shape model. We investigate different spatial patterns in EAF, and attempt to correlate them to physical features on the cometary surface. Here we are able to achieve a good fit to the Rosetta data by parameterizing EAF in terms of the different geological unit types on 67P (Fig. 1). This will have important implications for understanding how activity works on the different types of surface observed on cometary nuclei, including ‘rough’, ‘smooth’, ‘dusty’ and ‘rocky’ surface morphologies.. The objective here is to constrain the shape of the activity curve on these various surfaces that a more detailed thermal model (see, for example [3,4]) must produce in order to fit the data.
In addition to the changes in rotation period examined in [2], we also compute changes in the rotation axis, using a method based on [5] in order to compare with the observations. This provides an additional constraint on the spatial distribution of activity. Finally, we also compare the trajectory information, in the form of Earth-to-comet range, with the new analysis of Rosetta radio-tracking data performed in [6].
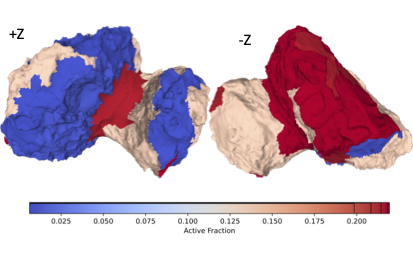
Fig. 1. Peak Effective Active Fraction over the surface of 67P for a model fit to geological unit types.
References
- Nongravitational Effects of Cometary Activity. S. Mottola, N. Attree, L. Jorda, H.U. Keller, R. Kokotanekova, D. Marshall. Space Science Reviews 216 (1), 1-20
- Constraining models of activity on comet 67P/Churyumov-Gerasimenko with Rosetta trajectory, rotation, and water production measurements. N. Attree, L. Jorda, O. Groussin, S. Mottola, N. Thomas, Y. Brouet, E. Kührt. Astronomy & Astrophysics 630, A18
- On the activity of comets: understanding the gas and dust emission from comet 67/Churyumov-Gerasimenko’s south-pole region during perihelion. B. Gundlach, M. Fulle, J. Blum. Monthly Notices of the Royal Astronomical Society, Volume 493, Issue 3, April 2020, Pages 3690–3715
- Near-perihelion activity of comet 67P/Churyumov–Gerasimenko. A first attempt of non-static analysis. Yu. Skorov, H. U. Keller, S. Mottola and P. Hartogh. Monthly Notices of the Royal Astronomical Society, Volume 494, Issue 3, May 2020, Pages 3310–3316
- Kramer, T., Laeuter, M., Hviid, S., et al. 2019. A&A, Volume 630, id.A3, 11 pp.
- Lasagni Manghi R., Zannoni M., Tortora P., Kueppers M., O'Rourke L., Martin P., Mottola S., et al., 2020, EGU General Assembly 2020, Online, 4–8 May 2020, EGU2020-19173
How to cite: Attree, N., Jorda, L., Groussin, O., Marschall, R., Lasagni Manghi, R., Tortora, P., and Zannoni, M.: Activity on different terrain types on comet 67P/Churyumov-Gerasimenko, Europlanet Science Congress 2021, online, 13–24 Sep 2021, EPSC2021-17, https://doi.org/10.5194/epsc2021-17, 2021.
Introduction
The Rosetta mission provided detailed data of the surface of the nucleus of comet 67P/Churyumov-Gerasimenko. The analysis of these data, and especially the images of the Narrow Angle Camera (NAC) from the Optical Spectroscopic and Infrared Remote Imaging System (OSIRIS instrument; Keller et al., 2007), revealed the morphological diversity of the nucleus surface (El-Maarry et al., 2019). Among these morphologies, depressions have been observed in several regions (Fig.1).
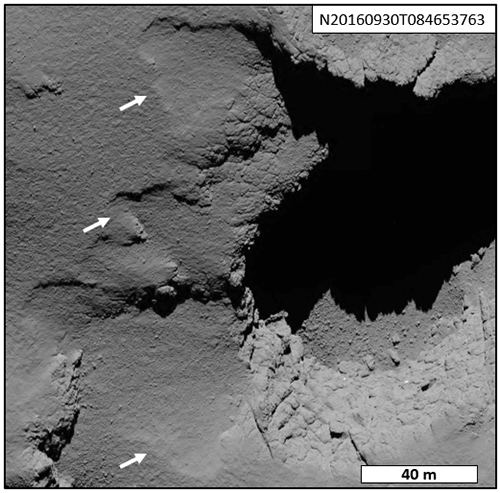
Figure 1: Example of studied depression located on Ma'at region (NAC image, 1 m/pixel). The white arrows indicate the depressions
The origin of these structures remains unclear and several hypotheses have been proposed: (1) the depressions could be indicative of scarp retreat (Vincent et al., 2016; El-Maary et al., 2017), (2) they mark the location of future cliff collapses (Pajola et al., 2016d), and (3) they are seasonal structures shaped by the changes induced by perihelion approach (Groussin et al., 2015). In a previous study, we studied two of these depressions, located in the Ash region, by a comparative morphometrical analysis (Bouquety et al., 2021). We observed that the two depressions grew by several meters during the last perihelion passage, and that this growth is not necessarily linked with cliff collapses. Thus, in that case, the sublimation of ices certainly played a key role in shaping these depressions.
On Earth and Mars, there are similar depressions with the same shape and geometry that are controlled by thaw processes. These depressions are called thermokarstic lakes on Earth and scallops depressions on Mars (Fig.2). On both planets, these periglacial structures result from the degradation of an ice rich permafrost (Costard and Kargel, 1995; Morgenstern et al., 2007; Séjourné et al., 2011).
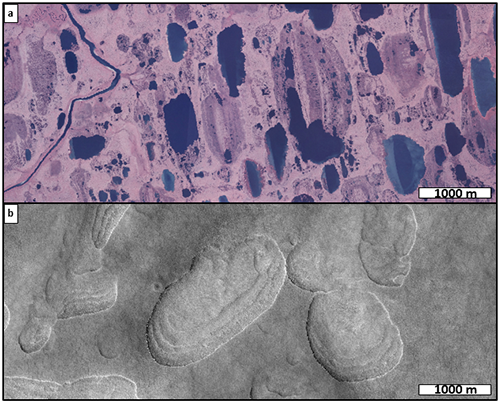
Figure 2: Example of thaw depressions. (a) Thermokarstic lakes in Alaska on Earth (Digital Orthophoto Quadrangle DOQ, 5 m/pixel). (b) Scalloped terrain in Utopia planitia on Mars (HiRISE image, 50 cm/pixel).
Due to their processes and morphological similarities, we decided to compare the depressions observed on 67P’s surface with thermokarstic lakes on Earth and scallops depressions on Mars to constrain their origin.
Data and Method
We used the same method as in Bouquety et al., (2021). This comparative morphometrical analysis (CMA) allows to study surface features via a morphological and geometrical approach, with a great level of detail, in order to build an interplanetary database which can be used for comparison.
In order to perform the comparison, a list of parameters and criteria that can be applied on Earth, Mars and 67P. For each depression we measured 10 parameters: the length, width, area, perimeter, depth, slope (max, min, mean), elongation and the circularity index (Ulrich et al., 2010; Séjourné et al., 2011; Morgenstern et al., 2011; Niu et al., 2014). Based on different dataset and their associated DTM (Earth: DOQ/3DEP; Mars: HiRISE/HiRISE DTM; 67P: NAC/SPC method (Jorda et al.,2016)), we measured a total of 432 depressions, namely 200 on Mars (Utopia planitia), 101 on Earth (Arctic coastal plain) and 131 on the whole 67P’s surface.
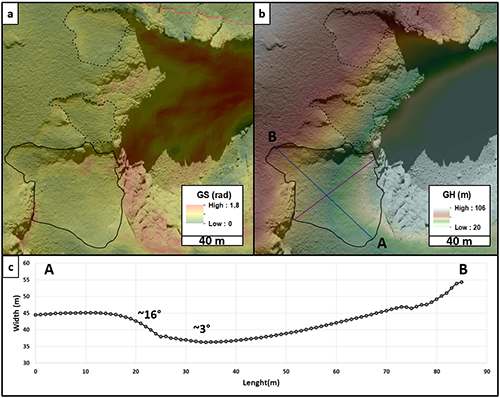
Figure 3: Example of measurement. Gravitational: (a) slopes and (b) height draped on NAC images. (c) Topographic profile extracted from GH.
Results and interpretations
The depressions are exclusively located in terrains covered by fine deposit particules (FDP), and seems to be present in all topographical contexts. The highest depression densities are located on the body, where FPD covers the majority of the region (Thomas et al., (2018); Fig.4).
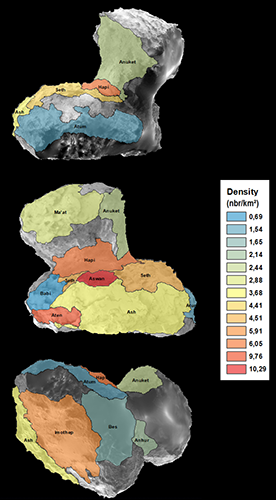
Figure 4: Density map of the measured depression according to the region.
The analysis also revealed that the set of measured parameters is consistent with the references known in the literature. Remarkably, all the measured parameters on 67P depressions are included in the range that characterized scallops terrains on Mars and thermokarstic lakes on Earth (Ulrich et al., 2010; Séjourné et al., 2011; Morgenstern et al., 2011; Niu et al., 2014). Moreover, depressions from 67P follow the same area/perimeter trend as scallops on Mars and thermokarstic lakes on Earth (Fig.5). Finally, more than 90% of 67P depressions topographic profiles show a slope asymmetry (Fig.1c). This slope asymmetry has been observed on thermokarstic lakes on Earth and scallops on Mars and interpreted to be characteristic of depressions shaped by the obliquity-driven insolation (Plescia, 2003; Morgenstern et al., 2007; Séjournée et al., 2011).
Figure 5: Area versus perimeter for all the measured depressions on 67P, Mars, and Earth.
These three results indicate that: (1) the depressions from 67P follow the same growth ratio than the scallops and the thermokarstic lakes while keeping their characteristic circularity, and (2) the sublimation induced by perihelion passages is the main erosion process that shaped these depressions on the comet (Bouquety et al., 2021). Our morphometrical analysis allowed to conclude that depressions on 67P are analogues to scalloped terrain on Mars and thermokarstic lakes on Earth.
References
Bouquety, A., Jorda, L., Groussin, O., et al. 2021, Astronomy & Astrophysics
Costard, F., Kargel, J., 1995, Icarus 114, 93-112
El-Maarry, M. R., Groussin, O., Thomas, N., et al. 2017, Science, 355, 1392
El-Maarry, M. R., Groussin, O., Keller, H. U., et al. 2019, Space Science Reviews, 215
Groussin, O., Sierks, H., Barbieri, C., et al. 2015b, Astronomy & Astrophysics, 583, A36
Jorda, L., Gaskell, R., Capanna, C., et al. 2016, Icarus, 277, 257
Keller, H. U., Barbieri, C., Lamy, P., et al. 2007, Space Science Reviews, 128, 433
Morgenstern, A., Hauber, E., Reiss, D., et al. 2007, J. Geophys. Res. 112, E0600.
Morgenstern, A., Grosse, G., Günther, F., et al. 2011, The cryosphere, 5, 4
Niu, F., Luo, J., Lin, Z., et al. 2014, Arctic, Antarctic, and Alpine Research, 46:4, 963-974
Pajola, M., Oklay, N., Forgia, F. L., et al. 2016, Astronomy & Astrophysics, 592, A69
Plescia, J.B., 2003. 34th Lunar Planetary Science, abstract# 1478.
Séjourné, A., Costard, F., Gargani, J., et al. 2011, Planetary and Space Science 59, 412-422
Thomas, N., El-Maarry, M. R., Theologou, P., et al. 2018 Planetary and Space Science 164, 19-36
Ulrich, M., Morgenstern,A., Gunther, F., et al.2010. J. Geophys. Res. 115(E10), E10009
Vincent, J.-B., Oklay, N., Pajola, M., et al. 2016, Astronomy & Astrophysics, 587, A14
How to cite: Bouquety, A., Groussin, O., Jorda, L., Séjourné, A., Costard, F., and Bouley, S.: Evidence for scalloped terrains on 67P, Europlanet Science Congress 2021, online, 13–24 Sep 2021, EPSC2021-25, https://doi.org/10.5194/epsc2021-25, 2021.
Introduction: The data from the Rosetta mission enabled the reconstruction of the shape of comet 67P/Churyumov-Gerasimenko (hereafter 67P) and the identification of the terrains and features forming its surface. The highly irregular shape of the comet poses a challenge for the depiction of these geological features on two-dimensional maps.
Techniques: Standard global map projections cannot display the complete surface of 67P because different points on the surface can have the same longitude and latitude. As a consequence, the geological maps published to date are created on top of comet images, making them dependent on the viewing angle and image coverage and resolution.
Here, we make use of the recently published Quincuncial Adaptive Closed Kohonen (QuACK) map [1]. It projects the complete surface of 67P unambiguously onto a square. The QuACK map is topologically equivalent to the Peirce quincuncial projection of the world, which makes it possible to define generalized longitudes and latitudes. These can be used within any global map projection in order to obtain an unambiguous QuACK version.
Results: The mapping of geological features is carried out in three dimensions employing the Small Body Mapping Tool (SBMT), Fig. 1. We use images from the OSIRIS Narrow Angle Camera aboard Rosetta which have been projected onto the shape model of the SBMT, Fig. 2. The three-dimensional coordinates are then projected onto two-dimensional maps, either in the QuACK map projection or in the QuACK version of the equidistant cylindrical projection, Fig. 3. We present individual maps for 17 of the 26 regions of 67P, mostly located in the northern hemisphere. The new maps combine features published in previous studies with newly identified features.
We discuss the distribution of geological features and the characteristics of the regions. In order to align region boundaries with geological features, we propose two modifications of region definitions. Products are fully available to the community through the PSA Guest Storage Facility [2].
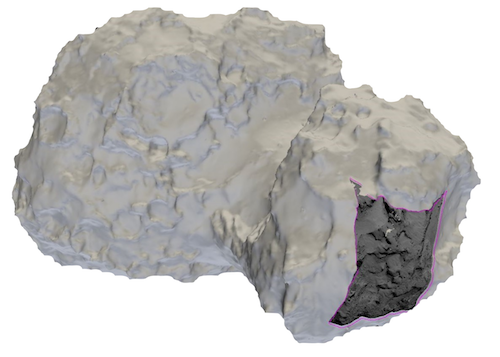
Fig. 1: OSIRIS image projected onto the shape model using the SBMT.
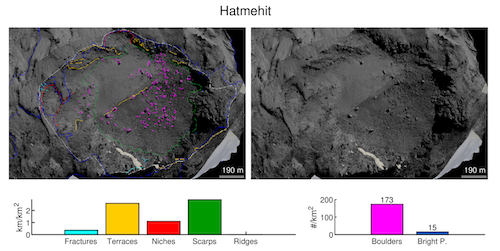
Fig 2: Identification of features in the Hatmehit region from images projected on the SHAP4S shape model and annotated on the SBMT.
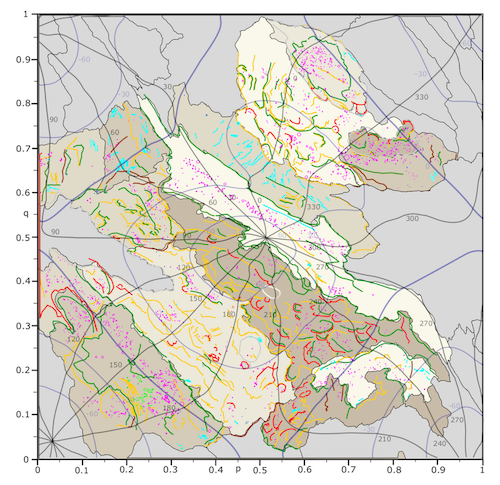
Fig 3: Combined geological map of regions in North centered QuACK projection.
Acknowledgments: The authors thank the European Space Research and Technology Centre and the European Space Astronomy Center faculty councils for supporting this research. M. Leon-Dasi was supported by an internship from the European Space Agency (ESA) at the European Space Astronomy Center, Madrid, in the period March to December 2020.
References: [1] Grieger (2019) A&A, 630, doi:10.1051/0004-6361/201834841. [2] Besse, S. et al. (2017) Planetary and Space Science, 10.1016/j.pss.2017.07.013.
How to cite: Besse, S., Leon-Dasi, M., Grieger, B., and Kueppers, M.: Mapping a Duck: Geological Features and Region Definitions on Comet 67P/Churyumov-Gerasimenko, Europlanet Science Congress 2021, online, 13–24 Sep 2021, EPSC2021-43, https://doi.org/10.5194/epsc2021-43, 2021.
We have analyzed high-resolution images of the Wosret region acquired at different wavelength in the 400-1000 nm range with the NAC camera of the OSIRIS imaging system on board the Rosetta mission. This region is located on the small lobe of the 67P/Churyumov-Gerasimenko comet and it is subject to strong heating during the perihelion passage. It includes the two last landing sites of the Philae lander, and notably Abydos, the final one where the lander performed most of its measurements.
Wosret has unique geomorphological features among the 26 regions of comet 67P showing a high erosion level, a pervasive fracturing, and an overall lack of dust deposits compared to other regions. It is also one of the most active regions, showing the highest estimated water production rate [1] and originating about 40 activity events, including one of the brightest outburst caught by Rosetta observations.
We observed a few morphological changes in Wosret, related to local dust coating removal with estimated depth of about 1 m, and the formation of a cavity measuring 30 m in length corresponding to a total mass loss of 1.2x10⁶ kg. The spectrophotometry of the region is typical of medium-red regions of comet 67P, with spectral slope values of 15-16 %/(100 nm) in pre-perihelion data acquired at phase angle 60o. Few tiny bright spots are observed, but very small in size (1-1.5 m2). One of them is very bright and we estimated a local water icy enrichment up to 60%. Morphological features like goosebumps/clods are widely present in Wosret, and they appear consolidated, highly irregular in shape and height. Their measured equivalent diameter ranges from 2 to about 12 m, with an average value of 4.7±1.5 m.
By comparing the physical ad mechanical properties of Wosret with those of Anhur and Khonsu [2,3], two southern hemisphere regions located in the big lobe, highly active, and that experienced the same high heating level than Wosret, we highlight some differences between the two lobes:
1) First of all, the water ice-enriched regions directly exposed at the surface of Wosret are less frequent and smaller in size than those observed in Anhur, where water ice rich area of several squared meters and up to 1600 m2 were observed [4]. Also, the spectrally bluer area ice-enriched by frost, usually found close to shadows, are less frequently observed in Wosret.
2) All these three regions are highly active, but the activity results in different surface re-shaping. In fact important morphological changes were observed in Anhur and Khonsu (new scarps, dust bank removal up to 14m in depth, vanishing structures of several tenth of meters in length, boulders displacement and fragmentation, cavities formation) corresponding to a total mass loss in the order of 108 kg [2,3]. Conversely, no major morphological changes are observed in Wosret except for the formation of a new cavity, and the dust coating removal tentatively estimated in about 1 m depth, locally. We discard observation biases because these regions were observed under similar spatial resolution and illumination conditions pre- and post-perihelion.
3) Polygonal block in Wosret are, on average, two times larger than the goosebumps/clods found in different regions of the big lobe. These structures have been interpreted as being representative of the original cometesimals forming, by aggregation, cometary nuclei, or as result of fracturing processes caused by seasonal and diurnal thermal gradients.
Morphological analysis of the 67P regions alone also points to differences in the physical and mechanical properties of the material composing the two lobes of 67P nucleus [5]. The limited morphological changes and low exposure of volatiles observed in Wosret compared to Anhur/Khonsu indicate that the surface material on Wosret could be less fragile and more consolidated than the one composing the southern regions of the big lobe, and that the small lobe could have a lower volatile content, at least on its top layers, than the big lobe.
All these evidences support the hypothesis, formulated by Massironi et al. [6] from the analysis of the layering of two lobes, that comet 67P is composed of two distinct bodies that merged during a low-velocity collision in the early Solar System.
References: [1] Marshall et al., 2017, A&A 603, A87; [2] Fornasier et al., 2019, A&A 630, A13; [3] Hasselmann et al., 2019, A&A 639, A8, [4] Fornasier et al., 2016, Science 354, 1566; [5] El-Maarry et al., 2016, A&A 593, A110; [6] Massironi et al., 2015, Nature 526, 402
How to cite: Fornasier, S., Bourdelle de Micas, J., Hasselmann, P. H., Hong Hoang, V., Barucci, M. A., and Sierks, H.: Differences between the small and big lobes of 67P/Churyumov-Gerasimenko comet revealed from highly eroded regions analysis, Europlanet Science Congress 2021, online, 13–24 Sep 2021, EPSC2021-171, https://doi.org/10.5194/epsc2021-171, 2021.
In this work, the motion of dust particles in the coma of the comet 67P/Churyumov-Gerasimenko is investigated. This is done by analyzing sets of images taken by OSIRIS, the main imaging system on board Rosetta, in which these dust particles can be seen as bright tracks instead of points sources, as result of the combination of motions of both particles and spacecraft. A fundamental obstacle to deriving the dust size and velocity distribution from such data is that without additional information, the apparent brightness of a particle constrains only the ratio of size and distance, but neither quantity individually.
While previous works in this area focused on obtaining the distance to individual detected particles in the image, a novel approach to analyze the dynamics of the dust is introduced in this work. This new approach is based on the statistical comparison between the images obtained by the camera, and synthetic images created by modeling the dynamics of the dust in the coma. The main advantage of this approach is to bypass the mentioned distance determination to the particles, which lifts the strict requirement on the observation conditions that were imposed by the earlier methods. This allows us to analyze a much larger set of images, and then, characterize the dust distribution and dynamics at the coma in a variety of conditions.
Our method can be divided in three main parts. First, dust tracks on the OSIRIS images are detected using an algorithm based on the Hough transform method. Secondly, the trajectories of dust particles under the influence of gas drag, nucleus gravity, and solar radiation pressure are modeled. These trajectories vary depending on the dust properties, such as density and size. The combination of the trajectories and the information about spacecraft position and orientation allows us to generate synthetic images for each type of modeled dust. Lastly, the distribution of selected track properties, like orientation, length and total brightness, obtained from the real images, is fitted by combining the ones obtained from the synthetic images. This allows us to estimate the contents of each type of dust in the coma.
How to cite: Lemos, P.: Dust distribution and dynamics in the coma of 67P/Churyumov-Gerasimenko, Europlanet Science Congress 2021, online, 13–24 Sep 2021, EPSC2021-256, https://doi.org/10.5194/epsc2021-256, 2021.
Introduction
Some of the comets visited by spacecraft missions display some circular depressions at their surface: 81P/Wild 2 (Brownlee et al. 2004), 9P/Tempel 1 (Belton et al. 2013), 103P/Hartley 2 (Bruck Syal et al. 2013), 67P/C-G (Vincent et al. 2015). For 67P, they consist of circular holes, half holes or cliffs, with a size range of tens of meters to a few hundreds of meters (Ip et al. 2016). Owing to the high precision of the shape model obtained from the Rosetta/OSIRIS images (Preusker et al. 2015, Sierks et al. 2015), it is possible to investigate the thermal processing of 67P’s surface in relation to the formation and evolution of these features (Mousis et al. 2015, Vincent et al. 2015, Guilbert-Lepoutre et al. 2016).
Methods
We aim to investigate the formation and evolution of 67P’s circular depressions (or pits, thereafter) by thermally-induced processes (for instance sublimation and amorphous water ice crystallization) on its current orbit. In a departure from the aforementioned studies, we consider a high-resolution shape model of the nucleus, which allows to study several facets for each pit: at the bottom, and on the walls. For each facet, the complete thermal environment is considered, including self-heating and shadowing, either by neighboring facets or due to the complex global morphology of the comet. We compute the illumination, self-heating and shadowing conditions for 125k facets during a full orbit, with a time step of ~8 min, then use these conditions as an input of a 1D thermal evolution model for each facet. The model includes standard features: heat conduction, phase transitions, gas diffusion, erosion, dust mantling (De Sanctis et al. 2005, 2010, Lasue et al. 2008). Various initial setups have been considered, and many tests were conducted to assess the influence of each parameter. The behaviour of 30 circular depressions (pits, half pits and cliffs) was studied in detail (see Figure 1).
Results and discussion
- We find that the following processes do not contribute significantly to the evolution of pits: sublimation of CO and CO2, crystallization of amorphous water ice, and dust mantling. When added to the model, they induce a relatively limited effect, altering the results by less than 10%. Sublimation of water, and therefore erosion, is the main acting process.
- We find that direct illumination is the main driver for gas production and erosion. Self-heating is not negligible, and in many cases, it allows to sustain some processing for longer periods of time and enhance local erosion. This is especially true for surface features located close to the neck, where facets additionally receive the VIS+IR flux from the small lobe. The total flux received per orbit is crucial, so is the flux received at perihelion. In this regard, we find strong differences between the Northern and Southern hemispheres of the nucleus, observed in other studies (Keller et al. 2015, Tosi et al. 2019). Finally, there is a tendency for facets in the North which are directed towards the equator to sustain more erosion than other facets at similar latitudes.
- At the scale of a given pit, there is a general tendency for cliffs and walls to receive more energy than the bottoms, and thus erode more. With time, the fate of a circular depression on 67P is thus to become wider and shallower. Nevertheless, in limited instances of small deep pits (such as Seth01), self-heating can be the driver for erosion of both the walls and bottom, since direct illumination is very limited. However, local erosion rates remain relatively low compared to erosion rates sustained by pits with direct illumination by the Sun.
- In general, we find that the erosion sustained after 10 orbits cannot reach the size extent of pits as they were observed by Rosetta. It is therefore very unlikely that current illumination conditions were able to produce those features. This results joins previous studies (Besse et al. 2015, 2017, Guilbert-Lepoutre et al. 2016).
- Because we have performed this study with a uniform set of thermo-physical parameters for all facets, we cannot exclude that local heterogeneities, such as the presence of ice patches in the bottom of some pits (Lamy et al. 2018) may help accelerate the erosion at depths in those pits.
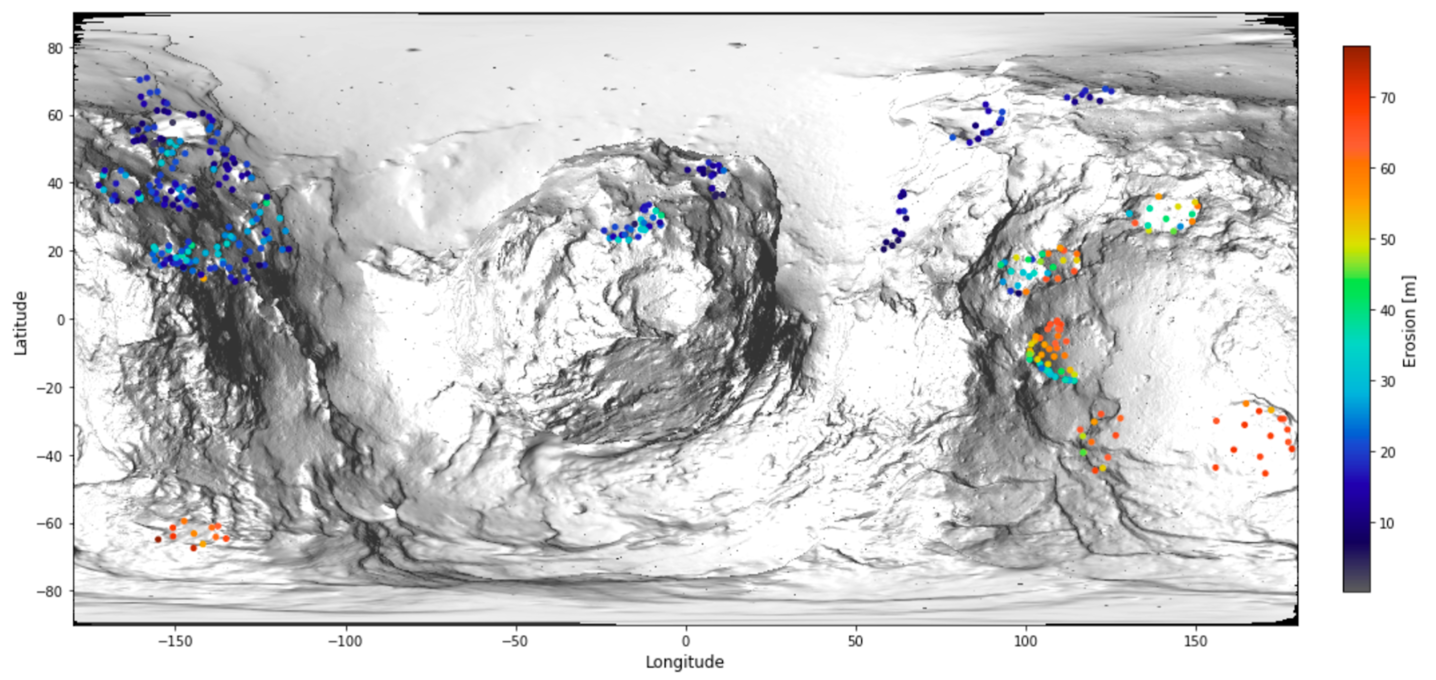
Fig .1: Erosion sustained after 10 orbits in the current illumination conditions (solar+shadowing+self-heating), for a selection of facets in the 125k resolution shape model.
Acknowledgements
This study is part of a project that has received funding from the European Research Council (ERC) under the European Union’s Horizon 2020 research and innovation programme (Grant agreement No. 802699). We gratefully acknowledge support from the PSMN (Pôle Scientifique de Modélisation Numérique) of the ENS de Lyon for the computing resources.
References
Belton et al. (2013) Icarus, 222, 477-486
Besse et al. (2015) EPSC conference, id.EPSC2015-114
Besse et al. (2017) ACM conference
Brownlee et al. (2004) Science, 304, 1764-1769
Bruck Syal et al. (2013) Icarus, 222, 610-624
De Sanctis et al. (2005) A&A, 444, 605-614
De Sanctis et al. (2010) Icarus, 207, 341-358
Guilbert et al. (2016) MNRAS, 462, 146-155
Ip et al. (2016) A&A, EDP Sciences, 591, A132
Keller et al. (2015) A&A, 583, A34
Lamy et al. (2018) COSPAR Scientific Assembly, id. B1.1-6-18
Lasue et al. (2008) P&SS, 56, 1977-1991
Mousis et al. (2015) ApJL, 814, L5
Preusker et al. (2015) A&A, 583, A33
Sierks et al. (2015) Science, 347, aaa1044
Tosi et al. (2019) Nat. Astron, 3, 649-658
Vincent et al. (2015) Nature, 523, 63-66
How to cite: Benseguane, S., Guilbert-Lepoutre, A., Lasue, J., Leyrat, C., Besse, S., Beth, A., Costa Sitjà, M., Grieger, B., and Teresa Capria, M.: A new take on the formation and evolution of circular depressions at the surface of 67P/Churyumov-Gerasimenko, Europlanet Science Congress 2021, online, 13–24 Sep 2021, EPSC2021-303, https://doi.org/10.5194/epsc2021-303, 2021.
50 years of astrometric data for comet 67P/C-G (orbital period about 6.45 years) provides a unique opportunity to benchmark non-gravitational acceleration models to the in situ measurements of the volatile release performed from the Rosetta rendezvous mission (2014-2016). Taken together, the Earth-bound and in-situ data yields lower fit errors and serves as a test-case for our ability to deduce thermo- physical quantities of cometary nuclei from the Earth-bound observations.
Introduction
The long-term monitoring of orbital changes of periodic comets provides limits on the non-gravitational forces arising from the sublimation of icy volatiles on cometary nuclei. For comet 67P/C-G various orbit reconstructions have been published [1], the ESOC/Flight Dynamics (FD) data [2,3], and the combined radar-ranging ground-based astrometry fit to MPEC data [4,5].
Here, we consider a model for the non-gravitational accelerations (NGA) for comet 67P/C-G including the available MPEC observations from 1969 up to the year 2018. For the duration of the Rosetta mission around comet 67P/C-G (2014-2016), the NGA can be compared to the observed outgassing as probed by the in situ Rosetta COPS/DFMS instruments [6,7,8]. We retrieve several thermophysical properties of the nucleus from the NGA analysis, including the diurnal thermal lag angle and the seasonal progression of the sub-solar latitude.
During the Rosetta mission comet 67P/C-G displayed remarkable repetitive diurnal and seasonal variations for dust and gas emission, which resulted in a highly predictable near-nucleus dust-coma [9,10]. While around perihelion several outbursts have been observed [11] from nucleus locations with a higher volatile content [6,7], the overall activity of comet 67P/C-G is largely regular and follows the seasonal illumination patterns [8]. The known orientation of the rotation axis of comet 67P/C-G and the minor orientation changes induced by the outgassing [12,13] allow one to extrapolate the derived NGA from 2014-2016 [1] back several decades up to the first observations in 1969 and to predict the orbit for the upcoming apparition.
Rotating jet model
Here, we propose a refined set of rotating jet parameters compared to [5], which more closely follows the NGA extracted by [1] and covers all observed 7 revolutions of 67P/C-G. We provide a prediction for the upcoming 2021/22 apparition. The accurate orbit analysis of comet 67P/C-G serves as a reference case for description of NGA acting on cometary nuclei [14].
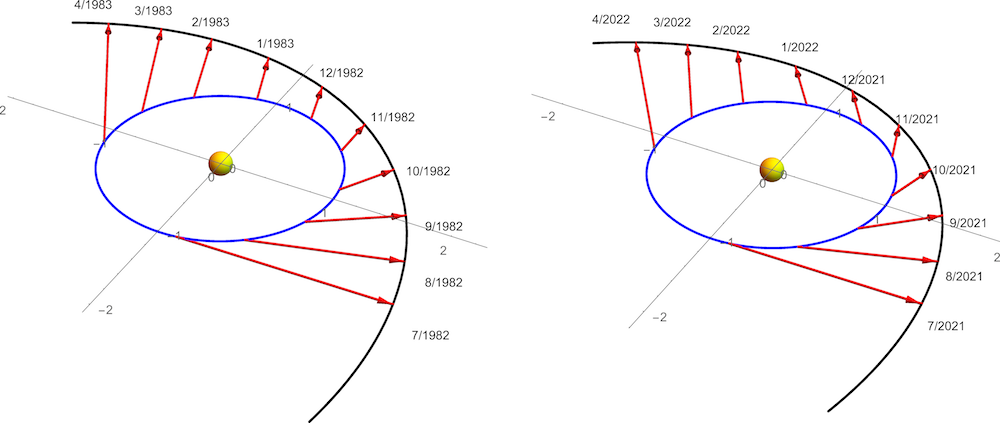
The favorable Earth-comet geometry of the 1982/82 apparition (left panel, Fig. 1) provides strong constraints on the NGA, where trajectory errors of about 30000 km perpendicular to the line-of sight result in astrometric errors in the order of 100 arcsec. A similarly viewing geometry occurs in 2021/22 and allows us to test the performance of activity models based on thermophysical properties of the nucleus.Conclusion
The case of comet 67P/C-G shows the achievable precision of the orbit reconstruction by connecting space-craft observations and long-term Earth based astrometry. We expect that also for other comets with known rotation-axis the RJM provides a good tool to constrain the water production and to improve the models upon the standard Marsden parameters. A promising example is comet 46P/Wirtanen, where the rotational state is well known [15], in addition to the shape information from radar observations. The (dis)similarities of the two RJM discussed here shows the maximum accuracy to be expected from such parametrizations. In general additional fit parameters tend to yield better agreement between models and observations. For comet 67P/C-G we find improved volatile production based on thermo-physical models compared to the asymmetric g(r) Marsden model.
Acknowledgments
The work was supported by the North-German Supercomputing Alliance (HLRN). We have used MPEC data [4].
References
[1] T. Kramer and M Läuter. Outgassing-induced acceleration of comet 67P/Churyumov-Gerasimenko. Astronomy & Astrophysics, 630:A4, 2019.
[2] B. Godard, F. Budnik, P. Munoz, T. Morley, and V. Janarthanan. Orbit Determination of Rosetta Around Comet 67P/Churyumov-Gerasimenko. Proceedings 25th International Symposium on Space Flight Dynamics–25th ISSFD, Munich, Germany, 2015.
[3] B. Godard, F. Budnik, G. Bellei, and T. Morley. Multi-arc Orbit Determination to determine Rosetta trajectory and 67P physical parameters. In International Symposium on Space Flight Dynamics-26th ISSFD, 2017.
[4] MPEC. IAU Minor Planet Center, 2021.
[5] D. Farnocchia, J. Bellerose, S. Bhaskaran, M. Micheli, and R. Weryk. High-fidelity comet 67P ephemeris and predictions based on Rosetta data. Icarus, page 114276, December 2020.
[6] T. Kramer, M.Läuter, M. Rubin, and K. Altwegg. Seasonal changes of the volatile density in the coma and on the surface of comet 67P/Churyumov-Gerasimenko. MNRAS, 469(Suppl 2):S20–S28, July 2017.
[7] M. Läuter, Tobias Kramer, Martin Rubin, and K. Altwegg. Surface localization of gas sources on comet 67P/Churyumov-Gerasimenko based on DFMS/COPS data. MNRAS, 483:852–861, 2019.
[8] M. Läuter, Tobias Kramer, Martin Rubin, and K. Altwegg. The gas production of 14 species from comet 67P/Churyumov-Gerasimenko based on DFMS/COPS data from 2014-2016. MNRAS, 498(3):3995–4004, September 2020.
[9] T. Kramer and M. Noack. On the origin of inner coma structures observed by Rosetta during a diurnal rotation of comet 67P/Churyumov–Gerasimenko. The Astrophysical Journal, 823(1):L11– L11, May 2016.
[10] T. Kramer, M. Noack, D. Baum, H.C. Hege, and E.J. Heller. Dust and gas emission from cometary nuclei: The case of comet 67P/Churyumov–Gerasimenko. Advances in Physics: X, 3(1):1404436–1404436, January 2018.
[11] J.-B. Vincent, et al. Summer fireworks on comet 67P. MNRAS, 462(Suppl 1):S184–S194, November 2016.
[12] H. U. Keller, S. Mottola, Y. Skorov, and L. Jorda. The changing rotation period of comet 67P/Churyumov-Gerasimenko controlled by its activity. Astronomy & Astrophysics, 579(March):L5– L5, July 2015.
[13]T. Kramer, M. Läuter, S. Hviid, L. Jorda, H.U. Keller, and E. Kührt. Comet 67P/Churyumov-Gerasimenko rotation changes derived from sublimation-induced torques. Astronomy & Astrophysics, 630:A3, January 2019.
[14] S. Mottola, N. Attree, L. Jorda, H.U. Keller, R. Kokotanekova, D. Marshall, and Y. Skorov. Nongravitational Effects of Cometary Activity. Space Science Reviews, 216(2):2, February 2020.
[15] T. Farnham, M. Knight, D. Schleicher, L. Feaga, D. Bodewits, B. Skiff, and J. Schindler. Narrowband Observations of Comet 46P/Wirtanen during its Exceptional Apparition of 2018/19. I. Apparent Rotation Period and Outbursts. The Planetary Science Journal, 2(1):7, January 2021.
How to cite: Kramer, T. and Läuter, M.: Matching the activity of comet 67P/Churyumov-Gerasimenko with long-term ground-based astrometry, Europlanet Science Congress 2021, online, 13–24 Sep 2021, EPSC2021-337, https://doi.org/10.5194/epsc2021-337, 2021.
Comets are believed to have preserved pristine material from the early stages of the Solar System formation, thus providing unique information on intricate processes like dust growth mechanisms. The Rosetta mission gave us the best opportunity to investigate nearly pristine cometary dust particles of comet 67P/Churyumov–Gerasimenko. Among the three in-situ dust instruments, the MIDAS (Micro-Imaging Dust Analysis System) atomic force microscope collected cometary dust particles with sizes from hundreds of nanometres to tens of micrometres and recorded their 3D topography, size, shape, morphology, and related parameters [1].
MIDAS collected dust emitted from comet 67P on dedicated targets. Particles fell through the entry funnel and collided with the collection targets [2] causing an unknown degree of particle alteration. To understand which structural properties of the dust remained pristine and can be used to understand comets and early Solar System processes it is important to understand the collection alteration. Dedicated laboratory experiments were carried out by previous studies [3, 4]. They found that the degree of alteration upon collection is strongly determined by the particle size, strength, and the collection velocity. They indicate that particles in the MIDAS size range deposited with moderate velocities about less than a few metres per second can stick on a target without major alteration.
We aim to determine the structurally least altered MIDAS particles and investigate their properties. As database we use an improved version of the MIDAS particle catalogue [5]. Selecting all particles suitable for our analysis (e.g., cometary origin, sufficiently high image quality) grants us topographic data of over 600 nano- to micrometre-sized dust particles of comet 67P. We create dust coverage maps showing the distribution of the selected dust particles on the collection targets. As first, simple classification we divide the particles into those detected in clusters, suggested to be fragments originating in a shattering event of one large parent particle, and those remote from others that are potentially individually collected particles. Finally, we use a shape descriptor to categorise the particles according to their characteristics, e.g., shape and size, and compare to previous results from COSIMA [6] and simulation/laboratory studies [3, 7].
[1] Bentley, M.S., Schmied, R., Mannel, T., et al. 2016, Nature, 537
[2] Bentley, M. S., Arends, H., Butler, B., et al. 2016, Acta Astronautica, 125, 11
[3] Ellerbroek, L. E., Gundlach, B., Landeck, A., et al. 2017, MNRAS, 469, S204
[4] Ellerbroek, L. E., Gundlach, B., Landeck, A., et al. 2019, MNRAS, 486, S3755
[5] Boakes, P., and the MIDAS team, 2018. ‘MIDAS Particle Catalogue’. ESA Planetary Science Archive Dataset: RO-C-MIDAS-5-PRL-TO-EXT3-V2.0. Product ID: RO-C-MIDAS-5-PRL-TO-EXT3-V2.0
[6] Langevin, Y., Hilchenbach, M., Ligier, N., et al. 2016, Icarus, 271, 76
[7] Lasue, J., Maroger, I., Botet, R., et al. 2019, A&A, 630,
How to cite: Kim, M., Mannel, T., Lasue, J., Bentely, M., and Moissl, R.: Collection alteration and pristine structural properties of dust particles collected by MIDAS/Rosetta at comet 67P/Churyumov-Gerasimenko, Europlanet Science Congress 2021, online, 13–24 Sep 2021, EPSC2021-475, https://doi.org/10.5194/epsc2021-475, 2021.
Using data from Rosetta/ROSINA’s Double Focusing Mass Spectrometer (DFMS), a zoo of neutral molecules have been discovered in the coma of 67P/Churyumov-Gerasimenko, which led to a wealth of new insights regarding the comet itself, its formation and the early history of our Solar System.
A comprehensive understanding of the overall comet composition requires information on all species involved i.e. the volatiles, semi-volatiles and refractories in the coma. However, while ROSINA targets volatiles and GIADA, MIDAS and COSIMA studied refractories, no instrument on Rosetta provides measurements specifically of semi-volatiles. In some circumstances, ROSINA/DFMS may provide at least some information on semi-volatiles in the coma. As semi-volatile species are progressively released from the grains into the gas coma (their release depends on cometocentric distance and grain size), they can be identified if the abundance ratio of a candidate semi-volatile species (or a fragment thereof) to a volatile species increases as a function of distance from the nucleus. This constitutes a so-called distributed source in the coma.
With a mass spectrometer like DFMS, one does not detect neutral coma species, but rather the ionized products thereof after electron impact ionization. A major difficulty is assigning the observed ions to parent neutrals. As semi-volatile species have a low abundance, sum spectra obtained through accumulation of individual DFMS spectra can improve the signal-to-noise ratio in order to provide decisive information for identification. Accurate sum spectra can only be obtained provided all instrument-dependent effects are accounted for.
This contribution focuses on the procedure used to create sum spectra and presents some typical results.
How to cite: Dhooghe, F., De Keyser, J., Altwegg, K., Cessateur, G., Jehin, E., Maggiolo, R., and Rubin, M.: The next step for Rosetta ROSINA/DMFS data of comet 67P/Churyumov-Gerasimenko: the search for semi-volatiles species., Europlanet Science Congress 2021, online, 13–24 Sep 2021, EPSC2021-488, https://doi.org/10.5194/epsc2021-488, 2021.
Rosetta was a mission developed by the European Space Agency aimed at the prolonged study of a remnant of the Solar System formation: the Jupiter-family comet 67P/Churyumov-Gerasimenko (hereafter, 67P). After ten years of travel, on 6 August 2014 the Rosetta spacecraft arrived at its target and an observation campaign of almost two years started.
The spacecraft was equipped with various instruments designed to analyze cometary dust in 67P's coma, such as the Micro-Imaging Dust Analysis System (MIDAS; Riedler et al. 2007), the Grain Impact Analyzer and Dust Accumulator (GIADA; Colangeli et al. 2007), and the COmetary Secondary Ion Mass Analyser (COSIMA; Kissel et al. 2007). In Pestoni et al. (2021), we demonstrated that, although not designed for this purpose, also the ram gauge (RG) of the Rosetta Orbiter Spectrometer for Ion and Neutral Analysis COmet Pressure Sensor (ROSINA-COPS; Balsiger et al. 2007) may be used to obtain information on the cometary dust, namely its volatile content. This was possible as the RG reported abruptly density increases generated by the sublimation of the ice fraction of cometary particles impacting the instrument.
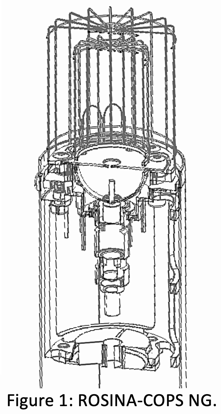
We show that also the second gauge of ROSINA-COPS, the nude gauge (NG, see Figure 1), can obtain information about 67P dust particles (Pestoni et al. 2021, accepted for publication on A&A).
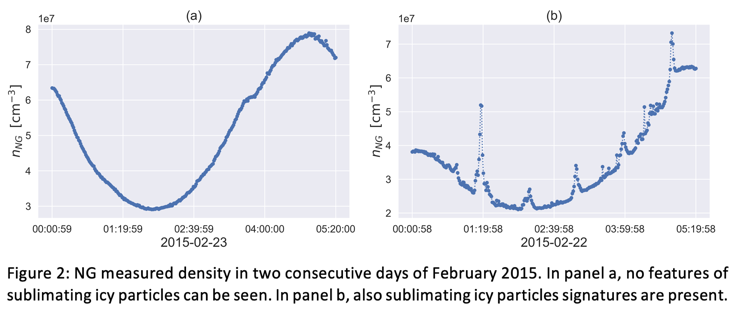
With the same procedure employed to extract sublimation features from the RG measurement dataset, 67000 sublimation features are discovered in the NG measurements. For the RG features, a fit of the density decrease back to nominal values was performed (Pestoni et al. 2021). This is not possible for the NG features, as the latter have a much shorter duration (see panel b of Figure 2). The dissimilar duration of the sublimation signatures is due to the different designs of the two gauges (Balsiger et al. 2007); in fact, the open design of the NG does not prevent volatiles from escaping the instrument. Therefore, only the feature height over the nominal background can be extracted from the NG data. Nevertheless, we perform several statistical analyses by relating the number of detections and the features height with the heliocentric and cometocentric distances, parameters related to the ROSINA-COPS orientation to 67P, as well as water production rates and dust brightnesses obtained from previous studies, such as Snodgrass et al. (2016) and Hansen et al. (2016).
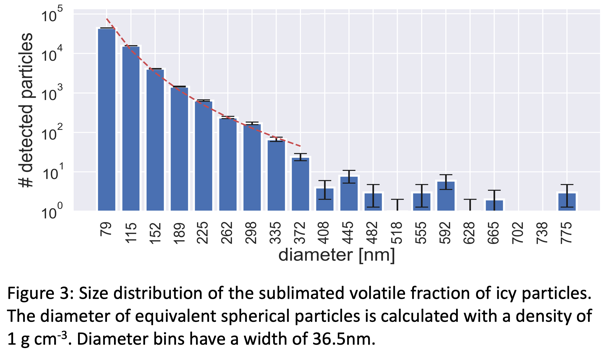
It is found that the NG detection rate is strongly correlated to 67P cometary gas activity and that the shedding of a cover of dust during the 67P approach to perihelion (Schulz et al. 2015) can be extended to the volatile content as well. Moreover, by representing the sublimating volatile contents as equivalent spheres having a density of 1 g cm-3, diameters between 60 and 793 nanometers are derived (see Figure 3). The equivalent spheres with a diameter lower than 390 nanometers have a size distribution power index (-4.79±0.26) which is smaller than those obtained by the aforementioned instruments dedicated to the observation of dust, cf. Rotundi et al. (2015), Moreno et al. (2016), and Merouane et al. (2016).
References
Balsiger, H., Altwegg, K., Bochsler, P. et al. 2007, Space Sci. Rev., 128, 745
Colangeli, L., Lopez Moreno, J. J., Palumbo, P., et al. 2007, Advances in Space Research, 39, 446
Hansen, K. C., Altwegg, K., Berthelier, J. J., et al. 2016, MNRAS, 462, S491
Kissel, J., Altwegg, K., Clark, B. C., et al. 2007, Space Sci. Rev., 128, 823
Merouane, S., Zaprudin, B., Stenzel, O., et al. 2016, A&A, 596, A87
Moreno, F., Snodgrass, C., Hainaut, O., et al. 2016, A&A, 587, A155
Pestoni, B., Altwegg, K., Balsiger, H., et al. 2021, A&A, 645, A38
Pestoni, B., Altwegg, K., Balsiger, H., et al. 2021, accepted for publication on A&A
Riedler, W., Torkar, K., Jeszenszky, H., et al. 2007, Space Sci. Rev., 128, 869
Rotundi, A., Sierks, H., Della Corte, V., et al. 2015, Science, 347, aaa3905
Schulz, R., Hilchenbach, M., Langevin, Y., et al. 2015, Nature, 518, 216
Snodgrass, C., Opitom, C., de Val-Borro, M., et al. 2016, MNRAS, 462, S138
How to cite: Pestoni, B., Altwegg, K., Hänni, N., Rubin, M., and Wampfler, S.: Analysis of the sublimating volatiles in 67P/Churyumov-Gerasimenko coma particles starting from the ROSINA-COPS nude gauge data, Europlanet Science Congress 2021, online, 13–24 Sep 2021, EPSC2021-513, https://doi.org/10.5194/epsc2021-513, 2021.
The ejection of cometary material is driven by the sublimation of volatiles, and depends on heliocentric distance, local illumination conditions, and material properties. A short period comet like 67P loses 0.1% of its mass per orbit [1], which would amount to 50 cm thick layer of material, if the loss was uniformly spread across the surface. ESA’s Rosetta mission followed comet 67P for more than 2 years, monitoring the surface and its evolution through different seasons and heliocentric distances (4-1.2 AU). One of Rosetta's major discoveries was that a significant amount of material is being displaced rather than expelled [2]. Dust is transported from one region to another, or re-organized in place, leading to a local dust cover which appears to expand and contract with seasons. Sporadic events, sometimes linked to outbursts, create more drastic transformations of the surface: e.g. cliff collapses, sudden formation of deep pits, or rapid expansion of surface depressions.
The large scale changes have been described by many authors [3-9], as the link between morphology and activity [10,11]. However, an exhaustive catalog of changes at all scales remain to be published. This is a challenging task, because most changes are small (meter-size or less), which means the associated surface features occupy only a few pixels in the high-resolution images (OSIRIS NAC [12]).
Yet, identifying all surface changes remains necessary if we want to understand how cometary activity and surface evolution are interlinked. An exhaustive catalog of changes would allow for precise calculations of the thermal energy distribution and presence of volatile material in the subsurface, for instance by tracking the displacement of a many small boulders in a given area.
In this work, we present a simple, but efficient approach to accurately identify areas that have changed over time. This an improved version of the study presented in [13]:
- Images of the same area acquired at different epochs are projected onto the tri-dimensional shape model of the comet. We use the software shapeViewer [14]: a mission/instrument simulator. An inverse ray-tracing algorithm maps each facet of the shape model in the current field of view to the CCD pixels, and uses this information to texture the shape with the relevant data. Each image thus projected can be viewed from any other angle, including the viewing geometry of the other image in the pair currently investigated. This effectively co-registers the data, within the uncertainties of the shape model and attitude/orbit information.
- We calculate the density of information in matching sub-areas of the before/after image pair, with information being the measure of entropy in pixel values, as introduced in [15]. We also propose an alternative method which relates information to the 2D-Laplacian operator at every pixel. In either case, information does not depend on the absolute value of each pixel, but on how the signal varies from one pixel to the next. This makes our method robust against changes in global illumination between images.
- After the second step, we know how the spatial distribution of information density has changed between the two epochs, at different resolutions. This allow us to quantify not only the extent of local area that has been modified, but also whether this was a positive or negative change, An increase in information density typically indicates the presence of new morphological features. Conversely, a loss of information indicates that surface features have been removed, often the signature of dust deposition.
Our change detection method can be completed by other image processing techniques. For instance if we identify areas prone to boulder movement, one can use advanced feature recognition to track the distribution of those objects automatically. We applied an automated block fall detection method that was developed for estimating the erosion rate of the north polar steep scarps on Mars [16, 17]. This method combines blob detection and machine learning to detect and delineate newly appeared small boulders against complex backgrounds with a high confidence level. A Support Vector Machine, which is trained on Histograms of Oriented Gradients (HOG) of thousands of boulder and non-boulder image samples, identifies the location of new boulders. The blob detection part of the method verifies the existence of the boulders by looking for convex objects that are accompanied by a shadow and delineates their boundaries.
We are now in the process of finalizing the detection of changes on 67P, using at least one image pair per region. While this a major step forward, it is not sufficient. To cover the entire comet and produce an exhaustive list of morphological changes we will be launching a citizen science project, Rosetta Zoo, on the Zooniverse platform. Having volunteers peruse OSIRIS images will allow us to differentiate physical changes in the surface of the comet from spurious detections over the entire dataset. This citizen science project will involve thousands of members of the public in the analysis of images from this cornerstone ESA mission.
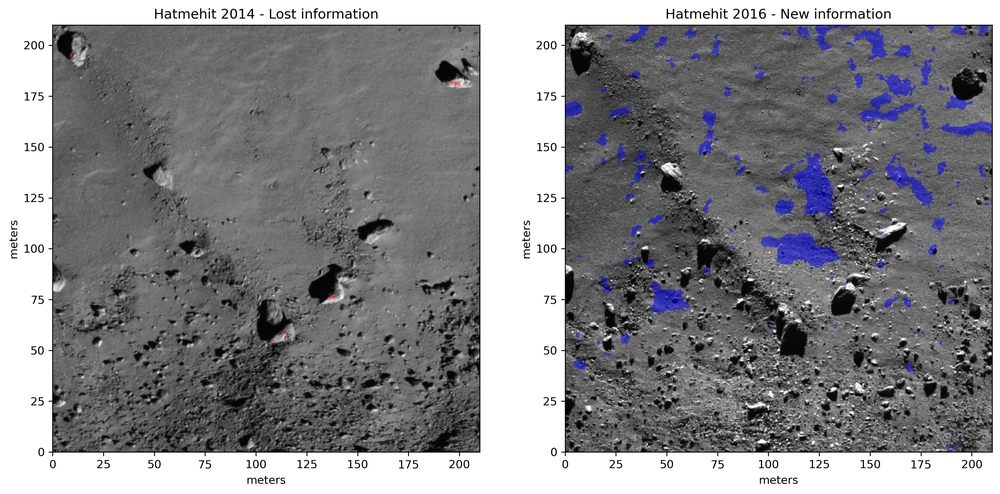
Changes detected in 67P's Hatmehit region between 2014 (left) and 2016 (right). Our algorithm detects that 6.5% of the area in the second image contains new morphological features (in blue), mostly boulders being exposed after the dust cover has been removed by cometary activity. Data: OSIRIS NAC, images N20140914T165658730ID20F41 & N20160430T090037998ID20F41
References:[1] Pätzold et al, Nature (2016); [2] Thomas et al, A&A (2015); [3] Groussin et al, A&A (2015); [4] El Maarry et al, Science (2017); [5] Vincent et al, MNRAS (2017); [6] Birch et al, MNRAS (2017); [7] Pajola et al, NatAstro (2017); [8] Birch et al, GRL (2019); [9] Vincent et al, EPSC (2019); [10] El Maarry et al, ISSI/SSR (2020); [11] Vincent et al, ISSI/SSR (2020); [12] Keller et al, SSR (2007); [13] Vincent et al, EPSC (2019); [14] Vincent et al, LPSC (2018); [15] Shannon et al, Bell System Technical Journal (1948); [16] Fanara et al., PSS (2020); [17] Fanara et al., Icarus (2020)
How to cite: Vincent, J.-B., Kruk, S., Fanara, L., Birch, S., and Jindal, A.: Automated detection of surface changes on comet 67P, Europlanet Science Congress 2021, online, 13–24 Sep 2021, EPSC2021-525, https://doi.org/10.5194/epsc2021-525, 2021.
Comets are the primitive building blocks of the Solar System. In order to understand the extent of the pristine nature of comets, we must understand the mechanisms that affect their surfaces and comae – their activity.
Activity can be tracked in a variety of ways, such as observing dust production in the coma and tail. We can study the activity in a quantitative way through photometry of the reflected sunlight, as flux is proportional to the reflecting area of the dust lifted off the comet by its activity. Activity varies from comet to comet so we must try to distinguish whether these differences in activity are because of ageing or reflect primordial differences. Ageing refers to effects that have chemically or physically altered the nucleus since its formation and may cause a change in the activity. The most obvious of which is the production of comae and tails, caused by escaping gas and dust lifted off the surface of the comet. Other signs of activity include outbursts, where material is suddenly ejected into the coma, causing an immediate and rapid brightening in telescopic observation.
All processes that physically and chemically alter a cometary nucleus can be regarded as ageing. The ageing processes are too slow and irregular to become detectable during a single observation. When comets are observed over a number of Solar System returns some changes can be detected (Meech & Svoren, 2004). As such, that evolution of comets is best studied on a statistical basis.
Distinguishing the effects of ageing from primordial differences is important since the wide range of formation scenarios should imply significantly different observational qualities. Once the differences are established, it will allow us to use the comets as time capsules of the chemical and physical conditions in the early Solar System.
67P/Churyumov-Gerasimenko is a Jupiter family comet that was the target of the Rosetta mission, the first mission to successfully orbit and land a probe on a comet, and this mission was accompanied by a large ground-based observing campaign (Snodgrass et al., 2017). Some of the data from this campaign have been previously calibrated approximately but we present a more accurate calibration using background stars.
We are developing a pipeline to calibrate and measure photometry of comet 67P during its 2016 perihelion passage, making use of all visible wavelength imaging collected at a wide range of facilities. The pipeline calibrates the brightness to a common (PanSTARRS1) photometric system using background stars in the field via the calviacat program.
The pipeline has been successfully applied to two data sets of 67P so far: images taken with the FORS2 instrument on the 8m Very Large Telescope (VLT) and with IO:I on the 2m Liverpool Telescope (LT). Both light curves are presented and overlaid in Fig 1. Preliminary results follow predictions based on observations in previous orbits (Snodgrass et al., 2013) and show no obvious deviations, indicating that 67P is a ‘well behaved’ comet and that it doesn’t show significant changes due to ageing from orbit-to-orbit. Further data sets and more detailed analysis will be presented in this talk.
The calibrated data will act as a companion to the Rosetta mission. We will search for small-scale variation in activity that can be related to outbursts measured in situ by the spacecraft (Vincent et al., 2016) to place constraints on these outbursts and their detectability from Earth-based observations. This will help us constrain how well global activity measures relate to local changes on the comet nucleus. The lessons learned from Rosetta can then be applied to the wider comet population, many of which will never be visited directly and only ever observed from the ground.
Figure 1: Preliminary light curves of 67P photometry taken from VLT and LT telescopes. Light curves are in good agreement with each other and predictions.
References
Meech, K. J. and Svoren, J. 2004, In Comets II, pages 317-335. Univ. of Arizona, Tuscon
Snodgrass, C. et al. 2013, A&A, 557:A33
Snodgrass, C. et al. 2017, Phil. Trans. R. Soc. A, 375(2097):2016024
Vincent, J.-B. et al. 2016, MNRAS, 462(Suppl_1):S184-S194
How to cite: Gardener, D. and Snodgrass, C.: Searching for Outbursts in Ground-Based Photometry of 67P/Churyumov-Gerasimenko, Europlanet Science Congress 2021, online, 13–24 Sep 2021, EPSC2021-536, https://doi.org/10.5194/epsc2021-536, 2021.
Introduction
It is widely accepted that the dynamical mechanism that governed the planet formation process, giving place to an early or late instability, would imprint some feature on the trans-Neptunian populations. They did not only undergo dynamical evolution but were affected by collisional evolution, which was responsible for shaping the size-frequency distribution (SFD) of the TNO population at small sizes. Dynamical effects (as population depletion) are not size-dependent and just uniformly deplete populations. Inspired by the state of the art of recent dynamical models [1,2,3], we update our former model to ALICANDEP-21 to consider an early excitation scenario in which Neptune begins its migration between 10 to 100 My of the start of Solar System evolution. We apply our model to the problem of the origin of comet 67P/Churyumov-Gerasimenko, visited by the Rosetta (ESA) spacecraft in the past decade and of the TNO 486958 Arrokoth, flown-by in early 2019 by the New Horizons (NASA) spacecraft. A debate rose about their primordial or evolutionary genesis [4, 5] to which we contribute with this research. We study the collisional and dynamical evolution of the trans-Neptunian populations using numerical simulations based on the package ALICANDEP-21. This model includes the statistical elimination of bodies from a migrating disk imitating dynamical effects present in the Nice model.
Methodology
The model evolves in time -under the mentioned boundary conditions- the collisional interaction and dynamical depletion of objects in discrete logarithmic size bins, whose central value generally span in the range of 35 cm to 3000 km in diameter so that any two adjacent bins central values scale a factor 2 in mass. Evolution takes place starting from populations abundance of objects with initial size distributions such that the overall results of the evolution accomplish with current observables in the TNO populations.
We improved our model to study in detail the evolution of populations corresponding to objects of particular interest, as in the case of comet 67P/C-G and TNO 486958 and Arrokoth.
We consider different kind of bodies depending on collisional outcome. We define as primordial body an object that remains forever — unshattered— in the zone where it began its evolution and only suffered cratering collisions. After each collision, a body is classified as gravitational aggregate (GA) if the mass of the largest fragment produced in the fragmentation is less than half the mass of the whole re-accumulated object after the collision [6]. Instead, we consider it as a fragment, a body that is not a GA (nor primordial). It is worth mentioning that this includes all products of shattering or cratering collisions.
In many cases, the result of shattering is a re-accumulated aggregate for which the largest component mass is larger than half the whole body's mass and therefore does not accomplish the definition of GA. The volume fraction of the largest component of comet 67P/C-G as of today is about 73% of the overall comet volume. In the case of Arrokoth, it is about 65%. According to our definition, 67P/C-G and Arrokoth are classified as "fragments" as they do not accomplish our GA definition.
In order to follow the evolution of the potential populations related to such bodies, we set their size range and keep track of the primordial, re-accumulated (gravitational aggregate, GA) and fragments history. We consider 67P/C-G and Arrokoth belonging to the inner belt and the main classical belt, respectively. The corresponding size ranges are 2.4 to 5 km for 67P/C-G and the equivalent diameter corresponding to a size range from 15 to 23 km for Arrokoth [5]. At the beginning of simulations, both bodies belong to the "primordial" category.
Results
No initial mass assumption for evolution or size distribution is compatible with primordial bodies survival beyond 100 My of evolution.
Instead, all bodies of equivalent size to 67P/C-G were created as fragments during the short period of collisional evolution. The fraction of re-accumulated bodies remains practically negligible in any scenario. If we look at the situation at 70 My (the start of the dynamical instability), only in the case of shallow initial population distributions of small bodies the primordial fraction is non-zero but is, however, smaller than 5%. In an early dynamical instability scenario, a massive disk grinds almost all bodies down in the size range of 67P/C-G sooner than ∼40My. In contrasts, a low mass disk tends to delay such evolution state doubling the time needed to grind almost ∼ 100% of bodies in such size range in the inner belt.
On the other hand, a late dynamical instability scenario delays the complete grinding of bodies in size range of 67P/C-G until about 100 My in the most conservative case (A1). Primordial bodies in the size range of Arrokoth can generally survive longer than the ones in 67P/C-G size range. However, the corresponding fraction strongly depends on initial mass and distribution. Our model finds that up to 55% of primordial bodies may survive in the case of an early dynamical excitation scenario with low initial mass provided the initial belt had not an initial shallow distribution of bodies below 100 km. The fraction of primordial bodies is between 20 and 30% in a massive disk under specific scaling law. The rest of the initial configurations constrain the fraction of primordial bodies to 10% at most. In summary, our results indicate that it is plausible to conserve a significant fraction of primordial bodies larger than 10 km, even if only under specific boundary conditions. On the contrary, primordial smaller bodies are quickly converted into fragments in the first tens of My.
References: [1] Nesvorný D., 2015a, AJ, 150, 68, [2] Nesvorný D., 2015b, AJ, 150, 73. [3] Nesvorný D., 2018, ARA&A, 56, 137, [4] Morbidelli A., Rickman H., 2015, A&A, 583, A43, [5] Spencer J. R., Stern S. A., Moore J. M., Weaver H. A., Singer K. N., Olkin C. B., Verbiscer A. J., et al., 2020, Science 367, aay3999. [6] Campo Bagatin et al. (2001) Icarus, 149-1, 198. [3]
How to cite: Benavidez, P., Campo Bagatin, A., Curry, J., and Álvarez-Candal, A.: Could 67P/Churyumov-Gerasimenko and (486958) Arrokoth be primordial bodies evolved in an early giant planet instability environment?, Europlanet Science Congress 2021, online, 13–24 Sep 2021, EPSC2021-554, https://doi.org/10.5194/epsc2021-554, 2021.
Small and volatile molecules are the most abundant constituents of a comet’s neutral coma. Thanks to ESA’s Rosetta mission, the neutral coma of comet 67P/Churyumov-Gerasimenko (67P hereafter) has been analyzed in great spatial and temporal detail, e.g., by Rubin et al. (2019) or by Läuter et al. (2020). However, the Double Focusing Mass Spectrometer (DFMS) – part of the Rosetta Orbiter Spectrometer for Ion and Neutral Analysis (ROSINA; Balsiger et al. 2007) – delivered data which contains information about the transition region between volatiles and macromolecular matter. Manual fitting of individual spectra allows to resolve pure hydrocarbon from heteroatom-bearing species also in the higher mass-range of the instrument, up to mass-to-charge (m/z) ratios of 140.
While Altwegg et al. (2019) have reported tentative detections of some heavier species like benzoic acid or naphthalene, spectra of m/z>70 have not been investigated systematically. Here, we will present preliminary results from the first comprehensive analysis of a full data set (from m/z=12 to m/z=140) collected on August 3, 2015. On this day, the comet was close to its perihelion and the dust activity, as seen by the OSIRIS camera (Vincent et al. 2016), was high. Probably due to sublimation of molecules from ejected and heated-up dust grains, ROSINA/DFMS registered many signals above m/z=70. Due to the problem of isomerism and the lack of reference data, we chose to follow a statistical approach for our analysis. Larger species tend to expose a lower degree of saturation and the H/C ratio seems to approach that of highly unsaturated insoluble organic matter (IOM), cf., e.g., Sandford 2008. Although we cannot identify individual molecules in the complex gas mixture that makes up for the cometary coma, we are able to characterize for the first time the larger organic species that bridge the small volatiles and the macromolecular matter observed in 67P’s dust by the Rosetta secondary ion mass spectrometer COSIMA (Fray et al. 2016).
Altwegg et al., 2019, Annu. Rev. Astron. Astrophys., 57, 113-55.
Balsiger H. et al., 2007, Space Sci. Rev., 128, 745-801.
Fray et al., 2016, Nature, 538, 72-74.
Läuter et al., 2020, MNRAS, 498, 3, 3995-4004.
Rubin et al., 2019, MNRAS, 489, 594-607.
Sandford, 2008, Annu. Rev. Anal. Chem. 1, 549–78.
Vincent et al., 2016, MNRAS, 462 (Suppl_1), 184-194.
How to cite: Hänni, N., Altwegg, K., Müller, D., Pestoni, B., Rubin, M., and Wampfler, S.: The cometary matter between volatiles and macromolecules, Europlanet Science Congress 2021, online, 13–24 Sep 2021, EPSC2021-681, https://doi.org/10.5194/epsc2021-681, 2021.
Introduction: 30 September 2016 marked the end of the Rosetta mission as the spacecraft came to rest on the surface of comet 67P/Churyumov-Gerasimenko. Although this marked an end to the spacecraft’s active operations, intensive work has continued for several years, with the instrument teams updating their science data in response to recent scientific reviews and delivering them for ingestion into ESA’s Planetary Science Archive (PSA) [1].
This presentation will outline the final status of the Rosetta archive, as well as highlighting some of the enhancement activities that have been completed in 2020 and the work undertaken to finalise and close out the Rosetta archive.
Status of the Rosetta data in the Planetary Science Archive: All science data from the Rosetta mission are hosted jointly by the Planetary Science Archive (PSA) at ESA (http://psa.esa.int) [1], and by NASA’s PDS Small Bodies Node (SBN).
Rosetta was an extremely complex and challenging mission to archive [2]. To help manage some of these complexities a total of nine independent data reviews have taken place over the course of the mission. Five of these have taken place after the closure of the nominal mission. In addition, a number of small individual reviews have been held to assess the final deliveries from some of the teams using their latest pipelines. In combination, these reviews have assessed the complete data holdings from Rosetta, and closely reviewed the updated outputs from the enhanced archiving activities, discussed in the following section. This series of reviews has ensured that the archive is now ready for the long-term.
Rosetta Enhanced Archiving Activities: Once the resources from the operational mission came to an end, ESA established a number of joint activities with the Rosetta instrument teams to allow them to continue to work on enhancing their archive content. The updates planned were focused on key aspects of an instrument’s calibration or the production of higher level data / information, and are therefore very specific to each instrument’s needs.
This presentation will highlight just a few of the activities within the archive enhancement to give a flavour of the updates that have already been completed and those that are expected to be delivered in the coming months.
Almost all instrument teams have now provided a Science User Guide for their data. Most teams also updated calibrations for their data, and some produced higher level processed data and derived products.
For example, the OSIRIS team delivered data with improved calibrations, as well as straylight corrected, I/F corrected, and three-dimensional georeferenced products. These are all already available in the archive. OSIRIS also delivered their data additionally in FITS format, and provided quicklook versions of their products to allow an end-user to more easily sift through the data and select the images they may be interested in. Internal straylight data and boresight corrected / full frame data were delivered in mid 2020, and have also now been added to the Rosetta archive. Outside of the officially supported activities, the OSIRIS team aim to make a final delivery of all of their data using the final and best pipeline available in summer 2021. The aim is to have this large volume of data available in the final archive by end of 2021.
Similarly, the VIRTIS team are working to update both their spectral and geometrical calibrations, and will deliver mapping products to the final archive. This work has also been extended into early 2021, with the aim to close out the final versions by summer.
The Rosetta Plasma Consortium (RPC) instrument suite completed several cross-calibrations that greatly improved the final data from each experiment, as well as a number of activities individual to each instrument (e.g. removal or flagging of spacecraft noise from the MAG instrument). An illumination map of the comet has also been produced by the RPC team to help with their cross-calibration work.
The MIDAS team has similarly completed cross-calibrations and produced a dust particle catalog from the comet coma.
The GIADA team has produced and delivered higher level products in the form of dust environment maps, with omnidirectional plus time products.
The ALICE, RPC-IES and MIRO instruments on Rosetta are funded by NASA, and limited enhanced archiving activites were also undertaken for these. Data are from these activities are all already released, but a few final small updates to a few products are expected early this year.
The COSIMA team has delivered a ground-based catalog of spectra for comparison to help calibrate and understand their in-flight data. These are expected to be released in 2021.
A separate activity has also been established to produce and deliver data set(s) containing supporting ground-based observations of the comet. These data were taken simultaneously with Rosetta operations and could provide some important contextual information that will be of considerable value to the end user community. Final versions of these products were delivered in mid-2020. There is still some work needed to have these ready for a full ingestion, but the aim is to have these available in the archive this year.
The Rosetta ESA archiving team has also now released calibrated data sets for the NAVCAM instrument, archived all of Rosetta’s radiation monitor data, and will be working with colleagues at PDS to include the latest shape models from the comet into the final Rosetta archive later this year.
Final PSA Updates: In 2020, the Rosetta ESA archiving team also worked on providing a centralized solution to the problem of geometry on the comet for implementation within the final Rosetta data holdings. The latest version of the PSA includes a number of features to help exploit the Rosetta data with this in mind, including a 3D orbital view and a consistent set of queriable geometry data. These will be outlined in the presentation.
References: [1] Besse, S. et al., (2018) Planetary and Space Science v150, 131-140; [2] Barthelemy, M. et al., (2018) Planetary and Space Science v150, 91-103.
How to cite: Heather, D. and Taylor, M.: The Rosetta Science Archive: Preparing for Legacy Science, Europlanet Science Congress 2021, online, 13–24 Sep 2021, EPSC2021-310, https://doi.org/10.5194/epsc2021-310, 2021.
Metals have been found in cometary dust by in-situ experiments onboard the Giotto and Rosetta spacecrafts[4,10] as well as in dust particles collected by the Stardust spacecraft[11]. They appear in silicate, sulfide and metal grains. Two sungrazing comets, the Great Comet of 1882[2] and C/1965 S1 (Ikeya-Seki)[9], approached the Sun so close that dust grains have vaporized, revealing lines of several metals in the coma spectrum, in particular FeI and NiI. However, it came as a surprise to find numerous FeI and NiI emission lines in high-resolution spectra of comets observed at large heliocentric distances[7], where the equilibrium temperature T~280r-1∕2K is far too low to allow sublimation of silicates (Tsub≥1200K) and sulfides (Tsub≥600K). In the present contribution, we summarize this discovery and the challenges it raises.
Dozens of FeI and NiI emission lines were recently found in the spectral region 3000-4000Å for 17 comets at heliocentric distances between 0.68 and 3.25 au[7]. These comets were observed with the high-resolution spectrograph UVES mounted on the ESO VLT. FeI and NiI lines can also be detected in archival data obtained with other telescopes, as shown in Fig.1 for comet Hyakutake. The spatial extension of the lines is very short indicating that the FeI and NiI atoms originate from the inner coma, close to the nucleus. To compute the FeI and NiI production rates we built a fluorescence model that accounts for the complex absorption structure of the solar spectrum (Swings effect). In Fig.2 we show that the FeI+NiI production rate is correlated with the production rate of major constituents of cometary ices, either H2O or CO.
The NiI/FeI abundance ratios are shown in Fig.3. They cluster around NiI/FeI~1 whatever the comet heliocentric distance. The NiI/FeI ratio does not depend on the comet type but there is evidence (indicated by a F-test) that its variance is higher in the Jupiter-family sample than in the Oort cloud sample. This is reminiscent of the wider range of C2/CN abundances observed in Jupiter-family comets[5].
The average abundance ratio is log(NiI/FeI)=-0.07 with a standard deviation of 0.29. This value differs from the ratio log(Ni/Fe)=-1.10±0.23 estimated in the dust of P/Halley[4] and log(NiI/FeI)=-1.11±0.09 in the coma of the sungrazing comet Ikeya-Seki[7]. The latter ratios are similar to the ratio measured in the Sun and the meteorites. Interestingly, the NiI/FeI ratio measured in the interstellar comet 2I/Borisov is in agreement with the ratio found in the solar system sample[8].
These observations raise two questions, still open. How can FeI and NiI atoms be released at such low temperatures? Why is the NiI/FeI abundance ratio one order of magnitude higher than the solar value? The release of FeI and NiI atoms from sulfides is appealing since their sublimation temperature is lower than silicates. Moreover FeNi alloys and sulfides formed in the low temperature range are Ni-rich, such as kamacite and pentlandite[6], so that their sublimation could explain the high NiI/FeI ratios we observed. Superheating is nevertheless required to reach T~600K, which might be possible if the grains are very small, like the metallic nanoparticles found in comet 81P/Wild2[11]. Collisions of cometary dust with high-velocity particles could also produce impact vapor with T~1000K[3]. Alternatively, FeI-NiI atoms could be released from organometallic complexes, yet undetected in the cometary material, such as carbonyls that have much lower sublimation temperatures. In particular Fe(CO)5 and Ni(CO)4 are expected to sublimate at Tsub~100K, intermediate between the sublimation temperature of H2O and CO2[7]. The higher sublimation rate of Ni(CO)4 with respect to Fe(CO)5 would naturally explain the overabundance of nickel.
More work is clearly needed to test these hypotheses, both observationnaly and theoretically. The discovery of FeI and NiI atoms in distant comets neverthless indicates that constituents of the nucleus or processes in the coma are still missing.
References
[1]A’Hearn, M.F., Wellnitz, D.D., Meier, R.: urn:nasa:pds:gbo-kpno:hyakutake_spectra::1.0, NASA Planetary Data System (2015)
[2]Copeland, R., Lohse, J.G.: Copernic.Int.J.Astron. 2, 225 (1882)
[3]Ip, W.H., Jorda, L.: ApJL 496, L47 (1998)
[4]Jessberger, E.K., Christoforidis, A., Kissel, J.: Nature 332, 691 (1988)
[5]Levison, H.F.: ASPC 107, 173 (1996)
[6]Lewis, J.S.: Physics and chemistry of the solar system, 2dEd., Elsevier (2004)
[7]Manfroid, J., Hutsemékers, D., Jehin, E.: Nature 593, 372 (2021)
[8]Opitom, C., Jehin, E., Hutsemékers, D., et al.: A&A, submitted (2021)
[9]Preston, G.W.: ApJ 147, 718 (1967)
[10]Stenzel, O., Hilchenbach, M., Merouane, S., et al.: MNRAS 469, S492 (2017)
[11]Zolensky, M.E., Zega, T.J., Yano, H. et al.: Science 314, 1735 (2006)
How to cite: Hutsemékers, D., Manfroid, J., and Jehin, E.: FeI and NiI in comets, Europlanet Science Congress 2021, online, 13–24 Sep 2021, EPSC2021-89, https://doi.org/10.5194/epsc2021-89, 2021.
Introduction
Comets are often referred to as the most pristine objects in our Solar System. Formed during the early stages of our planetary system and preserved in its coldest outskirts, comets are considered to be extremely well preserved remnants of the Solar Nebula [1]. However in the Kuiper Belt, comet nuclei may be heated at temperatures up to 30-50 K [2]. In addition, from the moment of their first ejection from their reservoirs, to the moment of their detection and observation, an important period of time remains unaccounted for, from a thermal evolution modeling point of view. In fact, constraining the journey of a comet nucleus towards the inner parts of the Solar System is not a straight forward procedure, since it is chaotic due to close encounters with giant planets [3]. We seek to investigate this intermediate stage in the dynamical evolution of comets and its potential effects on their thermal evolution, as we believe that significant thermal alterations can take place, as evidenced by the existence of active Centaurs [4].
Methods
We aim to get a first-order assessment of the extent of thermal processing of comet nuclei during their dynamical evolution from the Kuiper Belt to the inner Solar System. We apply a 1D thermal evolution model in order to resolve the heat diffusion equation and obtain the temperature profiles in a comet nucleus [5]. To simplify the problem, which is complex due to the very different timescales involved for the various processes, we neglect in this preliminary work any ice phase transition (sublimation or crystallization). Thermo-physical parameters are otherwise standard [6]. A special consideration has been taken for the thermal conductivity, the most critical parameter in this study, with three values of the Hertz factor (h) used to account for the geometry of contact between grains. This simplified model is applied to a sample of 276 dynamical clones, all representative of active JFCs, with perihelion distances within 2.5 au [3].
Results
For each clone, we observe several, long-lasting passages close enough to the Sun for the nucleus to be significantly altered. Those are spread throughout the clone's dynamical evolution, resulting in the heating of a significant subsurface layer. We note that the radial extent of this layer is strongly related to the thermal conductivity of the porous medium, which in its turn depends on the selected geometrical scenario. A statistical analysis, performed for all values of the thermal conductivity considered, shows that the sublimation temperatures of the main volatile components of comets (CO, CO2, H2O) can be reached, sometimes down to the innermost parts of the nucleus. In this context, most clones might lose an important fraction (yet to be determined) of their volatile content.
Perspectives
This preliminary work suggests that a comet's orbital past may result in a significant thermal processing of the nucleus. Further work will be performed to fully constrain the extent of such processing.
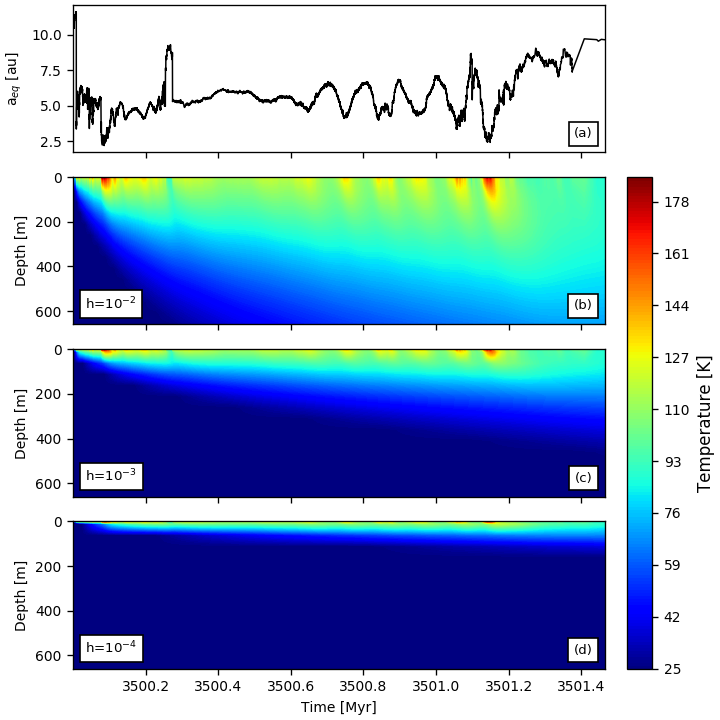
Acknowledgments
This study is part of a project that has received funding from the European Research Council (ERC) under the European Union’s Horizon 2020 research and innovation programme (Grant agreement No. 802699). We gratefully acknowledge support from the PSMN (Pôle Scientifique de Modélisation Numérique) of the ENS de Lyon for the computing resources.
References
[1] Filacchione et al. (2019) SSRv, 215, 46
[2] Prialnik et al. (2004) in Comets II, Festou, Keller, Weaver (Eds.), 359
[3] Nesvorny et al. (2017) ApJ, 845, 25
[4] Jewitt (2009) AJ, 137, 4296
[5] Guilbert-Lepoutre et al. (2011) A&A, 529, 71
[6] Huebner et al. (2006) Heat and Gas Diffusion in Comet Nuclei (Published for The ISSI)
How to cite: Gkotsinas, A., Guilbert-Lepoutre, A., Raymond, S., and Nesvorny, D.: Preliminary study of the coupled long-term thermal and dynamical evolution of JFCs, Europlanet Science Congress 2021, online, 13–24 Sep 2021, EPSC2021-228, https://doi.org/10.5194/epsc2021-228, 2021.
Anisotropic outgassing from comets exerts a torque sufficient to rapidly change the angular momentum of the nucleus, potentially leading to rotational instability. Here, we use empirical measures of spin changes in a sample of comets to characterize the torques and to compare them with expectations from a simple model. Both the data and the model show that the characteristic spin-up timescale, τ, is a strong function of nucleus radius, r. Empirically, we find that the timescale varies as τ ~ 100 r2, where r is expressed in kilometers and τ is in years. The fraction of the nucleus surface that is active varies as fA ~ 0.1/r2, giving fA = 1 at r = 0.3 km. We find that the dimensionless moment arm of the torque is widely scattered, with a median value $k_T$ = 0.004 (i.e. about 0.4% of the escaping momentum torques the nucleus), and weak (<3σ) evidence for a size dependence, kT ~ 0.001 r2. Sub-kilometer nuclei have spin-up timescales comparable to or less than their orbital periods, confirming that outgassing torques are quickly capable of driving small nuclei towards rotational disruption. Torque-induced rotational instability likely contributes to the paucity of sub-kilometer short-period cometary nuclei, and can account for the pre-perihelion destruction of sungrazing comets. Outgassing torques on small active asteroids can rival YORP torques, even for unobservably small (<1 g/s) mass loss rates. Finally, we discuss the important roles played by detection, spectroscopic and survival biases in the measured distributions of τ, fA and kT.
A full description is published at Jewitt, D. Astronomical Journal, 161:262 (12pp) (2021).
Figure 1: Published determinations of nucleus radius vs. spin-up timescale for short-period comets, most with perihelia in the 1 to 2 AU range. A strong size dependence is evident. The solid line indicates a power law with index 2. From Jewitt (2021).
How to cite: Jewitt, D.: Systematics and Consequences of Comet Nucleus Outgassing Torques, Europlanet Science Congress 2021, online, 13–24 Sep 2021, EPSC2021-312, https://doi.org/10.5194/epsc2021-312, 2021.
We discuss the development of activity in the extraordinary, distant long-period comet C/2017 K2 over the heliocentric distance range 9 < rH < 16 AU. C/2017 K2 is an incoming long-period comet with a period so long (~ 3 Myr) that no heat from the previous perihelion can be retained; we can be sure that the observed mass-loss is driven by the current insolation and not by a thermal lag. The comet is characterized by a steady-state coma of sub-millimeter and larger particles ejected at low (4 m/s) velocity, filling a roughly spheroidal coma with a characteristic scale of 80,000 km. In a fixed, co-moving volume around the nucleus we find that the scattering cross-section of the coma, C, is related to the heliocentric distance by a power law, C ~ rH-s, with heliocentric index s = 1.14+/-0.05. This dependence is significantly weaker than the rH-2, variation of the insolation as a result of two effects. These are, first, the heliocentric dependence of the dust velocity and, second, a lag effect due to very slow-moving particles ejected long before the observations were taken. A Monte Carlo model of the photometry shows that dust production beginning at rH ~ 35 AU is needed to match the measured heliocentric index, with only a slight dependence on the particle size distribution. Dust mass loss rates at 10 AU are of order dM/dt ~ 103 a1 kg/s, where 0.1 < a1 < 1 is the effective particle radius expressed in millimeters.
The expulsion of submillimeter and larger grains, beginning at Kuiper belt distances, is likely the result of the sublimation of near-surface supervolatile ice (probably CO, as suggested by the recent detection of this molecule at 6.7 AU; Yang et al. Ap. J. Letters, in press). Water ice is involatile over the observed distance range and even the energy and gas release triggered by the crystallization of amorphous ice, if present, cannot produce activity at 35 AU. Comet C/2017 K2 will reach perihelion near Mars' orbit in December 2022.
This work is described in D. Jewitt, Y. Kim. M. Mutchler, J. Agarwal, J. Li and H. Weaver (2021). Astronomical Journal, 161:188 (11pp)
How to cite: Jewitt, D., Kim, Y., Mutchler, M., Agarwal, J., Li, J., and Weaver, H.: Cometary Activity Begins at Kuiper Belt Distances: Evidence from C/2017 K2, Europlanet Science Congress 2021, online, 13–24 Sep 2021, EPSC2021-327, https://doi.org/10.5194/epsc2021-327, 2021.
A dust tail ‘gap’ was discovered in amateur images of the dust tail of C/2014 Q1 (PanSTARRS), which appeared around the comet’s most recent perihelion on 6th July 2015. This gap presented itself as a wedge-shaped region devoid of dust, with the comet’s dust tail appearing to be normal on either side of this dark zone.
The results of the C/2014 Q1 study, employing Finson-Probstein modelling of the dust tail, show that none of the dust lay along the comet’s orbital path, confirming that both sections of dust were part of the dust tail and not a typical separation between dust tail and dust trail. A gap, devoid of dust, separates these two sections. The edges of this gap are bounded fairly accurately by lines of constant dust ejection time, corresponding to dust that should have been ejected between 6th July and 12th July. This suggests that cometary activity between these two dates was drastically reduced, although the cause of this is still unknown. The gap was visible throughout July and August 2015, and its shape and structure remained constant in the context of expected dust tail behaviour.
The limited dataset for C/2014 Q1 meant that the formation mechanism of this gap could not be fully investigated. However, a subsequent survey of amateur and professional comet images revealed the presence of similar gaps in the dust tails of several other comets. Analysis of these comets show many similarities with the results of the C/2014 Q1 study, including that these dust gaps observed all form during the comets’ perihelia. We present the results of individual analyses and cross-comparison of these comets, and summarize what we believe are the most likely scenarios for the formation of these perplexing features.
How to cite: Afghan, Q., Jones, G. H., and Price, O.: The dust tail gap of C/2014 Q1 (PanSTARRS), Europlanet Science Congress 2021, online, 13–24 Sep 2021, EPSC2021-481, https://doi.org/10.5194/epsc2021-481, 2021.
Introduction: NASA’s Stardust mission was the first mission to bring back to Earth material from a celestial body, i.e. the Jupiter Family Comet (JFC) 81P/Wild 2 (hereafter Wild 2) [1]. Cometary dust was captured via impact into a silica aerogel collector that was deployed during a fly-by through the coma of Wild 2 at a relative speed of 6 km s-1. The collector was secured into a metal frame by aluminum 1100 foil (hereafter Al foil). A major result of the mission was the discovery that, contrary to expectations, Wild 2 was not predominantly composed of presolar grains and low temperature outer solar nebula material, but rather high temperature (>>1000 °C) material typical of primitive meteorites [e.g., 2]. This suggests that the rocky part of Wild 2 is mostly made of high-temperature components that formed in the inner solar system before being transported outward to the comet-forming region. Most of the surviving supra-µm particles studied exhibit high-temperature chondritic material, including Calcium-Aluminum Inclusions (CAIs) and chondrule fragments [e.g., 3]. However, the number of chondrule fragments extracted from aerogel and analyzed so far is limited, preventing a clear comparision to the whole population of chondrules in Wild 2.
An alternative to the study of particles from the aerogel is the study of microscopic crater resulting from the impact of Wild 2 dust on Al foil. Experiments using a Light Gas Gun (LGG) at the University of Kent, U.K., to simulate Stardust craters by impacting silicates minerals on Al foil at normal incident and 6.1 km s-1 velocity, have shown that the shape of craters depends mainly on the physical properties of the impactor (i.e. solid grain vs. loose aggregates) [4]. Studies of residues in craters on Stardust foil show that these can give information on the bulk chemistry of the original particle, which is a critical parameter to identify the impacting material [5]. For instance, ferromagnesian compositions typical of chondrules can be recognized with confidence with EDX surveys. Occasional presence of relict crystals have been interpreted as unmelted crystalline material rather than recrystallization products after total melting of the impactor [6]. Experimental works simulating the impact of a wide range of mineral samples at Stardust capture speed have shown that residues of anhydrous minerals can be confidently identified using conventional analytical techniques [7-9]. However, experimental works using poly-mineral samples are lacking. Being able to efficiently identify such craters and characterize the pre-impact chondrule mineralogy and chemistry may allow for future statistical studies and, as a result, to draw a comprehensive picture of the chondrule population in Wild 2.
Here we will present preliminary data of a study of craters and residues resulting from the impact of fragments of different types of chondrules on Stardust analogue foils. We aim to determine whether the different chondrules produce craters and residues that may be distinguished from one another by chemical or morphological differences.
Method: Impact experiments were carried out at the LGG facility at the University of Kent, U.K. Chondrules several hundreds of micrometres in size were extracted from the chondrites Allende (CV3), Karoonda (CK3), Chainpur (LL3) and NWA 801 (CR2). One chondrule of each meteorite was randomly selected and used for the experiments. After extraction, chondrules were fragmented in roughly two equal parts. One part was embedded in epoxy resin and characterized by SEM-EDX, determining their main textural, mineralogical and chemical properties. The other part was used in impact experiments, being crushed for further fragmentation to produce particles tens of micrometers to sub micrometer sizes, to simulate the grain-size of Wild 2 particles. Impact experiments were carried out at approximately 6 km s-1. Al foil analogue targets were 4 x 4 cm in size. Resulting craters were investigated using a Hitachi S-4700 field-emission scanning electron microscope coupled with a Bruker XFlash annular EDX detector, allowing for precise chemical maps of residues lining the craters.
Results: Impact experiments resulted in thousands of microscopic impact craters on each target. Crater size ranges from submicrometer to several tens of micrometers in diameter. The vast majority of craters are bowl-shaped and exhibit residues that contain apparent fragments of the impactor. About 50 craters ⁓1 µm to ⁓30 µm were selected in each sample for chemical mapping. Obvious EDS peaks for Si and Mg are observed in most of the residues observed, along with detectable amount of Fe. Two occurrences of S-rich residues were observed in craters from Karoonda and Allende, whereas two occurrences of Ca-rich residues are observed for Chainpur and NWA 801.
Discussion and conclusion: Preliminary observations show that impacts are consistent with previous observations that chondrule material prominently produces bowl-shaped craters, further constraining craters of interest on Stardust foil. The chemistry of the residues is mostly akin to Fe-poor silicate-like (i.e. Si, Mg-rich, with detectable Fe), consistent with type I POP chondrules that are prominently common in carbonaceous chondrites. Moderately refractory elements Mg and Fe are depleted in most residues, whereas refractory Ca is increased, consistent with high temperatures during impact.
Future work include analysis and comparison against craters and residues produced by synthetic aggregates simulating IDP-like impactors.
Acknowledgments: This research is funded by STFC grant ST/S000348/1.
References: [1] Brownlee D. et al. (2006) Science, 314, 1711-1716. [2] Brownlee D. et al. (2012) Meteorit. Planet. Sci., 47, 453-470. [3] Bridges J. C. et al. (2012) Earth Planet. Sci. Lett., 341, 186-194. [4] Kearsley A. T. et al. (2009) Meteorit. Planet. Sci., 44, 1489-1509. [5] Kearsley A. T. et al. (2008) Meteorit. Planet. Sci., 43, 41-73. [6] Wozniakiewicz P. J. et al. (2012a) Meteorit. Planet. Sci., 47, 660-670. [7] Burchell M. J. et al. (2009) Planet. Space Sci., 57, 58-70. [8] Wozniakiewicz P. J. et al. (2012b) Meteorit. Planet. Sci., 47, 708-728. [9] Wozniakiewicz P. J. et al. (2009) Meteorit. Planet. Sci., 44, 1541-1559.
How to cite: Van Ginneken, M. and Wozniakiewicz, P.: Chondrule-like material in Wild 2: A new insight from impact experiments of chondrule fragments on Stardust analogue Al foil, Europlanet Science Congress 2021, online, 13–24 Sep 2021, EPSC2021-597, https://doi.org/10.5194/epsc2021-597, 2021.
We report an identification of long-period comet C/2010 U3 (Boattini) active at a new record inbound heliocentric distance of rH ≈ 26 au. Two outburst events around 2009 and 2017 were observed. The dust morphology of the coma and tail cannot be explained unless the Lorentz force, solar gravitation, and solar radiation pressure force are all taken into account. Optically dominant dust grains have radii of ~10 μm and are ejected protractedly at speeds ≤50 m s−1 near the subsolar point. The prolonged activity indicates that sublimation of supervolatiles (e.g., CO, CO2) is at play. Similar to other long-period comets, the colour of the cometary dust is redder than the solar colours. We also observed potential colour variations when the comet was at 10 < rH < 15 au, concurrent with the onset of crystallisation of amorphous water ice, if any. Using publicly available and our refined astrometric measurements, we estimated the precise trajectory of the comet, propagated it backward to its previous perihelion, and found that the comet visited the planetary region ~2 Myr ago at perihelion distance q ≈ 8 au. Thus, C/2010 U3 (Boattini) is almost certainly a dynamically old comet from the Oort cloud, and the observed activity cannot be caused by retained heat from the previous apparition. The detailed study is presented in Hui et al. (2019, AJ, 157, 162).
How to cite: Hui, M.-T., Farnocchia, D., and Micheli, M.: C/2010 U3 (Boattini): A Bizarre Comet Active at Record Heliocentric Distance, Europlanet Science Congress 2021, online, 13–24 Sep 2021, EPSC2021-638, https://doi.org/10.5194/epsc2021-638, 2021.
Introduction
Comets are small solar system bodies that formed in the outer solar system and are believed to preserve the primordial composition of the solar nebula [1]. Hence, the study of cometary cores provides information regarding the chemical composition of the protoplanetary cloud from which the solar system was formed. Organic materials are anticipated in comet with molecules that are observed in the interstellar medium [2]. Polycyclic aromatic hydrocarbons (PAHs), composed of fused benzene rings that are observed widely in the universe are observed in cometary materials at infrared wavelengths [3].
The UV spectroscopy of comets contains resonance lines of atoms, molecules, and ions to study the chemical composition of comets [5]. The near-UV spectral features of comet 1P/Halley observed at 362, 367.5, 373 and 382.5 nm observed using Vega-TKS spectrometer showed the presence of anthracene (C14H10) [6]. The PAHs acenaphthylene (C12H8) show broad emission at wavelength ~ 200 nm while pentacene (C22H14) display emissions at ~ 200 nm and 280 nm [7].
Observation and data analysis
The spectroscopic data of comet 46P observed at near UV (NUV) and far UV (FUV) wavelengths on 18th and 20th January 2019 respectively using the Space Telescope Imaging Spectrograph (STIS) onboard Hubble Space Telescope (HST) was used for the present study. The observed spectra were extracted using suitable routines in Python.
Results and discussion
The extracted spectra showed emissions due to the PAH molecule, in this case, could be pentacene (C22H14), display emissions at ~ 200 nm and 280 nm. In addition, the FUV spectra of the comet showed emissions due to Lyman alpha, S I, and C I. The comet was at a distance of 0.08 AU from the Earth during the time of observation. The detection of PAH may be due to its close encounter with the Earth. Figure 1 shows the extracted spectra. The detection of PAH emissions at UV wavelengths corroborates with our earlier detection of PAH from the mid-IR spectra [8]. The emission at 309 nm may be a blended feature due to emissions from PAH and OH molecules. Perhaps, refractory residues, such as benzene derivatives, from irradiated aromatic molecules might also contribute to the observed band around 200 nm [9].
Fig 1: HST spectra of 46P Wirtanen with emissions due to HI, CI, SI, and PAH.
Conclusion
The NUV spectra of the comet 46P Wirtanen showed emissions due to the PAH molecule and/or benzene derivative. The FUV spectra showed emissions due to Lyman alpha, C I, and S I.
References
[1] M.C. Festou, H. U. Keller, H.A. Weaver, Eds., Comets II (Univ. of Arizona Press, Tucson, AZ, 2004)
[2] A. H. Delsemme, Adv. Space Res. 12, 5 (1992)
[3] M. Combes, J. Crovisier, T Encrenaz, V.I Moroz, J.P. Bibring, Icarus, 76, 404, 1988
[4] T. Ootsubo, H. Kawakita, Y. Shinnaka, J.I. Watanabe, M. Honda, Icarus, 338, 113450, 2020
[5] P. Feldman, H. Weaver, M. Festou, et al, Nature, 286, 132, 1980
[6] J. Clairemidi, G. Moreels, O.Mousis, P. Brechignac, A&A, 492, 245, 2008
[7] G. Malloci, G. Mulas, C. Joblin, A&A, 426, 105, 2004
[8] Venkataraman V, Arijit Roy, Bhalamurugan Sivaraman, Shashikiran Ganesh, Nigel Mason, EPSC2020-1072, 2020
[9] K K Rahul, E Shivakarthik, J K Meka, A Das, V Chandrasekaran, B N Rajasekhar, J I Lo, B M Cheng, P Janardhan, A Bhardwaj, N J Mason, B Sivaraman, SpecChimica Acta Part A, 231, 117797, 2020.
How to cite: Roy, A., Veeman, V., and Sivaraman, B.: Spectroscopic investigation of Comet 46P Wirtanen at UV wavelengths, Europlanet Science Congress 2021, online, 13–24 Sep 2021, EPSC2021-777, https://doi.org/10.5194/epsc2021-777, 2021.
We present an analysis of the dynamic dust coma of Centaur 29P/Schewassmann-Wachmann 1 and long-period comet C/2020 R4 (Atlas). Comet P/SW1 has exhibited a considerable level of activity (so-called outbursts) since its discovery in 1925. In 2011, we found the morphology of comet P/SW 1 showed dust features in the form of jets, spirals and shells. This year, we have obtained multi-wavelength observations of 29P/SW 1's dust coma at Lulin observatory and we will present preliminary results including the morphological analysis and the colour (B-V, V-R, and R-I) investigation of the dust coma when comet is at quiet and active period.
At least three outbursts found within two weeks from comet Atlas is unusual for long-period comet. However, we didn’t find any new jet features and fragments from the morphology of comet Atlas. Except for the color investigation during the outburst, we will also give the dust/gas production rates in the comparison between pre- and post-outbursts.
How to cite: Lin, Z.-Y., Kelly, M. S. P., and Ip, H.-W.: The outbursts of comet 29P/SW-1 and C/2020 R4 (ATLAS), Europlanet Science Congress 2021, online, 13–24 Sep 2021, EPSC2021-448, https://doi.org/10.5194/epsc2021-448, 2021.
Abstract
The Metis coronagraph on-board the Solar Orbiter ESA mission is devoted to the study of the solar corona, but will also have the chance to observe near-Sun comets. Starting from November 2021 the scientific phase of the Solar Orbiter mission will take place.
Metis can observe comets passing into its Field of View (FoV) covering an annulus between 1.6° and about 3° centered in the Sun direction.
For the first time, simultaneous observation of comets both in the visible and in the UV at the Lyman-alpha can be performed.
Comets with known trajectories passing in the Metis FoV will be planned to be observed; all the other comets, likely to be the majority, will be observed by serendipity.
1. Introduction
A comet passing through the solar corona provides a means to estimate the plasma parameters at each point along its path, which is a useful complement to remote sensing.
In addition to the clear value for solar physics, heliophysics, and space weather application, continuous coverage of the region surrounding the Sun by a coronagraph is important for the advancement of our understanding of near-Sun comets [1].
SOHO-LASCO C2 and C3 have discovered about 4 thousand Sun-grazing and near-Sun comets; STEREO-SECCHI has also discovered a number of comets.
SOHO-UVCS had the chance to study about 20 comets in the UV [2].
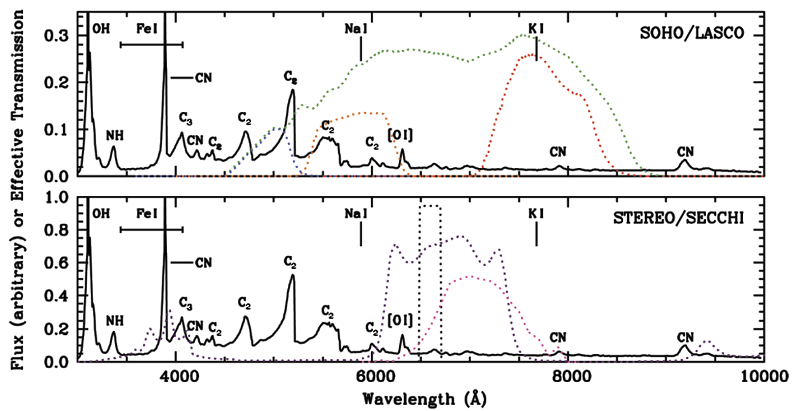
Figure 1 SOHO-LASCO and STEREO-SECCHI bandpasses overlaid on a typical comet spectrum expressed in arbitrary units [1].
As for the future solar missions, Solar Orbiter has been launched in February 2020 and, after a commissioning phase, its nominal scientific mission will start in November 2021. The mission is foreseen to last for about 10 years with the spacecraft orbit slowly moving out of the ecliptic plane to allow the study of the Sun’s polar regions.
On board the Solar Orbiter spacecraft the Metis coronagraph is mounted [3].
2. The Metis coronagraph
Metis has been conceived to acquire both visible and UV images of the solar corona. It is the first coronagraph that will allow simultaneous observation in visible light (VL) and UV.
The Metis instrument is conceived to image the solar corona from a near-Sun orbit in the UV narrow band HI Lyman-alpha at 121.6 nm, and in the polarized broad-band visible light (580 – 640 nm).
The instrument is designed to image the structure and dynamics of the full corona in the range from 1.6 to 3.1 solar radii (Rs), at minimum perihelion distance (0.28 AU), and from 2.8 Rs to 5.5 Rs, at 0.5 AU. The annular FoV covered by the instrument is between 1.6° and 2.9°, and the attained spatial resolution is 20" [4].
A sketch of the raytrace of the two channels of the Metis coronagraph, i.e. the UV and VL, is given in Figure 2.
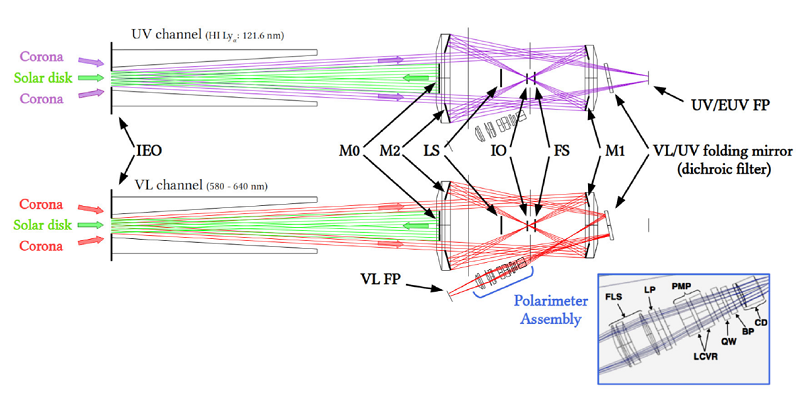
Figure 2 Metis layout. On the top: the UV path. On the bottom: the VL path [4].
The VL channel bandpass of Metis includes the NaI doublet, i.e. at about 589 nm, and this feature should help comet observation since the NaI emissions may make near-Sun comets very bright. As for the UV channel, strong Lyman-alpha emissions are expected to be observed in comets [5].
The scientific highlights of Metis coronagraph observation of comets can be summarized as follows:
- VL observations near comet perihelion are useful to study scattering, side distribution, and quantity of dust.
- HI Lyman-alpha observation allows to infer solar wind direction, speed and density.
- Analyze comet tail direction and its dynamics [6].
3. Planning for observing comets
In order to predict and allow planning for the observation of known comets, a tool to calculate the “transit” of the comet in the FoV of Metis is being devised by the team.
An example of the foreseen passage of the comet C/2021 A1 Leonard in December 2021 can be seen in Figure 3.
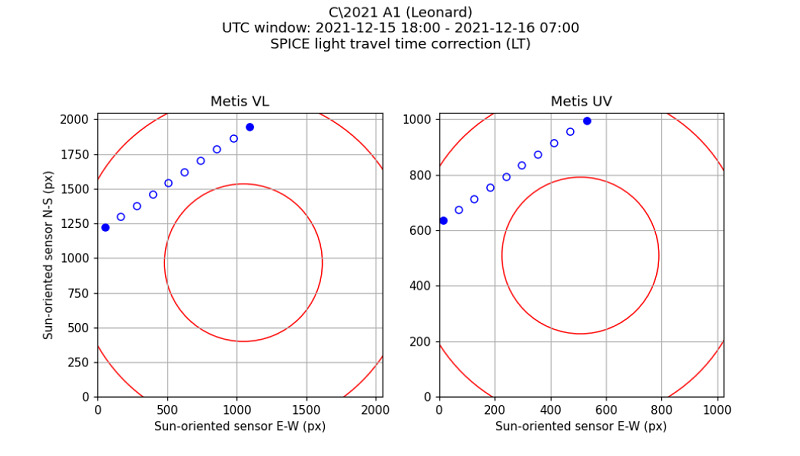
Figure 3 Expected “transit” of the comet Leonard in the Metis FoV both for the VL and the UV channel.
4. Conclusions
The Metis coronagraph on-board the Solar Orbiter mission will have the chance to observe some comets.
Future observation campaigns are foreseen and will be devoted to study some of the possible comets passing inside the instrument FoV both in the VL, with the possibility of polarization imaging, and at the same time in the UV (Lyman-alpha).
Some other comets will be imaged by chance during the nominal observation foreseen for Metis.
Both the populations “foreseen” and ‘by chance’ comets can give some insights to probe the near environment of the Sun but also help in studying the physics and processes occurring in the tail and nucleus of the comet itself.
For the first time and of extreme importance, with the Metis coronagraph, comets are going to be observed simultaneously both in the visible and in the UV (Lyman-alpha).
Acknowledgements
Solar Orbiter is a space mission of international collaboration between ESA and NASA, operated by ESA. Metis was built and operated with funding from the Italian Space Agency (ASI), under contracts to the National Institute of Astrophysics (INAF) and industrial partners. Metis was built with hardware contributions from Germany (Bundesministerium für Wirtschaft und Energie through DLR), from the Czech Republic (PRODEX) and from ESA.
References
[1] Jones, G.H. et al., "The Science of Sungrazers, Sunskirters, and Other Near-Sun Comets", Space Sci Rev 214(20) (2018).
[2] Bemporad, A. et al., "A review of SOHO/UVCS observations of sungrazing comets", Planetary and Space Science 55(9), 1021-1030 (2007).
[3] Antonucci, E. et al., "Metis: the Solar Orbiter visible light and ultraviolet coronal imager,” A&A 642, A10 (2020).
[4] Fineschi, S. et al., "Optical design of the multi-wavelength imaging coronagraph Metis for the solar orbiter mission," Exp. Astron. 49, 239-263 (2020).
[5] Bertaux, J. L. et al. "Interpretation of Hydrogen Lyman-Alpha Observations of Comets Bennett and Encke", A&A 25, 415-430 (1973)
[6] Nisticò, G. et al., "Oscillations of cometary tails: a vortex shedding phenomenon?", A&A 615, A143 (2018).
How to cite: Da Deppo, V., Nisticò, G., Giordano, S., Battams, K., Gallagher, B., and Chioetto, P. and the Metis "Comets and other Solar System Bodies" Topical Team: Observing comets with the Metis coronagraph on-board the Solar Orbiter mission, Europlanet Science Congress 2021, online, 13–24 Sep 2021, EPSC2021-394, https://doi.org/10.5194/epsc2021-394, 2021.
Introduction
One of the most important meteor shower is that of the Taurids, which is associated with comet 2P/Encke. Although meteors are usually produced by very small particles, some recent Taurid fireballs have been associated to much larger meteoroids or even to asteroid-sized objects. It has been suggested, in fact, that, in addition to comet 2P/Encke, other kilometer-sized objects, asteroids and comets, have orbits very similar to those of meteoroids which produce the Taurid meteor shower (Napier, 1980; Seargent, 2017). All these large and small bodies are collectively called Taurid Complex (TC). According to Clube and Napier (1984) this complex could be the result of the fragmentation of a large comet (with a size of about 100 kilometer), occurred 10,000-20,000 years ago.
Procedure and results
In our work, as a first step, the belonging to the TC of a large number of candidates, proposed in the literature by various authors, has been checked, using the often adopted modified D criterion (Asher, Clube and Steel, 1993). This criterion uses the D parameter which measures the deviations of the orbital parameters a (semi-major axis), e (eccentricity) and i (inclination) with respect to the reference ones, representing the average of the orbital parameters of the various meteor streams belonging to the complex (Steel, Asher and Clube, 1991). Note that the longitude of perihelion does not enter in the definition of D for the reasons reported by Asher, Clube and Steel (1993).
Adopting a threshold value Dt = 0.25 for the membership to the TC (Ferrin and Orofino, 2021), we have found that 88, out of the proposed 141 objects, satisfy the modified D criterion.
It is important to note that the average values of a, e and i of the 88 selected objects show not entirely negligible differences compared to the average values of the meteor streams belonging to the TC. This is not surprising, however, since the TC is composed by two components (see the Introduction): a first one, made up by the meteor showers particles, and a “background” of larger objects (asteroids or comets). The former are groups of very small bodies (meteroids and micrometeoroids) whose motion, precisely due to their small sizes, is affected not only by gravitational forces but also by non-gravitational ones (due i.e. to Pointing-Robertson effect or to radiation pressure) that heavily perturb the Keplerian motion of these particles so much that they are often very quickly removed from their original orbits. The objects of the second component, instead, have sizes large enough that their orbits are unaffected by non-gravitational forces and are only affected by the gravitational perturbations of Jupiter. As a consequence, the dynamic behaviors of the two components are not exactly the same.
Among the objects belonging to the TC there are four recognized comets (2P/Encke, 169P/NEAT, P/2003 T12 and D/1766 G1 Helfenzrieder) along with a number of asteroids with sizes more than a kilometer (such as Hephaistos, Oljiato, Cuno, Mithra). In particular, it has been found that asteroid Hephaistos and comet 169P/NEAT have their own sub-group inside the TC (see Figure 1).
According to our results, another important member of the complex was very probably also the small asteroid that exploded in the terrestrial atmosphere over Tunguska in 1908.
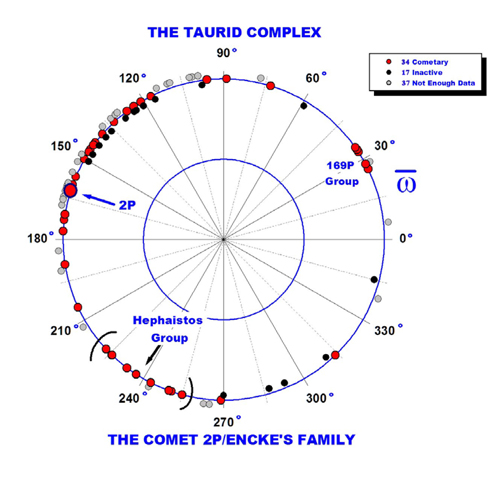
Figure 1. Polar diagram showing the distribution of the longitude of perihelion of the orbit of the TC members. The objects are placed at slightly different distances to the center, in order to see the different groups distinctly. This diagram shows the close relationship between 2P/Encke and asteroid Hephaistos.
As a second step the cometary nature of the objects listed as asteroids has been analyzed, searching for photometric traces of activity, especially if close to perihelion. This has been accomplished using the Secular Light Curve (SLC) formalism (see Ferrin and Orofino, 2021, and references therein): out of the 88 members of TC, 51 have useful SLCs and 34 of these (67%) exhibit cometary activity and thus are activated asteroids.
Our results give a photometric support to the hypothesis that the objects of the TC are related to comet 2P/Encke and that the disintegration event postulated by Clube and Napier (1984) really took place.
The hypothesized scenario starts with a large comet (the parent body) of minimum size of about 30 km. This lower limit has been evaluated starting from the present total volume of the TC objects and extrapolating backward this value, by means of a simple model of mass loss due to the cometary activity. Because of fragmentation, the real original diameter of the parent body was greater than 30 km, reaching 120 km (see Ferrin and Orofino, 2021, for details).
A heterogeneous structure of the original body, similar to a rubble pile (that is made by elementary, rocky or carbonaceous blocks, held together inside an icy matrix and surrounded by a crust of silicatic or carbonaceous/organic grains) can explain why objects members of the TC, like Oljato, show a cometary activity (and so an important ice content) coupled with a mostly silicatic superficial composition, suggested by the spectral analysis.
Conclusions
Our work highlights the importance of the study of the objects of the TC, due to the risk of collision with the Earth. Understanding their nature and their characteristics is, in fact, necessary for the choice of the strategies of planetary defense against these dangerous objects.
References
Asher, D. J., Clube, S. V. M., Steel, D. I. (1993). MNRAS 264, 93-105.
Clube, S.V.M., Napier, W. M. (1984). MNRAS 211, 953-968.
Ferrin, I., Orofino, V. (2021). PSS, submitted.
Napier, W.M. (2010). MNRAS 405, 1901-1906.
Seargent, D.A.J. (2017). Weird comets and asteroids. Springer. Cham, Switzerland.
Steel, D. I., Asher, D. J., Clube, S. V. M., (1991). MNRAS 251, 632-648.
How to cite: Orofino, V. and Ferrin, I.: Cometary activity of the objects of the Taurid Complex, Europlanet Science Congress 2021, online, 13–24 Sep 2021, EPSC2021-202, https://doi.org/10.5194/epsc2021-202, 2021.
Images of short period comets returned from spacecraft have been the most valuable sources of information on their nucleus shapes and surface features to date. While there is no doubt that in situ missions are the optimal way to study individual comets in detail, ground-based nucleus observations are a much more practical means of gaining insights into the physical properties of the population as a whole. Even with relatively sparse lightcurve coverage we can extract estimates of their rotation periods, and determine their phase functions. Using precisely calibrated photometry spanning decades, Kokotanekova et al. [1] identified a correlation between increasing linear phase function slope and geometric albedo for 14 Jupiter-family comet (JFC) nuclei. It can be interpreted as a surface evolution from rough, unprocessed surfaces to smooth, eroded nuclei [2]. These results illustrate the significance of long term ground-based monitoring, with exciting implications for future study of small body surface evolution.
In this work, we seek to extend the possible applications of these JFC lightcurves to produce a convex model of a comet nucleus. The overall shape of a body has a much larger effect on its rotational lightcurve than any fluctuations in albedo or light scattering properties across the surface [3,4]. As such, it is possible to extract information about the shape of a small body from its lightcurves alone. The technique of convex lightcurve inversion is routinely used to produce asteroid shape models from their ground-based lightcurves [5,6]. This procedure takes as input lightcurves that cover a wide range of observing geometries (solar phase angle, sub-observer latitude), and uses a linear-exponential solar phase function with combined Lommel-Seeliger and Lambertian light scattering models to create a convex hull representing the object's overall shape - this has been compared to the true shape of the object being "gift-wrapped". To date, this method has been used to produce only one convex model of a comet nucleus. This was the target of the Rosetta mission, comet 67P/Churyumov-Gerasimenko [7]. The procedure mathematically cannot recreate concave features, however the presence of substantial flat regions on the model of 67P masked large concavities, later identified as the slim neck that separates the two lobes of the bilobate shape. Physical considerations regarding the criteria for stability of any shape model may also be used to infer bilobate shapes, given that it is unlikely that single-lobed objects with extremely elongated axis ratios (a/b > 2.3) would have formed naturally [8,9].
Motivated by the relative success of the lightcurve inversion at revealing the physical properties of 67P from limited ground-based observations, we apply this shape modelling procedure to comet 162P/Siding-Spring. R-band lightcurves for this object have been collected between 2007 and 2018, at phase angles in range 0.4°-12°. According to the surface evolution hypothesis, 162P is an example of a dynamically "old", evolved JFC. It has a shallow phase function slope of (0.039±0.002) mag deg-1, a low geometric albedo pR = (2.2±0.3)% - one of the darkest surfaces of all studied comets - and is a slow rotator with a synodic period of (32.853±0.002)h [2]. This is in contrast with comet 67P, which has a high albedo and steeper phase function slope [10], characteristic of what is believed to be a dynamically younger, less eroded surface [11].
The observing geometries for comets are much more limited than for asteroids: the best technique for detecting the bare nucleus without coma contamination is to observe at heliocentric distances >3 au, where the comet is far enough from the Sun that water ice is no longer expected to sublimate. This typically restricts phase angle coverage to <15°. The low orbital inclinations of JFCs further limit the fraction of illuminated surface that can be observed from Earth.
Given the limited observing geometries, using the convexinv software by Ďurech et al. [12] we have found so far that the best physical model for the 162P lightcurves results from treating them as calibrated rather than relative, which requires the additional steps of using distance-corrected magnitudes and fitting a phase function to the light scattering model. Our preliminary convex shape model is shown in Figure 1, with axial ratios a/b = 1.50 and b/c = 2.07 (where c ≤ b ≤ a are the lengths of the principal axes of inertia). The model produces artificial lightcurves from which we obtain a linear fit to the phase function after correcting for rotation. We will present the final results from this analysis at the meeting, having finalised the procedure and tested the robustness of the solution.
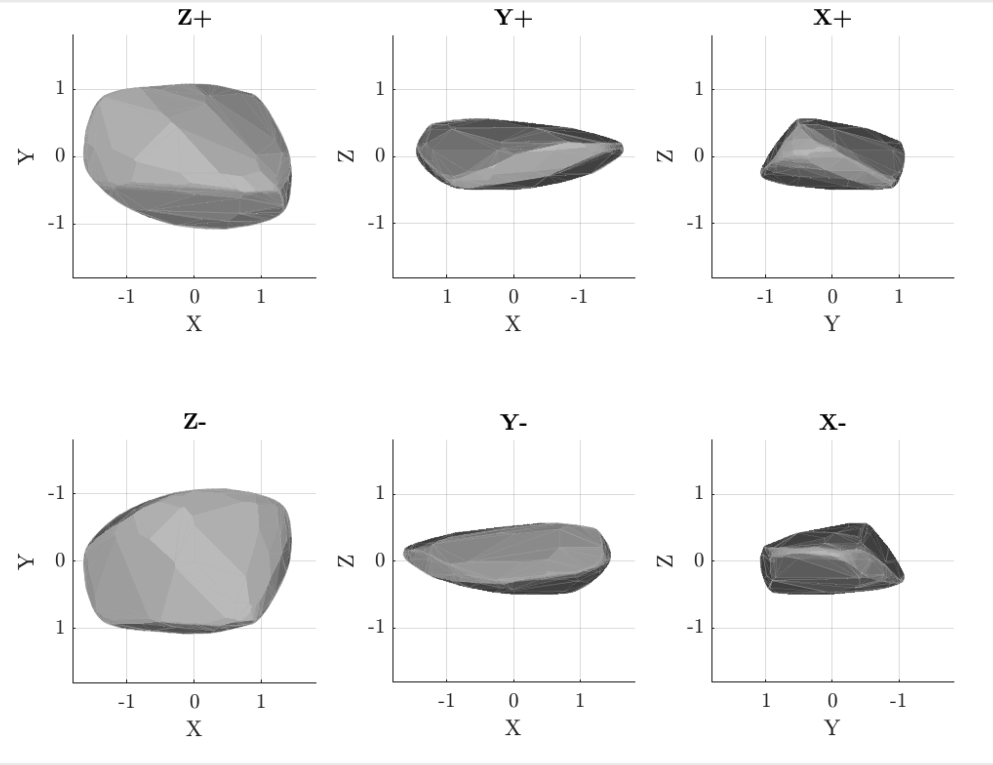
Figure 1: Preliminary convex shape model for comet 162P from ground-based lightcurves. The z-axis is aligned with the spin axis. Top row shows the views along positive z, y, z; bottom row shows views along negative z, y, x.
References:
[1] Kokotanekova et al. 2017, MNRAS 471 2974
[2] Kokotanekova et al. 2018, MNRAS 479 4665
[3] Karttunen H. 1989, A&A 208(1-2), 314-319
[4] Kartunnen H. & Bowell E. 1989, A&A 208(1-2) 320-326
[5] Kaasalainen M. & Torppa J. 2001, Icarus 422(2) L39-L42
[6] Kaasalainen et al. 2001, Icarus 153(1) 24-36
[7] Lowry et al. 2012, A&A 548 A12
[8] McNeill et al. 2018, AJ 156(6) 282
[9] Jeans J. 1919, Problems of cosmogony and stellar dynamics
[10] Fornasier S. et al. 2015, A&A 583 A30
[11] Vincent J-B. et al. 2017, MNRAS 469 S329–S338
[12] Ďurech et al. 2010, A&A 513 A46
How to cite: Donaldson, A., Snodgrass, C., Kokotanekova, R., and Rożek, A.: The convex shape model of 162P/Siding-Spring from ground-based photometry, Europlanet Science Congress 2021, online, 13–24 Sep 2021, EPSC2021-336, https://doi.org/10.5194/epsc2021-336, 2021.
2I/Borisov - hereafter 2I - is the first visibly active interstellar comet observed in the solar system. It was discovered on August 20, 2019 and remained visible for several months, permitting observations with various telescopes around the world and in space. We observed 2I with UVES, the high-resolution optical spectrograph mounted on the UT2 telescope at Paranal observatory in Chile, with the objective to characterize its composition. We collected spectra at 12 different epochs between November 15, 2019, and March 16, 2020, covering a heliocentric distance range from 2.1 au pre-perihelion to 2.6 au post-perihelion.
Our observations allowed us to make several key measurements, some being made for the first time in the coma of an interstellar comet. We detected emissions from the radicals OH, NH, CN, CH, C2, and NH2, the [OI]forbidden oxygen lines at 557.73, 630.03, and 636.37 nm, as well as several FeI and NiI lines. We derived the abundance of FeI and NiI in the coma using the model described in [1] and find log Q(NiI)=21.88±0.07 molecules/s and Q(FeI)=21.67±0.16 molecules/s, corresponding to log(NiI/FeI)=0.21±0.18. This ratio agrees with the value recently found in solar system comets [1], as shown in Fig. 1.
NH2 ortho and para lines from the ro-vibronic (0,8,0) and (0,9,0) bands were measured and allowed us to derive a NH2 ortho-to-para ratio (OPR) of 3.21±0.15, corresponding to an OPR and spin temperature of ammonia of 1.11±0.08 and 31+10/-5 K, respectively. These values are consistent with measurements in solar system comets and likely reflect the physico-chemical conditions in the comet inner coma.
We measured the three forbidden oxygen lines and determined the ratio between the intensity of the green [OI] line and the red doublet. We obtained a rather high value G/R=0.31±0.05 close to perihelion, with possibly an increasing trend while the comet moved away from the Sun. This is consistent with the high CO abundance in the coma of 2I and the increase of the CO/H2O ratio with the heliocentric distance [2,3].
Finally, from the OH (0-0) emission band around 309 nm we derived a water production rate of (2.2±0.2) x 1026 molecules/s close to perihelion on December 24 and 26, 2019.
In conclusion, high spectral resolution observations of 2I/Borisov and the associated measurements of the NH2OPR and the Ni/Fe abundance ratio are remarkably similar to solar system comets. The measured G/R ratio is unusually high but consistent with the high abundance ratio of CO/H2O found by other investigators [2,3] and potentially suggesting formation in a colder environment.
Figure 1: Comparison between the log(Ni/Fe) ratio of 2I and the values measured by [1] for a sample of solar system comets (Jupiter Family Comets (JFC), Oort Cloud Comets (OC), and Halley Type Comets (HTC)). The horizontal line represents the average value for solar system comets from [1].
References:
[1] Manfroid, J., Hutsemékers, D., & Jehin, E. 2021, Nature, 593, 372
[2] Cordiner, M. A., Milam, S. N., Biver, N., et al. 2020, Nature Astronomy, 4, 861
[3] Bodewits, D., Noonan, J. W., Feldman, P. D., et al. 2020, Nature Astronomy, 4,86
How to cite: Opitom, C., Jehin, E., Hutsemékers, D., Shinnaka, Y., Manfroid, J., Rousselot, P., Raghuram, S., Kawakita, H., Fitzsimmons, A., Meech, K., Micheli, M., Snodgrass, C., Yang, B., and Hainaut, O.: High resolution optical spectroscopy of 2I/Borisov: a surprising similarity to solar system comets, Europlanet Science Congress 2021, online, 13–24 Sep 2021, EPSC2021-178, https://doi.org/10.5194/epsc2021-178, 2021.
Comets are primitive objects which formed in the outer parts of the proto-planetary disk, beyond the snow line. They can provide key information about the origins of our Solar System and its primordial nebula. The latest interstellar visitor [1], comet 2I/Borisov (initially designated C/2019 Q4), has given us the chance to have a probe from this environment of an unknown star and to explore the possibility of exchanging material between different planetary systems.
We took advantage of this opportunity by performing an extended observational program over two months and a half time interval, between October 3 and December 13, 2019. We obtained observations of 2I/Borisov with the 1.52m Telescopio Carlos Sánchez located on Teide Observatory, Tenerife, Spain. This telescope is equipped with MuSCAT2 instrument [2] which allows to obtain spectrophotometric data in four optical filters (g, r, i, z_s). The images are acquired simultaneously thanks to a dichroic mirrors system. Thus, we gather data on 26 observational nights, for about one hour of observations on each night. During this time which corresponds mainly before the perihelion passage of this comet, 2I/Borisov was visible before the morning twilight.
We used the Photometry Pipeline (PP) software [3] and several Python scripts in order to calibrate the images. We used the NoiseChisel tool, included in the Gnuastro package [4] to detect the faint structure of the 2I/Borisov coma. Here we report the preliminary results corresponding to 15 nights of observations on which the comet didn't overlapped with a background source.
First, we determined the optical colors by considering a fixed linear aperture (of 15000 km, which in angular distance is equivalent of 8.3 - 10.3 arcseconds, depending on the distance Earth-comet). We found the average values of g-r = 0.67 +/- 0.06; r-i = 0.20 +/-0.07, and i-z_s = 0.14 +/- 0.07. Within the error bars, these values remained constant over all the observed period. These values are similar with those of Solar System long-period comets and of Trans-Neptunian objects [5].
Second, for each observing set we studied the morphology of the coma. This allows us to identify two outbursts at the beginning of October, 2019 when the comet was at a heliocentric distance of 2.47 - 2.46 A.U. Fig. 1 shows four images obtained with r filter during that time. The morphology is consistent in each band we investigated.
Last but no least, we computed the effective scattering cross-section. The results are shown in Fig. 2, and highlights the minor outburst from the beginning of October, 2019. These findings are compared to other results which obtained data around our observing time interval [6, 7]. A further step in this analysis is to compute the dust production rate and the total mass loss. The dust model takes into account the size distribution of particles and the scattering efficiency of the cross-sections.
Fig. 1 The stacked images for the comet 2I/Borisov, obtained during the beginning of October 2019. The black arrows show the right ascension and the declination direction. The blue and the yellow arrows show the anti-velocity and anti-solar vectors.
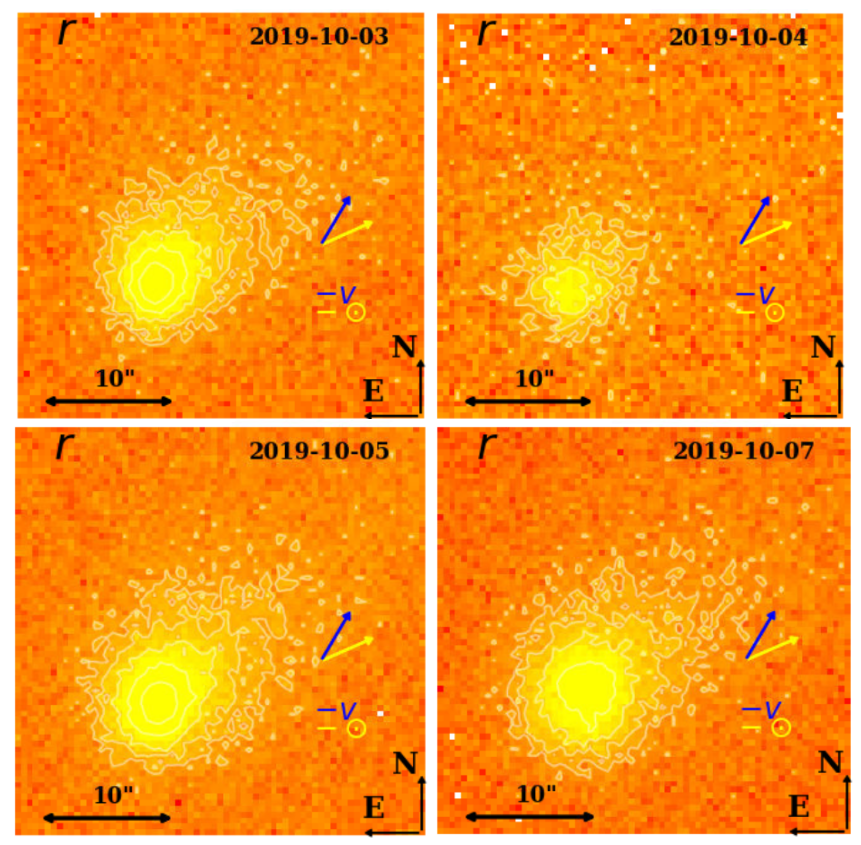
Fig. 2 Effective scattering cross-section as a function of time. The heliocentric distance is also shown.
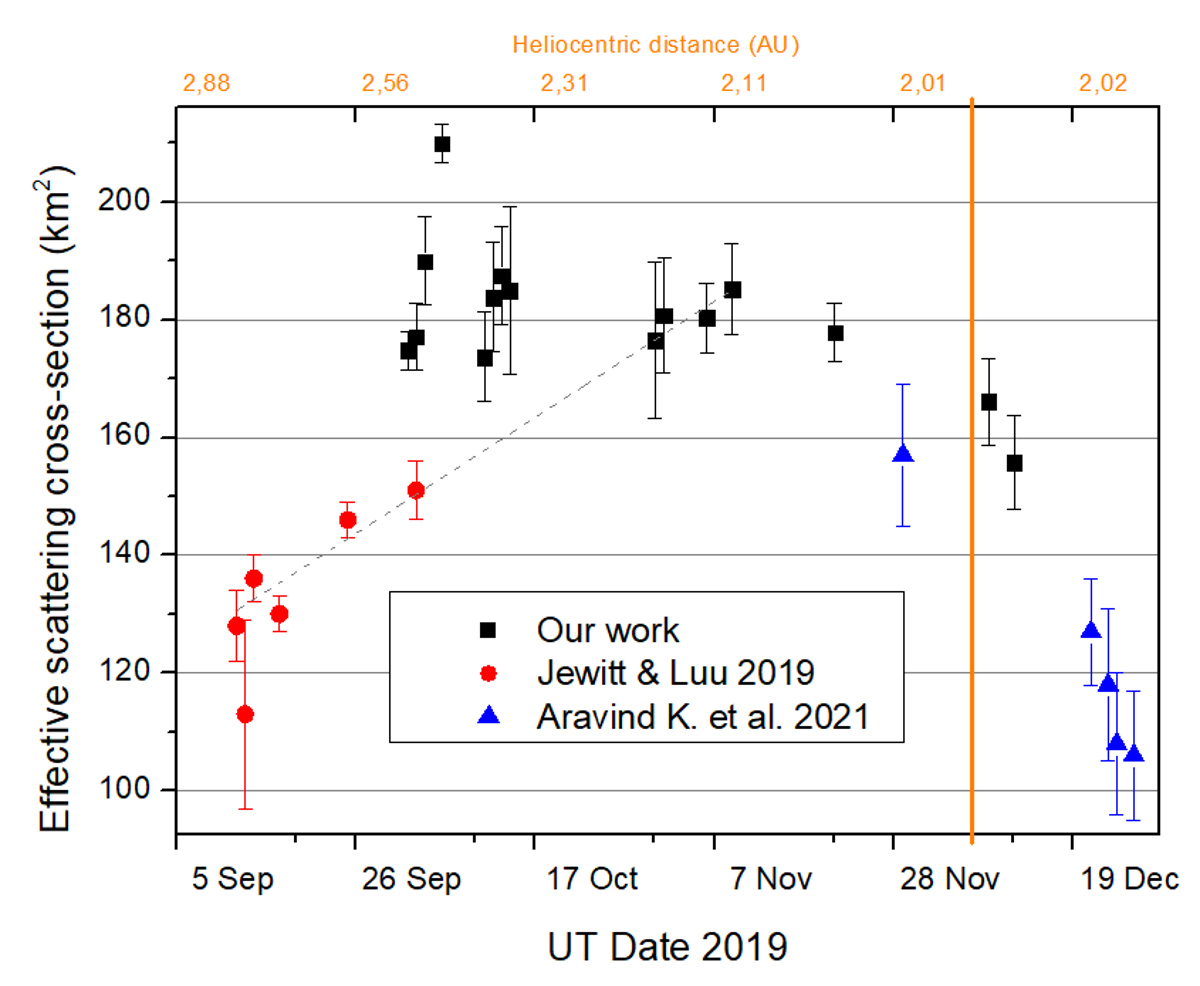
References
[1] de León, Julia et al.; MNRAS, Volume 495, Issue 2, pp.2053-2062, (2020).
[2] Narita, Norio et al.; Journal of Astronomical Telescopes, Instruments, and Systems, Volume 5, id. 015001 (2019).
[3] Mommert, Michael; Astronomy and Computing, Volume 18, p. 47-53 (2017).
[4] Akhlaghi, Mohammad; Ichikawa, Takashi; The Astrophysical Journal Supplement Series, Volume 220, Issue 1, article id. 1, 33 pp. (2015).
[5] Solontoi, Michael; Icarus, Volume 205, Issue 2, p. 605-618 (2010)
[6] Jewitt, David; Luu, Jane; The Astrophysical Journal Letters, Volume 886, Issue 2, article id. L29, 6 pp. (2019).
[7] Aravind, K. et al., Monthly Notices of the Royal Astronomical Society, Volume 502, Issue 3, pp.3491-3499 (2021)
How to cite: Prodan, G. P., Popescu, M., Licandro, J., Akhlaghi, M., de León, J., Tatsumi, E., Păstrav, B. A., Hibbert, J. M., Văduvescu, O., Simion, G. N., Pallé, E., Narita, N., and Murgas, F.: Spectrophotometric characterization of interstellar comet 2I/Borisov before perihelion passage, Europlanet Science Congress 2021, online, 13–24 Sep 2021, EPSC2021-477, https://doi.org/10.5194/epsc2021-477, 2021.
Despite that they are the brightest representatives of trans-Neptunian objects, many dwarf planets still miss a well-determined light curve and hence rotation period, in many cases due to the biases and aliases of ground-based observations. As it was previously shown in the case of e.g. Gonggong (2007 OR10), one of the largest Kuiper belt objects known, a well determined rotation period can be deduced from light curve data obtained by space surveys with original goals very different from the observations of Solar system objects (Pál et al., 2016; Kiss et al., 2017). In the case of Gonggong the observations were taken in the framework of the K2 mission of the Kepler Space Telescope (Howell et al., 2014) which was initially dedicated to measure exoplanet transits. However, in its K2 mission the telescope was pointed to the ecliptic, and allowed the long, in some cases up to ~80 day measurements of small solar system bodies, resulting in a previously undetected overabundance of long rotation periods in many of the small body populations, including the Hildas, Jovian Trojans, Centaurs, as well as trans-Neptunian objects (Kalup et al., 2021; Kiss et al., 2020; Marton et al., 2020; Szabó et al., 2017, 2020).
The Transiting Exoplanet Survey Satellite (TESS, Ricker et al., 2015) was also designed originally to find exoplanets and avoid the vicinity of the ecliptic. However, it was still able to observe many asteroid at intermediate ecliptic latitudes. While the maximum length of the TESS observations are shorter than those in the K2 mission (28 days vs. 80 days) these are still much longer than that a typical long observing campaign can provide from the ground. Recently, a large number of main belt asteroid light curves was obtained by TESS, leading to the discovery of a previously undetected group of slow rotators (Pál et al., 2020). Due to the smaller light collecting area most trans-Neptunian objects are too faint to be observed with TESS, but the largest ones -- the dwarf planets -- are bright enough to provide a meaningful light curve.
In this presentation we show results from the analysis of TESS light curves of the Kuiper belt dwarf planets Eris, Makemake and Orcus. These data are, in some cases, combined with ground-based data, and also with thermal emission measurements to constrain the spin axis orientation and determine how the light curve can be caused by surface features. As all the three targets have companions, the rotational information can also be incorporated into tidal evolution models and can be used to constrain the formation scenarios of the system, and, in some cases, give hints on the internal structure and material properties.
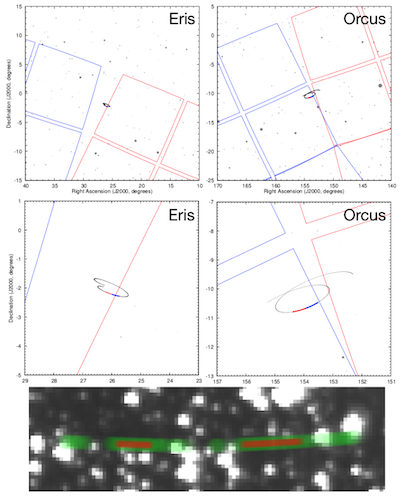
Figure 1: Right panels: The apparent path of Eris during the first year of the TESS observations just in between the boundaries of TESS Sectors #3 (red) and #4 (blue). During its retrograde motion, Eris just misses Camera #1, CCD #3 of Sector #3. The thin line shows the full path of Eris while the thick red and blue sections correspond to the observing runs of Sectors #3 and #4, respectively. Left panels: The same plot for Orcus and for TESS Sectors #8 (red) and #9 (blue). Orcus has been observed during Sector #9 by CCD #1 of Camera #1, pretty close to the CCD edges. Bottom panel: The apparent track of Orcus within the field of view of TESS Camera #1 CCD #1, section [44:144]x[1675:1705]. The semi-transparent green curve shows the full track where observations were available while the thin red curve shows the track from which data points were involved in the photometric analysis. The direction of this section with respect to the sky is mirrored (east is nearly to the right and north points nearly to up): Orcus moved from the left to right due to its retrograde motion at its opposition.
References:
- Howell, S.B., et al., 2014, PASP, 126, 398
- Kalup, C., et al., 2021, ApJS, 254, 7
- Kiss C., et al., 2017, ApJL, 838, L1
- Kiss, C., et al., 2020, EPSC2020-536
- Marton, G., et al., 2020, Icarus, 345, 113721
- Pál, A., et al., 2020, ApJS, 247, 26
- Ricker, G.R., et al. 2015, J. Astron. Telesc. Instrum. Syst. Vol. 1,id. 014003
- Szabó et al., 2017, A&A, 599, 44
- Szabó et al., 2020, ApJS, 247, 26
How to cite: Kiss, C., Farkas-Takács, A., Szakáts, R., Müller, T., and Pál, A.: Dwarf planet light curves with TESS, Europlanet Science Congress 2021, online, 13–24 Sep 2021, EPSC2021-123, https://doi.org/10.5194/epsc2021-123, 2021.
The Lucy mission [1] will be the first mission to study the Jupiter Trojans (JT) population up close. During flybys of six Jupiter Trojans between 2027 and 2033, it will sample the diversity of Trojans. The targets include a C-type Trojan, and the largest member of a collisional family (3548) Eurybates [2], the two D-type Trojans (11351) Leucus, and (21900) Orus, as well as the three P-type Trojans (15094) Polymele, and the almost equal mass binary pair (617) Patroclus and Menoetius.
Trojans are thought to be outer solar system planetesimals. They orbit Sun in a 1:1 resonance with Jupiter in two swarms around the L4 and L5 Lagrangian points of the Sun-Jupiter system where they lead/trail Jupiter by 60° respectively. Jupiter Trojans are known to be quite stable over the age of the solar system with only ∼25% having escaped the resonance since they were captured [5, 6, 7]. There are ∼3,000 Jupiter Trojans larger than 10 km [8] making the population smaller than e.g. the main-belt asteroid population (∼10,000 larger than 10 km, [9]). The Trojans show a bimodal colour distribution [10, 8, 11]. While the “red" Trojans overlap with “red" Kuiper belt objects (KBOs) and Centaurs, the “less-red" Trojan population does not have a clear analogue in the KBO population [11]. On the other hand, there is no analogue for the "very red" KBOs in the Trojans. The Eurybates family members not only stand out due to their orbital elements (i.e. their inclinations are tightly confided to 7.5° ± 0.5° ) but also because they are bluer than even the “less-red" Trojans. This might imply that KBOs and Jupiter Trojans have a common origin but then evolved differently e.g. due to the different collisional environment [11]. The strong excitation in inclinations (up to 30°) is an important constraint on the capture mechanism and thus the origin of Jupiter Trojans.
Jupiter Trojans are unlikely to have formed at their current location. Different models have been developed to describe their origin and capture into the Lagrange regions. First, in the “jumping Jupiter" model [12] the primordial planetesimal disk gets scattered by the giant planet instability outwards into the TNO region and inwards where they are captured by Jupiter that jumps in semi-major axis. The advantage of this model lies in the fact that it accurately predicts the size of the Jupiter Trojans and their orbital distribution. In the second model proposed by [13] Jupiter forms at ∼ 20 au and subsequently migrated to its current location sweeping up planetesimals in the process and capturing them in the resonance. This model accounts for the asymmetry in the size of the two Trojan swarms but does not capture the inclinations unless the primordial disc is already excited. The forthcoming Lucy mission will be instrumental in differentiating between these models and provide crucial information on the formation and evolution of Jupter Trojans.
In this work we study the collisional evolution of the Jupiter Trojans and the Eurybates family to understand their implications for i) their material strength, and ii) the age of the Eurybates family and newly discovered satellite Queta [15] because its survival has implications for the family forming event. By modelling the collisional evolution of the L4 swarm using the Boulder collisional code [16, 17] we find that to a degree the age and strength of the Eurybates family and Queta are correlated and depend on the size-frequency distribution of the Jupiter Trojans at small sizes (< 1 km).
This is illustrated in Fig. 1 showing the survival probability of the Eurybates-Queta system (green) for different ages of the Eurybates family and different disruption strengths, Q∗D. We have varied the material strength over two orders of magnitude, ranging from Q∗D = Q0 which corresponds to slightly weaker material than the ”weak ice" of [18] and Q∗D = 100 Q0 which is slightly stronger than the basalt targets in [19]. The ”weak ice" material can be ruled out for any of the suggested ages of the family. Should the family be as young as 1 Gy, a material strength as low as ∼ 4 Q0 is possible. A 4.5 Gy age of the family would require strong material for the Eurybates-Queta system to have survived to this day.
Figure 1: The fraction of cases where Queta survives (green), or is destroyed or an impact dissolves the sytem (pink) is shown for simulations over 1 Gy and 4.5 Gy.
The size-frequency distribution (SFD) of the Eurybates family shows a significantly steeper slope between 10 and 20 km than the L4 swarm (Fig. 2). This is indicative of a collisional family and we will show that the family SFD most closely resembles outcomes of collisions of rubble piles [20] thus implying weak material strength. In combination with the survival probability (Fig. 1) this suggests that the age of the Eurybates family is towards the lower end of the estimated age.
Figure 2: The L4 (blue) and Eurybates family (red) size distribution are shown using the NEOWISE sizes.
References
[1] Levison et al. (2017), LPSC, 2025.
[2] Brož & Rozehnal (2011), MNRAS, 414, 565.
[3] Buie et al. (2018), AJ, 155, 245.
[4] Mottola et al. (2020), PSJ, 1, 73.
[5] Levison, Shoemaker, Shoemaker, C. S. (1997), Nature, 385, 42.
[6] Di Sisto, Ramos, Beaugé (2014), Icarus, 243, 287.
[7] Holt et al. (2020), MNRAS, 495, 4085.
[8] Emery et al. (2015), Asteroids IV, 203.
[9] Bottke et al. (2015), Asteroids IV, 701.
[10] Roig, Ribeiro, Gil-Hutton (2008), A&A, 483, 911.
[11] Wong & Brown (2016), AJ, 152, 90.
[12] Nesvorný, Vokrouhlický, Morbidelli (2013), ApJ, 768, 45.
[13] Pirani et al. (2019), A&A, 623, A169.
[14] Stern et al. (2019), Science, 364, aaw9771.
[15] Noll et al. (2020), PSJ, 1, 44.
[16] Morbidelli et al. (2009), Icarus, 202, 310.
[17] Nesvorný et al. (2011), AJ, 141, 159.
[18] Leinhardt & Stewart (2009), Icarus, 199, 542.
[19] Benz & Asphaug (1999), Icarus, 142, 5.
[20] Benavidez et al. (2012), Icarus, 219, 57.
How to cite: Marschall, R., Nesvorný, D., Deienno, R., Wong, I., Levison, H. F., and Bottke, W. F.: Implications for the collisional strength of Jupiter Trojans from the Eurybates family, Europlanet Science Congress 2021, online, 13–24 Sep 2021, EPSC2021-507, https://doi.org/10.5194/epsc2021-507, 2021.
We present visible and mid-infrared imagery and photometry of temporary Jovian co-orbital comet P/2019 LD2 taken with Hubble Space Telescope/Wide Field Camera 3 (HST/WFC3), Spitzer Space Telescope/Infrared Array Camera (Spitzer/IRAC), and the GROWTH telescope network, visible spectroscopy from Keck/Low-Resolution Imaging Spectrometer (LRIS), and archival Zwicky Transient Facility observations taken between 2019 April and 2020 August. Our observations indicate that the nucleus of LD2 has a radius between 0.2 and 1.8 km assuming a 0.08 albedo and a coma dominated by ∼100 μm-scale dust ejected at ∼1m s−1 speeds with a ∼1'' jet pointing in the southwest direction. LD2 experienced a total dust mass loss of ∼108 kg at a loss rate of ∼6 kg s−1 with Afρ/ cross-section varying between ∼85 cm/125 km2 and ∼200 cm/310 km2 from 2019 April 9 to 2019 November 8. If the increase in Afρ/cross section remained constant, it implies LD2ʼs activity began ∼2018 November when within 4.8 au of the Sun, implying the onset of H2O sublimation. We measure CO/CO2 gas production of <1027 mol s−1/<1026 mol s−1 from our 4.5 μm Spitzer observations; g–r = 0.59 ± 0.03, r–i = 0.18 ± 0.05, and i– z = 0.01 ± 0.07 from GROWTH observations; and H2O gas production of <80 kg s−1 scaling from our estimated C2 production of QC2 < 7.5 x 1024 mol s−1 from Keck/LRIS spectroscopy. We determine that the long-term orbit of LD2 is similar to Jupiter-family comets having close encounters with Jupiter within ∼0.5 Hill radius in the last ∼3 y and within 0.8 Hill radius in ∼9 y. Additionally, 78.8% of our orbital clones are ejected from the solar system within 106 yr, having a dynamical half-life of 3.4 × 10⁵ yr.
How to cite: Bolin, B., Fernandez, Y., Lisse, C., and Holt, T.: Initial Characterization of Active Transitioning Centaur, P/2019 LD2 (ATLAS), Europlanet Science Congress 2021, online, 13–24 Sep 2021, EPSC2021-145, https://doi.org/10.5194/epsc2021-145, 2021.
The Centaur (10199) Chariklo is a small body moving in an elliptical orbit, between Saturn and Uranus, with heliocentric distances ranging 13.1 and 18.9 au. It is the largest object known in this orbital region, and since its discovery in 1997 (Ticha et al. 1997), many studies tried to characterise this object. From the literature, different observational techniques give an equivalent surface radius ranging between 109 and 151 km (Sekiguchi et al., 2012; Lellouch et al., 2017). Additionally, a ring system was detected by Braga-Ribas et al. (2014) using stellar occultation data sets acquired in 2013. Between 2013 and 2016, other stellar occultations brought more detailed information on this system (Bérard et al., 2017; Leiva et al., 2017).
A stellar occultation occurs when a solar system object passes in front of a star for an observer on Earth. Using this technique it is possible to determine sizes and shapes at kilometre precision and to obtain other physical parameters, such as its albedo, the presence of an atmosphere, rings, jets, or topographic features (Braga-Ribas et al., 2013, 2019; Dias-Oliveira et al., 2015, 2017; Benedetti-Rossi et al., 2019; Ortiz et al., 2017; Leiva et al., 2017; Bérard et al., 2017; Santos-Sanz et al., 2021).
After the release of the Gaia DR2 catalogue (Gaia collaboration et al., 2018), the stars' positions are known with uncertainties below one milliarcsecond (mas). Moreover, after successful stellar occultations observations, Chariklo ephemeris was updated, now it has uncertainties below five mas ($\sim$50 km at Chariklo's distance). Accurate star's positions and updated ephemeris resulted in successful observational campaigns in Namibia (22/06/2017), South America (23/07/2017) and La Réunion (08/08/2019). These were the first Chariklo occultations with more than three chords across the main body. These events increased our knowledge about Chariklo's shape, and this information can be used to constrain the dynamic of its rings. Six other events were observed between 2017 and 2020, however with fewer detections on the main body.
In this work, we will present the obtained results, such as the global shape of Chariklo's rings system, including its pole determination, the ring width variation, structures within the rings (see Figure 1), the width of the gap between C1R and C2R and limits for the ring eccentricity and particle's sizes. Also, the 3D shape of Chariklo was obtained from eleven stellar occultations observed between 2013 and 2020 (see Figure 2). The parameters obtained in this work should be useful for constraining dynamical models of Chariklo and its rings and provide new insights into the formation and evolution of this system.
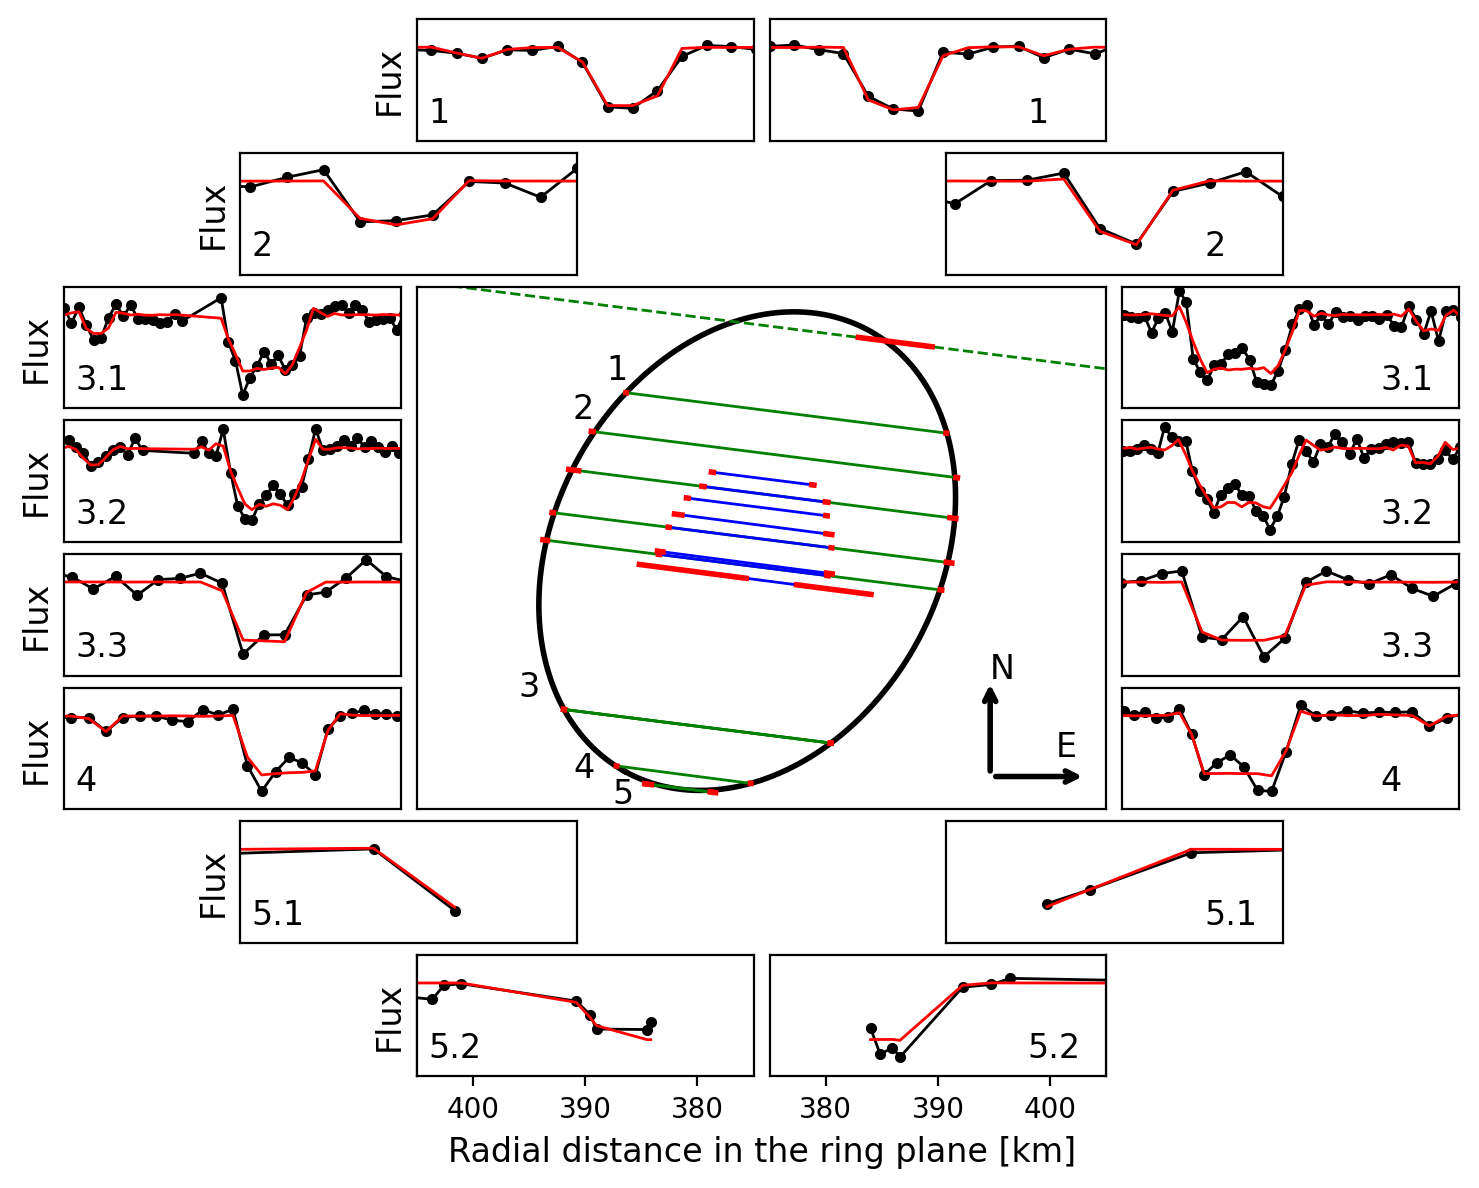
Figure 1: Results of the 2017-07-23 event. The central plot displays the occulting chords projected in the sky-plane for the main body (in blue), C1R (in green), and their uncertainties (red segments). The black line is the best-fitting ellipse to the C1R point. The side panels display the normalised radial ring profiles, projected in the ring-plane, numbered as follows: VLT at Cerro Paranal (1), Tolar Grande (2), La Silla (3), Observat\'orio Pico dos Dias (4) and Cerro Tololo (5). The observations on La Silla were made using the Danish telescope dual experiment in the Visual (3.1) and Red bands (3.2) and a 1-meter telescope (3.3). The observations on Cerro Tololo were grazing over C1R and they were made using the SARA (5.1) and PROMPT (5.2). We call attention to the unambiguous detection of W-shaped structures within the C1R.
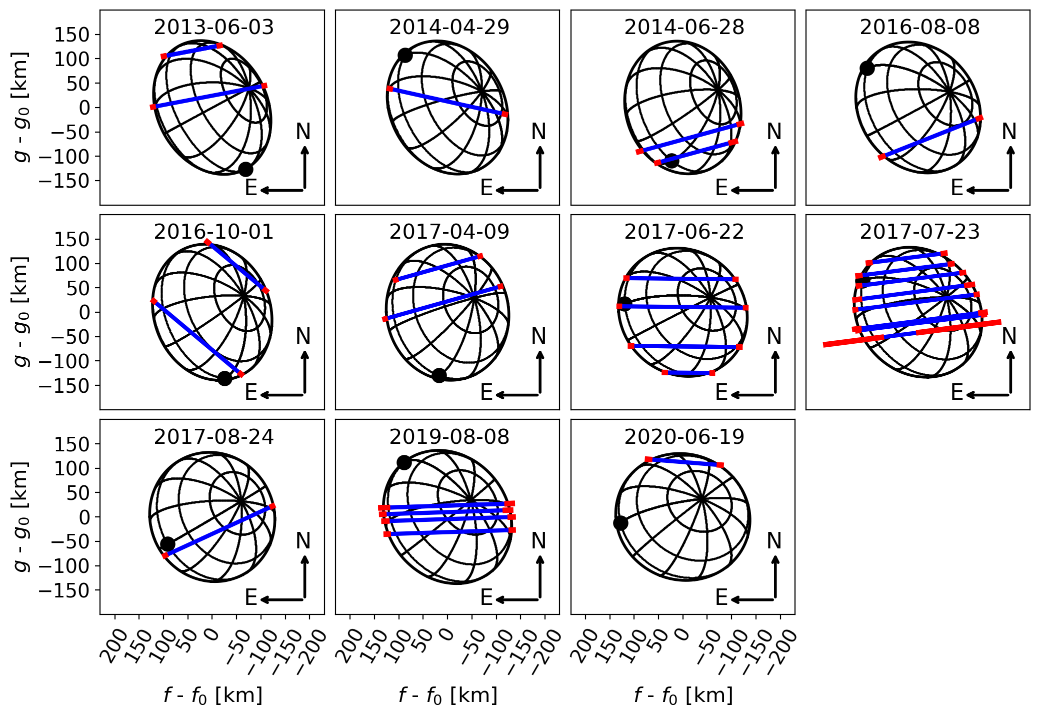
Figure 2: Ellipsoidal model that best fits the 11 stellar occultations observed between 2013-06-23 and 2020-06-19. Each panel corresponds to an occultation event identified by the time stamp in the upper part of each one. The blue lines stand for the observed chords with their uncertainties in red. The black dot indicates the intersection between the equator and the prime meridian, which is used as the reference to define the rotation angle.
References:
Benedetti-Rossi G. et al., 2019, The Astronomical Journal, 158, 159.
Bérard D. et al., 2017 Astronomical Journal, 154, 144.
Braga-Ribas F. et al., 2014, Nature, 508, 72.
Braga-Ribas F. et al., 2019, Journal of Physics: Conference Series, 1365, 012024.
Dias-Oliveira A. et al., 2015, The Astronomical Journal, 154, 22.
Dias-Oliveira A. et al., 2017, Astronomical Journal, 811, 53.
Gaia Collaboration et a., 2018, Astronomy and Astrophysics, 616, A1.
Leiva R. et al., 2017 Astronomical Journal, 154, 159.
Lellouch et al., 2017, Astronomy and Astrophysics, 608, A45.
Ortiz J. L. et al., 2017, Nature, 550, 219.
Santos-Sanz et al., 2021, MNRAS, 501 (4), 6062.
Sekiguchi et al., 2012, Asteroids, Comets, Meteors, 1667, 6477.
Acknowledgements:
This work was carried out within the “Lucky Star" umbrella that agglomerates the efforts of the Paris, Granada and Rio teams, which is funded by the European Research Council under the European Community’s H2020 (ERC Grant Agreement No. 669416). This research made use of \textsc{sora}, a python package for stellar occultations reduction and analysis, developed with the support of ERC Lucky Star and LIneA/Brazil, within the collaboration Rio-Paris-Granada teams. This work has made use of data from the European Space Agency (ESA) mission Gaia (\url{https://www.cosmos.esa.int/gaia}), processed by the Gaia Data Processing and Analysis Consortium (DPAC, https://www.cosmos.esa.int/web/gaia/dpac/consortium). The following authors acknowledge the respective CNPq grants: BEM 150612/2020-6; FB-R 314772/2020-0; RV-M 304544/2017-f5, 401903/2016-8; JIBC 308150/2016-3 and 305917/2019-6; MA 427700/2018-3, 310683/2017-3, 473002/2013-2. GBR acknowledges CAPES-FAPERJ/PAPDRJ grant E26/203.173/2016 and CAPES-PRINT/UNESP grant 88887.571156/2020-00, MA FAPERJ grant E-26/111.488/2013 and ARGJr FAPESP grant 2018/11239-8. J.L.O., P.S-S., R.D., and N.M. acknowledge financial support from the State Agency for Research of the Spanish MCIU through the ``Center of Excellence Severo Ochoa'' award to the Instituto de Astrofísica de Andalucía (SEV-2017-0709). P.S-S. acknowledges financial support by the Spanish grant AYA-RTI2018-098657-J-I00 ``LEO-SBNAF'' (MCIU/AEI/FEDER, UE).
How to cite: Morgado, B., Sicardy, B., Braga-Ribas, F., Desmars, J., and Gomes-Júnior, A. and the Luckystar team: The Centaur (10199) Chariklo and its ring system through stellar occultations., Europlanet Science Congress 2021, online, 13–24 Sep 2021, EPSC2021-435, https://doi.org/10.5194/epsc2021-435, 2021.
Within the outer Solar System exists the Kuiper belt. This Kuiper belt is made up of many icy planetesimals, the remaining relics of planet-forming bodies that failed to evolve into a planet beyond Neptune. The smaller members of the Kuiper belt (with r mag > 22) generally show linear and featureless spectra. Additionally, due to the dimness of these objects observing their spectra can be particularly difficult. Therefore, broadband photometry is often used to characterise their surfaces. The broadband photometry can be used as a proxy for composition, as it provides enough information to characterise the optical and near-infrared spectral slopes ofthese Kuiper Belt Object (KBO) surfaces.
The Colours of the Outer Solar System Origins Survey (Col-OSSOS, Schwamb et al., 2019) took near-simultaneous g-, r- and J-band broadband photometry of a sample of KBOs with unprecedented precision using the Gemini North telescope. As with previous colour surveys (e.g. Tegler et al., 2016), they showed abimodal colour distribution in optical / near-infrared colours for the dynamically ‘hot’ population. We split this colour distribution into the ‘neutral’ coloured population with (g−r) < 0.75 and the ‘red’ coloured populationwith (g−r) ≥ 0.75.
The preciseness of the colour measurements of Col-OSSOS has allowed the identification of several KBOs with outlying surface colours. These objects separated out from the rest of the neutral cloud in (g−r) versus (r−J) colours, with (g−r) colour near solar colour. Using the Gemini North telescope in Hawaii we have taken extra photometry in the i− and z−bands for three of these objects (2013 JE64, 2013 JR65 and 2014 UL225). These additional filter observations will allow us to identify any possible broadband absorption features on these object’s surfaces that may have caused their outlying surface colours. Asteroid interloper 2004 EW95 (Seccull et al., 2018), along with some Jupiter Trojans and C-type asteroids (Bus & Binzel, 2002; DeMeo & Carry,2013) have been shown to have similar near solar neutral surfaces. In this presentation we will report resultsof the griz photometry of 2013 JE64, 2013 JR65 and 2014 UL225. We will make comparisons between these results and the photometry of previously identified outlying KBOs and comment on any possible similarities.
References
Bus, S. J., & Binzel, R. P. 2002, Icarus, 158, 146
DeMeo, F. E., & Carry, B. 2013, Icarus, 226, 723
Schwamb, M. E., Bannister, M. T., Marsset, M., et al. 2019, ApJS, 243, 12
Seccull, T., Fraser, W. C., Puzia, T. H., Brown, M. E., & Schönebeck, F. 2018, ApJ, Letters, 855, L26
Tegler, S. C., Romanishin, W., Consolmagno, G. J., & J., S. 2016, AJ, 152, 210
How to cite: Buchanan, L., Schwamb, M., Fraser, W., Bannister, M., Marsset, M., Pike, R., Kavelaars, J., Benecchi, S., Lehner, M., Wang, S.-Y., Peixinho, N., Volk, K., Alexandersen, M., Chen, Y.-T., Gladman, B., Gwyn, S., and Petit, J.-M.: Col-OSSOS: Investigating Outlying Surfaces within the Kuiper Belt's Neutral Coloured Objects, Europlanet Science Congress 2021, online, 13–24 Sep 2021, EPSC2021-339, https://doi.org/10.5194/epsc2021-339, 2021.
Two stellar occultations by the largest satellite of the dwarf planet Haumea, Hi'iaka, were predicted to happen on April, 6th and 16th, 2021. Additional high accuracy astrometric analysis was carried out in order to refine the prediction for April 6th, using several telescopes in the 1.2-m to 2-m range, with the final shadow path crossing North Africa. We successfully detected the first event from TRAPPIST-North telescope at Oukaïmeden Observatory (Morocco). Although it was recorded from only one site, this first detection allowed us to improve the prediction for the second that crossed North America from East to West. We had a good success recording six positive detections and several negative detections that constrain the shape and size of the body. The light curves obtained from the different observatories provide the time at which the star disappears and reappears, which are translated into chords (the projected lines on the sky-plane as observed from each location). Additionally, we carried out a campaign to study Hi'iaka's rotational light-curve, studying the residuals of Haumea's rotational light-curve to a four-order Fourier fit. We obtained the rotational phases at the times of the occultations, which is critical for the analysis of the occultations, given that Hi’iaka is clearly non-spherical. Our preliminary results show that Hi'iaka indeed has a triaxial shape with a larger effective diameter than what has been published so far. The preliminary results and their implications will be discussed in this talk.
How to cite: Fernández-Valenzuela, E., Ortiz, J. L., Holler, B., Vara-Lubiano, M., Morales, N., Sicardy, B., Vachier, F., Desmars, J., Braga-Ribas, F., Rustamkulov, Z., de la Vega, A., Warner, E., Conti, D., Lecacheux, J., Francini, R., Langill, P., Morales, R., Jehin, E., Fraser, W. C., and Souami, D. and the Lucky Star and Hi'iaka's occultation Teams: The stellar occultations by the largest satellite of the dwarf planet Haumea, Hi'iaka, Europlanet Science Congress 2021, online, 13–24 Sep 2021, EPSC2021-609, https://doi.org/10.5194/epsc2021-609, 2021.
Trans-Neptunian Objects (TNOs) are small bodies that orbit the Sun with a semi-major axis larger than Neptune's4. They are thought to be remnants of the Solar System primordial disk and can retain information about the early stages of our planetary system's formation. Since the discovery of Albion3 in 1992, thousands of objects were detected in this orbital region, but only the Pluto system13 and (486958) Arrokoth14 has been visited so far by a spacecraft. Detailed topographic studies of Pluto and Charon6,7 presented superficial features of ~6 km while reprocessed Voyager images of Uranus' largest satellite - Oberon, show a mountain11 of ~11 km. Discovered15 in 2002 the big TNO 2002 MS4 is dynamically classified as a hot classical TNO. Thermal measurements made by Spitzer Space Telescope and Herschel Space Observatory, resulted an area equivalent diameter16 of 934 +/- 47 km and a geometric albedo at V-band of 0.051-0.022+0.036.
Stellar occultation is a ground-based method that has been presenting exciting advances in the knowledge of Centaurs' and TNOs' physical properties2,9,10,12 and rings1,8. We predicted and observed seven stellar occultations by 2002 MS4 between 2019 and 2021 under the European Research Council (ERC) Lucky Star project framework. The most successful one involved 116 telescopes from Europe, North Africa, and Western Asia on 8 August 2020.
Here we will present results about 2002 MS4 size, shape and topographic features. Stellar occultation data show an equivalent diameter of about 800 +/- 24 km. On the projected northern hemisphere, they are evidence of topographic features of about 20 km. Following the procedure described by Johnson and McGetchin in 1973, and assuming that 2002 MS4 is mainly composed of ice with densities between 1.0 - 2.0 g/cm3, this object supports surface features of about 7 km. However, if we consider that ice density increases toward the object's centre, then 2002 MS4 can support more prominent features. Figure 1 presents the projected profile detected on the 8 August 2020 stellar occultation.
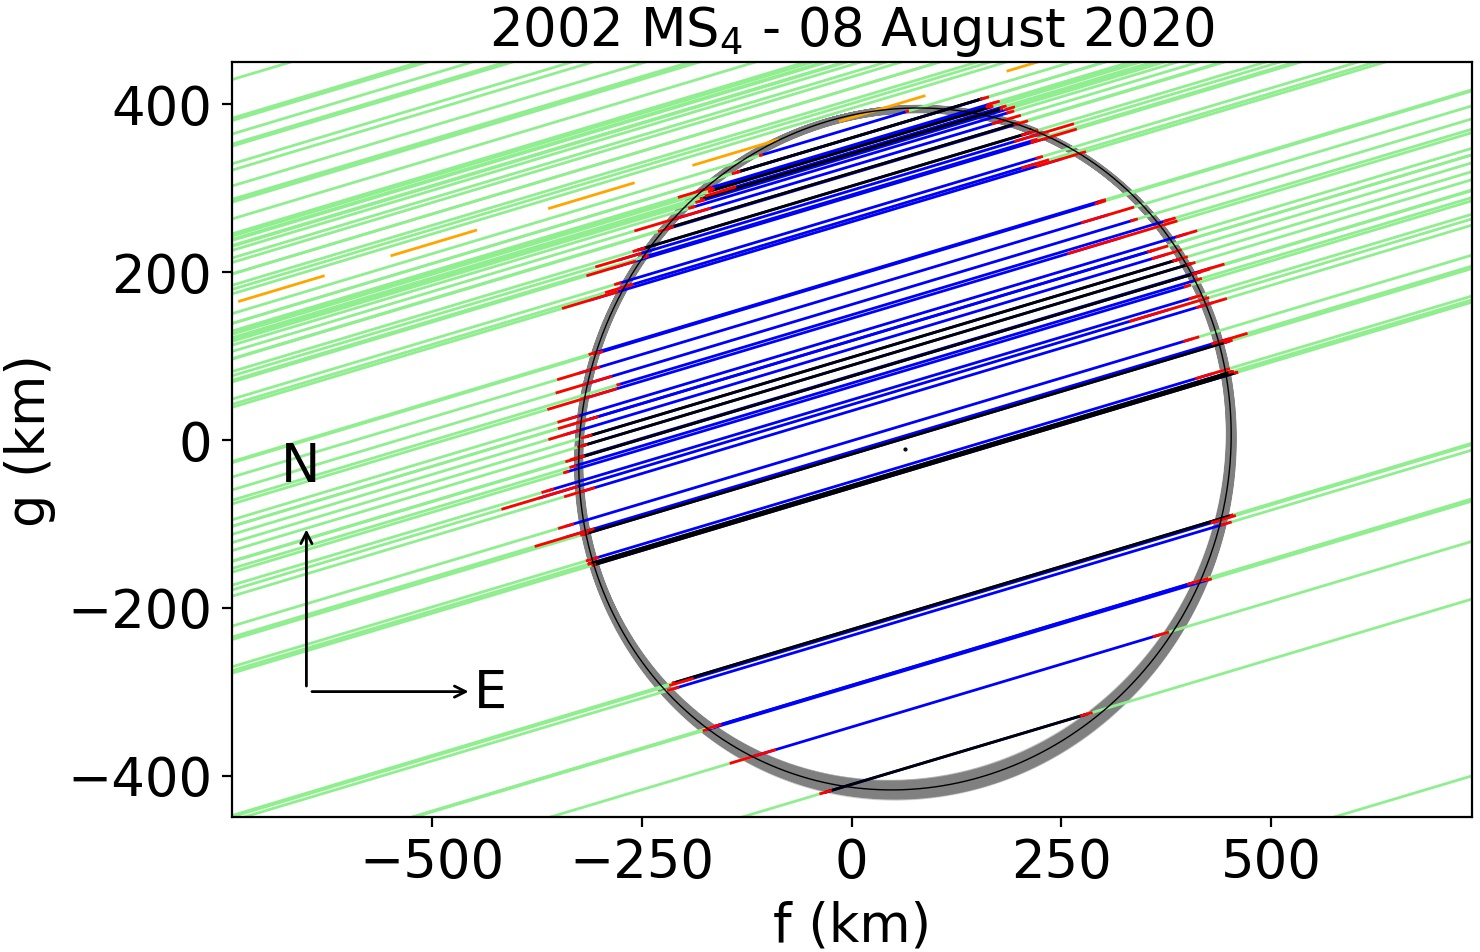
Figure 1: blue lines are the positive detections with uncertainties in red. Green segments present the surrounding region and in black is the best projected elliptical limb. Shaded region are the solutions inside the 3σ.
Next figure presents the radial dispersion of the observed points from the black ellipse as a position angle function. This angle is measured from the local North and increases toward the East (Figure 1). Shaded rectangles show the evidence of a mountain and a depression of about 20 km between 10 and 55 degrees.
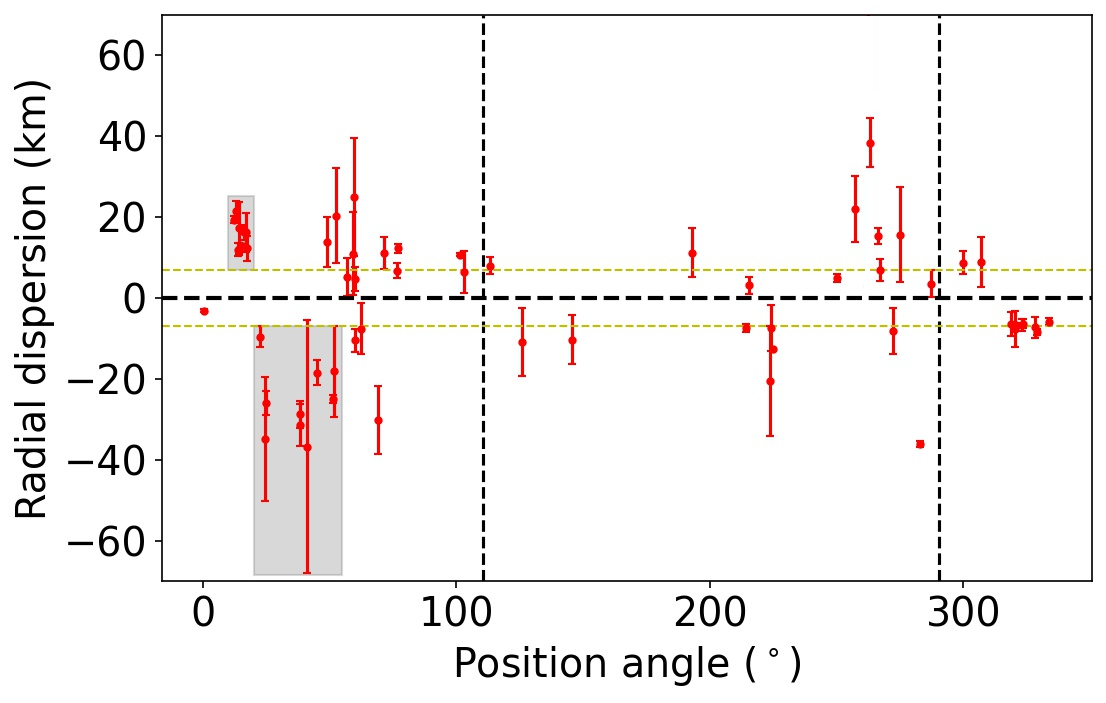
Figure 2: radial dispersion from better elliptical limb as a function of the position angle. Dashed green lines present the 7 km lower limit for global roughness. Shaded regions are evidence of the mountain and the depression.
Additionally, the northernmost grazing light curve at 2002 MS4 acquired from Varages observatory in France presents a direct detection of a minor surface feature. Note that, in figure 3, the star partially appears before the reappearance, probably due to a depression or a local mountain.
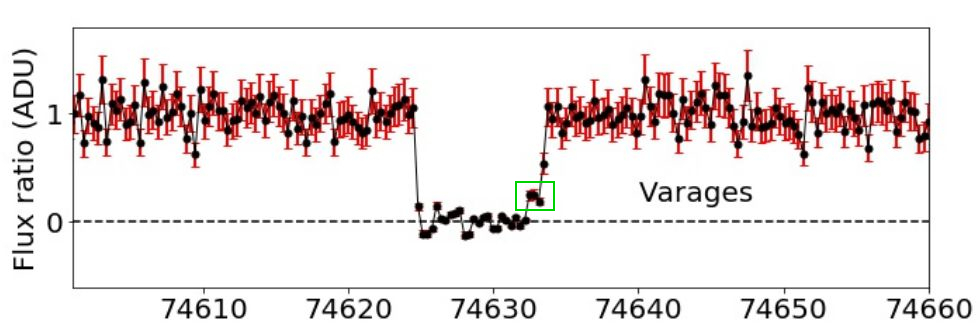
Figure 3: normalized star flux as a function of time as seen by Varages observatory. The 3 intermediate points before emersion are inside the green rectangle.
Acknowledgements: F.L.R is thankful for the support of the CAPES scholarship. The following authors acknowledge the respective CNPq grants: F.B-R 309578/2017-5; R.V-M 304544/2017-5, 401903/2016-8; J.I.B.C. 308150/2016-3; M.A 427700/2018-3, 310683/2017-3, 473002/2013-2. This study was financed in part by the Coordenação de Aperfeiçoamento de Pessoal de Nível Superior - Brasil (CAPES) - Finance Code 001 and the National Institute of Science and Technology of the e-Universe project (INCT do e-Universo, CNPq grant 465376/2014-2). G.B-R acknowledges CAPES-FAPERJ/PAPDRJ grant E26/203.173/2016, M.A FAPERJ grant E-26/111.488/2013 and A.R.G-Jr FAPESP grant 2018/11239-8. B.E.M thanks the CAPES/Cofecub-394/2016-05 grant. P.S-S. acknowledges financial support by the Spanish grant AYA-RTI2018-098657-J-I00 "LEO-SBNAF" (MCIU/AEI/FEDER, UE). We would like to acknowledge financial support from the State Agency for Research of the Spanish MCIU through the “Center of Excellence Severo Ochoa” award for the Instituto de Astrofı́sica de Andalucı́a (SEV-2017-0709) and the financial support by the Spanish grant AYA-2017-84637-R. Part of the results were based on observations taken at the 1.6 m telescope on Pico dos Dias Observatory of the National Laboratory of Astrophysics (LNA/Brazil). Part of this work was carried out within the “Lucky Star" umbrella that aggregates the efforts of the Paris, Granada and Rio teams. It is funded by the European Research Council under the European Community’s H2020 (2014-2021/ERC Grant Agreement No. 669416). This work has made use of data from the European Space Agency (ESA) mission Gaia (https://www.cosmos.esa.int/gaia), processed by the Gaia Data Processing and Analysis Consortium (DPAC, https://www.cosmos.esa.int/web/gaia/dpac/consortium). Funding for the DPAC has been provided by national institutions, in particular the institutions participating in the Gaia Multilateral Agreement.
References
1Braga-Ribas, F., Sicardy, B., Ortiz, J. L., et al.: 2014, Nature, 508, 72.
2Dias-Oliveira, A., Sicardy, B., Ortiz, J. L.,et al.: 2017, The Astronomical Journal, 154, 22.
3Jewitt, D., and Luu, J.: 1993, Nature, 362, 730.
4Jewitt, D., Morbidelli, A., and Rauer, H.: 2008, Saas-Fee Advanced Course 35: Trans-Neptunian Objects and Comets.
5Johnson, T. V. and McGetchin, T.R. 1973, Icarus, 18, 612.
6Moore, J. M., McKinnon, W.B., et al.: 2016, Science, 351, 1284.
7Nimmo, F., Umurhan, et al. 2017, Icarus, 287, 12.
8Ortiz, J. L., Santos-Sanz, P., Sicardy, B., et al.: 2017, Nature, 550, 219.
9Ortiz, J.L., Santos-Sanz, P., Sicardy, B., et al.: 2020, Astronomy and Astrophysics, 639, A134.
10Santos-Sanz, P., Ortiz, J. L., Sicardy, B., et al.: 2021, Monthly Notices of the Royal Astronomical Society, 501.
11Schenk, P. M. and Moore, J. M.: 2020, Philosophical Transactions of the Royal Society of London Series, A378.
12Sicardy, B., Ortiz, J. L., Assafin, M., et al.: 2011, Nature, 478, 493.
13Stern, S. A., Bagenal, F., Ennico, K. et al.: 2015, Science, 350, aad1815.
14Stern, S. A., Weaver, H. A., Spencer, J. R., et al.: 2019, Science, 364, aaw9771.
15Trujillo, C. A., Brown, M. E., Minor Planet Electronic Circulars – MPEC 2002-W27.
16Vilenius, E., Kiss, C., Mommert, M., et al.: 2012, Astronomy and Astrophysics, 541, A94.
How to cite: Rommel, F. L., Braga-Ribas, F., Vara-Lubiano, M., Ortiz, J. L., Desmars, J., Morgado, B. E., Benedetti-Rossi, G., Sicardy, B., Vieira-Martins, R., Camargo, J. I. B., Santos-Sanz, P., Morales, N., Duffard, R., Fernández-Valenzuela, E., Margoti, G., Assafin, M., Pereira, C. L., Kilic, Y., Frappa, E., and Lecacheux, J. and the co-authors: Evidence of topographic features on (307261) 2002 MS4 surface, Europlanet Science Congress 2021, online, 13–24 Sep 2021, EPSC2021-440, https://doi.org/10.5194/epsc2021-440, 2021.
Centaurs and Scattered disk objects (SDOs) are believed to be the main source populations of Jupiter-Family comets (JFCs). Despite being essential for understanding cometary evolution, due to their large heliocentric distances these two populations are among the least studied in the Solar System. One interesting aspect that remains relatively under-examined is the comparison between the surface properties of Centaurs, SDOs and JFCs. While the colors/spectral slopes of these populations have been the subject of numerous works (see [1,2]), their phase functions remain largely unexplored, last reviewed over a decade ago [3]. In this work we focus on characterizing the shapes of Centaur and SDO phase functions (linear slope and the presence of an opposition surge), as well as on comparing their phase-coefficient—albedo relationship to that of JFCs.
We obtained relatively sparse photometry of two objects - Centaur (281371) 2008 FC76 and SDO (44594) 1999 OX3, in order to improve their phase functions, albedos and rotational light curves. We followed the two targets using VLT/FORS2, NTT/EFOSC and LT/IO:O between December 2019 and January 2021. The photometric data were calibrated using Pan-STARRS field stars and combined to derive the rotational light curves, phase functions and albedos following the methods described in [4,5]. The new rotation periods and light curve amplitudes agree with the results previously published for 2008 FC76 [6] and 1999 OX3 [7]. However, the phase functions we determined are less steep than the estimates for 2008 FC76 (β = 0.09 ± 0.02 mag/deg [8]) and for 1999 OX3 (β= 0.30 $± 0.03 [7]). Using the new linear phase coefficients we also derived the absolute magnitude of the two targets and updated their geometric albedos using their diameters [9].
We added these two objects to the sample of twelve other inactive Centaurs and SDOs with well-constrained albedos and phase functions. In earlier work, we identified a correlation of increasing albedo for increasing phase coefficients using ground-based and spacecraft observations of 14 JFCs [4,5]. This was interpreted as an evolutionary path of JFCs according to which dynamically young JFCs start their evolution with relatively large albedos and steeper phase functions. Then, during their lifetimes, sublimation-driven erosion gradually makes the comets' surfaces smoother, and their phase-function slopes and albedos decrease.
The database of 14 Centaurs and TNOs allows us to test whether the outer solar system progenitors of JFCs support this interpretation and have predominantly larger albedos and steeper phase functions. As it can be seen in Fig. 1., the majority of the Centaurs and SDOs follow the phase-function—albedo correlation of JFCs. However, some of the objects with geometric albedo ~5% have larger phase coefficients than comets with similar albedos. This can be attributed to the observation that all of the phase coefficients from this group were derived for narrow ranges of small phase angles (0.5-3.5° (Fig. 2.), which suggests that these observations probe the phase functions’ opposition surge. Additionally, in order to test the hypothesis that the evident phase-function albedo correlation represents the surface evolution of objects subjected to increasing solar insolation, we complement our analysis with numerical simulations to constrain the dynamical history of these objects.
In addition to the insights on the surface properties of Centaurs and SDOs and their relationship to JFCs, this work provides findings that can serve as a foundation for future phase-function studies (e.g. the Vera Rubin Observatory’s Legacy Survey of Space and Time; LSST). Improving our understanding of the phase function shapes of different populations is essential for eliminating the possible biases in extracting the objects’ absolute magnitudes from sparse photometric datasets.
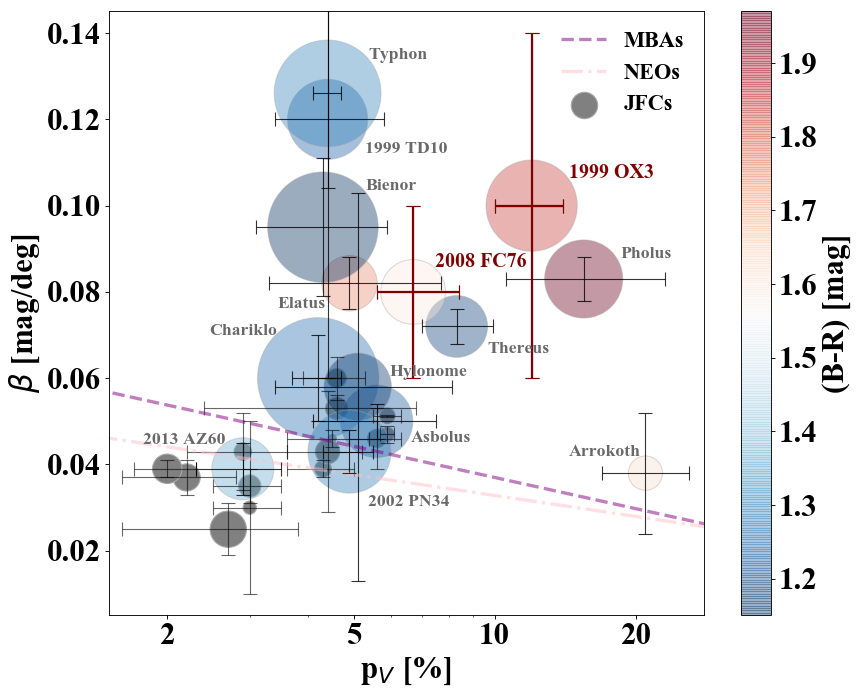
Fig.1. Linear phase function coefficient against geometric albedo in V-band for JFCs (in gray) and Centaurs/SDOs (in color). The size of the symbols corresponds to the relative size of the objects. The color of the Centaurs and SDOs correspond to their (B-R) color index. The purple dashed line shows the phase-coefficient—albedo correlation for Main Belt asteroids [10] and the pink dash-dotted line represents the correlation found for Near-Earth asteroids [11]. The Cold Classical Arrokoth whose linear phase coefficient was derived in the range 1.3° - 32.5° during the New Horizons flyby [12] is added for comparison.
Fig. 2. Phase angle range used for the derivation of the phase coefficients of the Centaurs and SDOs.
References:
[1] Peixinho, N. et al. (2020), The Trans-Neptunian Solar System, 307
[2] Jewitt, D. (2015), AJ, 150(6), 201
[3] Belskaya, I. et al. (2008), The Solar System Beyond Neptune, 115
[4] Kokotanekova, R. et al. (2017), MNRAS, 471, 2974
[5] Kokotanekova, R. et al. (2018), MNRAS 479, 4665
[6] Hromakina, T. et al. (2017), MNRAS, 474, 2, 2536.
[7] Thirouin, A. et al. (2014), A&A, 569, A3.
[8] Perna, D., et al. (2013), A&A, 554, A49.
[9] Müller, T. et al. (2020), The Trans-Neptunian Solar System, 153
[10] Belskaya, I. N., & Shevchenko, V. G. (2000), Icarus, 147, 94
[11] Hergenrother, C. et al. (2013), Icarus, 226, 1, 663
[12] Stern, A. et al. (2019), Science, 364(6441).
How to cite: Kokotanekova, R., Snodgrass, C., Donaldson, A., Lacerda, P., and Opitom, C.: Phase Functions and Rotational Light Curves of Centaur (281371) 2008 FC76 and Scattered Disk Object (44594) 1999 OX3, Europlanet Science Congress 2021, online, 13–24 Sep 2021, EPSC2021-668, https://doi.org/10.5194/epsc2021-668, 2021.
The phase curve of a small Solar System object measures its change in brightness at different phase angles relative to incident sunlight, and is a complex function of the surface properties of that object. Analysing phase curves of small Outer Solar System Objects (OSSOs) not only allows accurate absolute magnitude measurements, but can probe the composition, surface topography, and sizes of regoliths of these objects’ surfaces. This opens up another method of detecting possible correlations with other compositional and dynamical properties across different populations of these objects, which could shed light on possible evolutionary connections between them.
Several observation programs of OSSOs have observed the phase curves of many Kuiper-belt objects (KBOs) and Centaurs (Rabinowitz et al., 2007; Schaefer et al., 2009; Alvarez-Candal et al., 2016; Ayala-Loera et al., 2018; Alvarez-Candal et al., 2019; Verbiscer et al., 2019). However, limited availability of telescope observation time, the large baseline of observations required, coupled with the challenges of ground-based observing (bouts of poor weather, and the limited observability of targets throughout the year) combine to make obtaining photometry of these objects across a wide range of phase angles difficult. Additionally, the large heliocentric distances of these objects typically restricts Earth-based observations to very small phase angles, < 2◦ for KBOs. Many studies make use of photometry obtained from different datasets. This additional data is often obtained with heterogeneous processing and analysis methods, leaving open the possibility of systematic errors in the resultant phase curve. Furthermore, several Centaurs have been known to exhibit brightening due to cometary activity, which would significantly alter an observed phase curve from its true profile, and may be difficult to identify from the light curve if large time-intervals exist between photometric measurements. However, multi-filter broad- band photometry of bright Centaurs and KBOs across a long, continuous observation baseline has been made available by the Asteroid Terrestrial-impact Last Alert System (ATLAS) survey (Tonry et al., 2018a,b), and offers an opportunity to study the phase curves of these objects populated with large numbers of observations.
The ATLAS survey has been in continuous operation since its installation in 2015. Using two 0.5-m Schmidt telescopes located at Haleakalā and Mauna Loa, Hawai’i, it regularly observes the sky outside of ∼ 60◦ of the Sun, down to a limiting magnitude of ∼19.7 across declinations +90◦ ≤ δ ≤ −50◦, in two visible-region broadband filters - ’cyan’ (’c’, of wavelength range 420-650 nm) and ’orange’ (’o’, of wavelength range 560-820 nm). Fields are observed with a cadence of 2 nights, with four exposures taken per frame of observation over an interval of 1 hour (Tonry et al., 2018a). Throughout its search to detect dangerous near-Earth asteroids, it has accumulated photometry for a sample of bright KBOs and Centaurs over a long, continuous observation baseline. This allows the analysis of the phase curves of these objects in two colour filters, with a dataset sufficiently large as to preclude the need for including additional data from potentially heterogeneous sources, thus helping to circumvent possible systematic errors.
Our sample of ~20 bright small OSSOs visible to the ATLAS survey telescopes comprises 12 Centaurs and 8 KBOs, spanning semimajor axes of 5.7 au ≤ a ≤ 189.7 au. These objects span approximate absolute magnitudes of −1.1HV13.6, and span apparent magnitudes 14.5c 19.5 and 14.2o19.2, averaged across the observation baseline of ATLAS. The phase curve in a given filter of each object in the sample contains on average 331 data points, exceeding the values of previous studies (Rabinowitz et al., 2007; Schaefer et al., 2009; Alvarez-Candal et al., 2016; Ayala-Loera et al., 2018; Alvarez-Candal et al., 2019), and covers the majority of the maximum range of phase angles observable from Earth during the observation baseline of ATLAS. Example phase curves for the bright Centaur (2060) Chiron using photometry from ATLAS is shown in Figure 1.
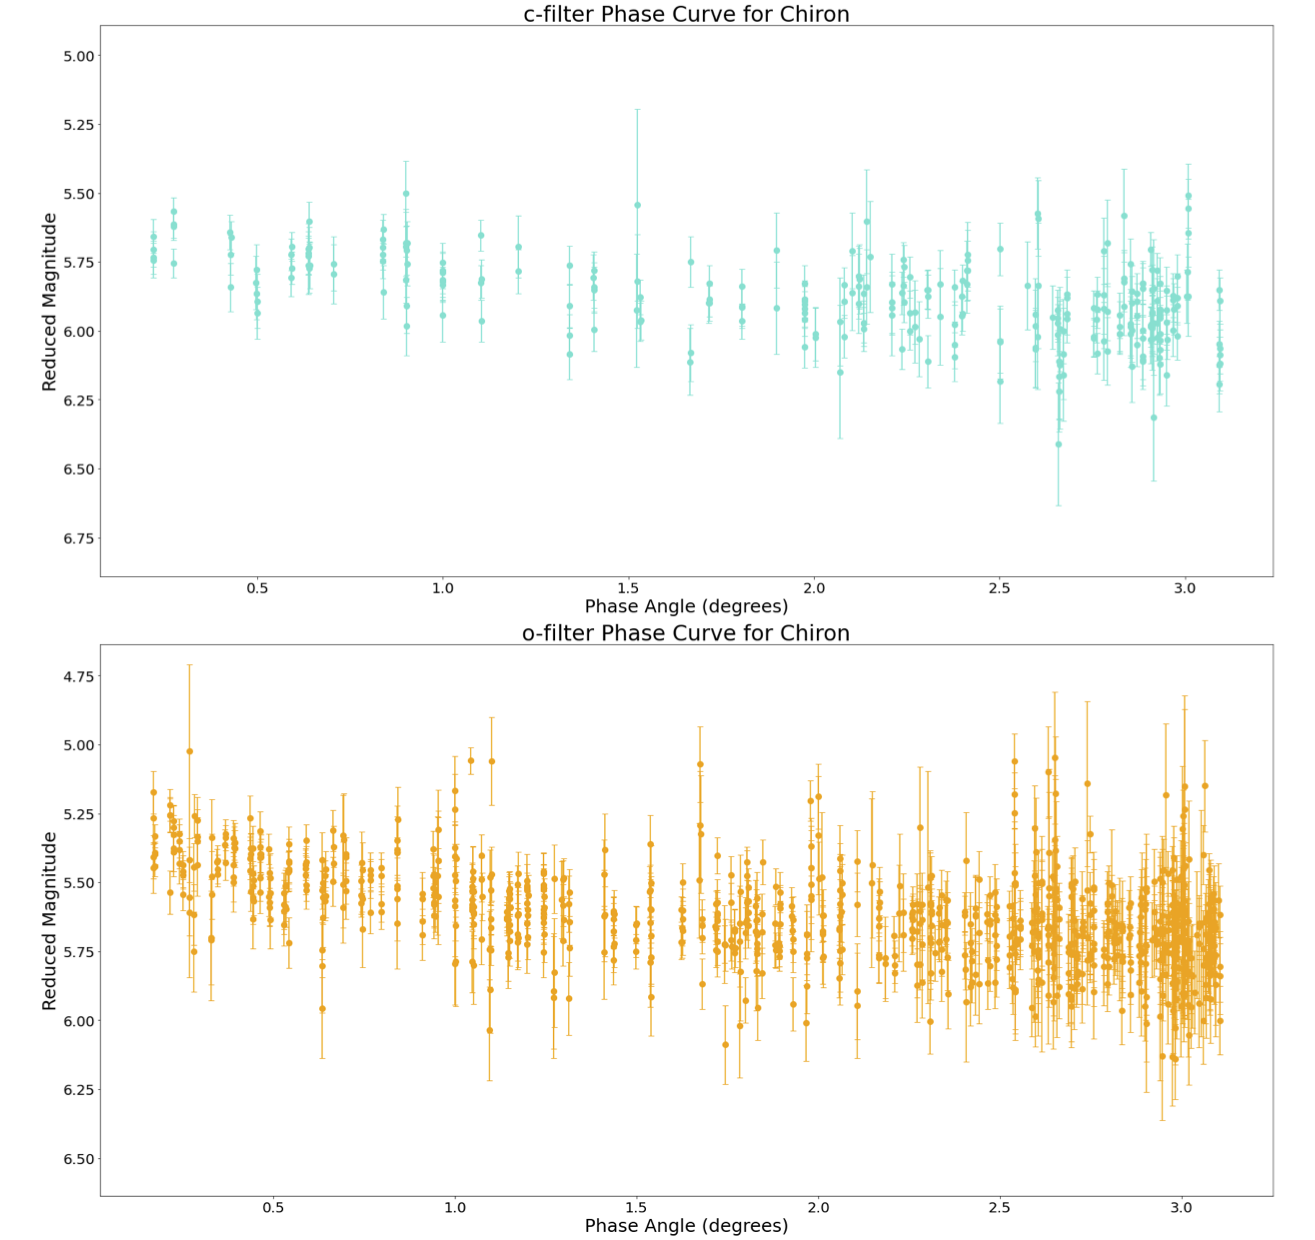
Figure 1: Phase curve of Centaur (2060) Chiron using ATLAS photometry in cyan (’c’) filter (upper, 281 measurements) and orange (’o’) filter (lower, 997 measurements). Light curve corrections to the phase curves have not been made.
By analysing the phase curves of this sample of Centaurs and KBOs, we can explore their surface properties of these objects based on a large dataset of photometric observations. We will search for correlations between the derived phase curve parameters and other object properties e.g. a dependency of phase coefficients on object colour. We will present our ATLAS sample of phase curves and compare our findings to those from past literature.
2 Acknowledgements
We made use of the ATLAS Forced Photometry Server to obtain our Centaur and KBO photometry. https://fallingstar-data.com/forcedphot/
This work has made use of data from the Asteroid Terrestrial-impact Last Alert System (AT- LAS) project. ATLAS is primarily funded to search for near earth asteroids through NASA grants NN12AR55G, 80NSSC18K0284, and 80NSSC18K1575; byproducts of the NEO search include images and catalogs from the survey area. The ATLAS science products have been made possible through the contributions of the University of Hawaii Institute for Astronomy, the Queen’s University Belfast, the Space Telescope Science Institute, the South African Astro- nomical Observatory (SAAO), and the Millennium Institute of Astrophysics (MAS), Chile.
References
Alvarez-Candal, A., Ayala-Loera, C., Gil-Hutton, R., et al. 2019, MNRAS, 488, 3035, doi: http://doi.org/10.1093/mnras/stz188010.1093/mnras/stz1880
Alvarez-Candal, A., Pinilla-Alonso, N., Ortiz, J. L., et al. 2016, A&A, 586, A155, doi: http://doi.org/10.1051/0004-6361/20152716110.1051/0004-6361/201527161
Ayala-Loera, C., Alvarez-Candal, A., Ortiz, J. L., et al. 2018, MNRAS, 481, 1848, doi: http://doi.org/10.1093/mnras/sty236310.1093/mnras/sty2363
Rabinowitz, D. L., Schaefer, B. E., & Tourtellotte, S. W. 2007, AJ, 133, 26, doi: http://doi.org/10.1086/50893110.1086/508931
Schaefer, B. E., Rabinowitz, D. L., & Tourtellotte, S. W. 2009, AJ, 137, 129, doi: http://doi.org/10.1088/0004-6256/137/1/12910.1088/0004-6256/137/1/129
Tonry, J. L., Denneau, L., Heinze, A. N., et al. 2018a, , 130, 064505, doi: http://doi.org/10.1088/1538-3873/aabadf10.1088/1538-3873/aabadf
Tonry, J. L., Denneau, L., Flewelling, H., et al. 2018b, ApJ, 867, 105, doi: http://doi.org/10.3847/1538-4357/aae38610.3847/1538-4357/aae386
Verbiscer, A. J., Porter, S., Benecchi, S. D., et al. 2019, AJ, 158, 123, doi: http://doi.org/10.3847/1538-3881/ab321110.3847/1538-3881/ab3211
How to cite: Dobson, M. and the The ATLAS Survey Team and Outer Solar System Phase Curves Collaboration: Centaur and Kuiper Belt Object Phase Curves from the Asteroid Terrestrial-impact Last Alert System Survey, Europlanet Science Congress 2021, online, 13–24 Sep 2021, EPSC2021-677, https://doi.org/10.5194/epsc2021-677, 2021.
Abstract
Centaurs and trans-Neptunian objects (TNOs) are considered to be the most pristine members of our solar system, beside Oort cloud objects.
The observation of stellar occultations by solar system objects is a powerful technique to directly measure their size and profile shapes with kilometer accuracy [e.g. 1, and references therein], to probe the environment of them with the possibility to reveal satellites and / or rings [e.g. 2, 3] and to detect or to constrain an atmosphere down to the nanobar level [e.g. 4]. Finally it provides a high-accuracy astrometric measurement, which can for example be used for improving the prediction of subsequent occultation events within short or mid-term time spans.
Here we report the observation of an occultation event of the star Gaia DR2 4111560308371475840 (G = 14.6 mag) by the TNO (119951) 2002 KX14 on May 26, 2020. The shadow was predicted to cross eastern Europe (Fig. 1) and the event was observed successfully by ten stations supplemented by another good dozen of stations which had a miss (no event detected).
2002 KX14 is a low-inclination (i ~ 0.4°), low-eccentricity (e ~ 0.04) cold classical TNO, orbiting the Sun at an average distance of a ~ 39 au. The radiometric diameter is given as 455 ± 27 km [5]. On April 26, 2012, an occultation by this object was observed with the 4.2-m William Herschel Telescope on La Palma (Spain) at high cadence. From this single-chord observation (with a chord length of 415 ± 1 km), combined with accurate astrometry at the time of occultation, an area-equivalent diameter of at least 365 (+30, -21) km was estimated [6]. The rotational period is yet unknown. The lightcurve amplitude is reported as Δm < 0.05 mag (from 3 nights, [7]).
The occultation was predicted within the Lucky Star project. 121 astrometric observations filed at the MPC plus 56 observations derived at observatories used by the LS collaboration, covering the time span 1984-2018, were used to derive the NIMAv7 [8] orbit solution, which was used for the occultation event search. As the event was suitable to be observed by smaller telescopes, the amateur community was informed via mail lists etc. Details of the prediction are given on the LS project website [9].
Ten stations recorded the occultation with apertures between 20 cm and 80 cm. Five of them used analogue video technique for the recording, and five applied CCD cameras. 14 stations reported a non-detection of the occultation event within their observing windows (Fig. 1).
By applying the method described in [10], we fitted the extremities of the positive chords to an ellipse to derive the instantaneous limb of 2002 KX14. From the five fit parameters (center of the ellipse, semi-major and semi-minor axis and the position angle of the semi-minor axis) we derived the size and shape of the 2D limb as well as a high-accurate astrometric position for the time of occultation. Photometric observations to derive the light curve amplitude and the rotational period, with the aim to put constraints on the albedo as well as on the 3D size and the shape of 2002 KX14 are planned.
Acknowledgements
We acknowledge financial support from the State Agency for Research of the Spanish MCIU through the "Center of Excellence Severo Ochoa" award to the Instituto de Astrofísica de Andalucía (SEV-2017-0709) and the financial support by the Spanish grant AYA-2017-84637-R. M.V-L. acknowledges funding from Spanish project AYA2017-89637-R (FEDER/MICINN). P.S-S. acknowledges financial support by the Spanish grant AYA-RTI2018-098657-J-I00 "LEO-SBNAF" (MCIU/AEI/FEDER, UE). This campaign was carried out within the “Lucky Star" umbrella that agglomerates the efforts of the Paris, Granada and Rio teams. It is funded by the European Research Council under the European Community’s H2020 programme (2014-2020/ERC Grant Agreement No. 669416). This work has made use of data from the European Space Agency (ESA) mission Gaia (https://www.cosmos.esa.int/gaia), processed by the Gaia Data Processing and Analysis Consortium (DPAC, https://www.cosmos.esa.int/web/gaia/dpac/consortium). Funding for the DPAC has been provided by national institutions, in particular the institutions participating in the Gaia Multilateral Agreement.
References
[1] Souami, D., et al. 2020, A&A, 643, A125
[2] Braga-Ribas, F., et al. 2014, Nature, 508, 72
[3] Ortiz, J. L., et al. 2017, Nature, 550, 219
[4] Sicardy, B., et al. 2011, Nature, 478, 493
[5] Vilenius, E., et al. 2012, A&A 541, A94
[6] Alvarez-Candal, A., et al. 2014, A&A 571, A48
[7] Benecchi, S. D., et al. 2013, AJ 145, 124
[8] Desmars, J., et al. 2015, A&A, 584, A96
[9] https://lesia.obspm.fr/lucky-star/occ.php?p=39276
[10] Szpak, Z. L., et al. 2015, Journal of Mathematical Imaging and Vision 52, 173
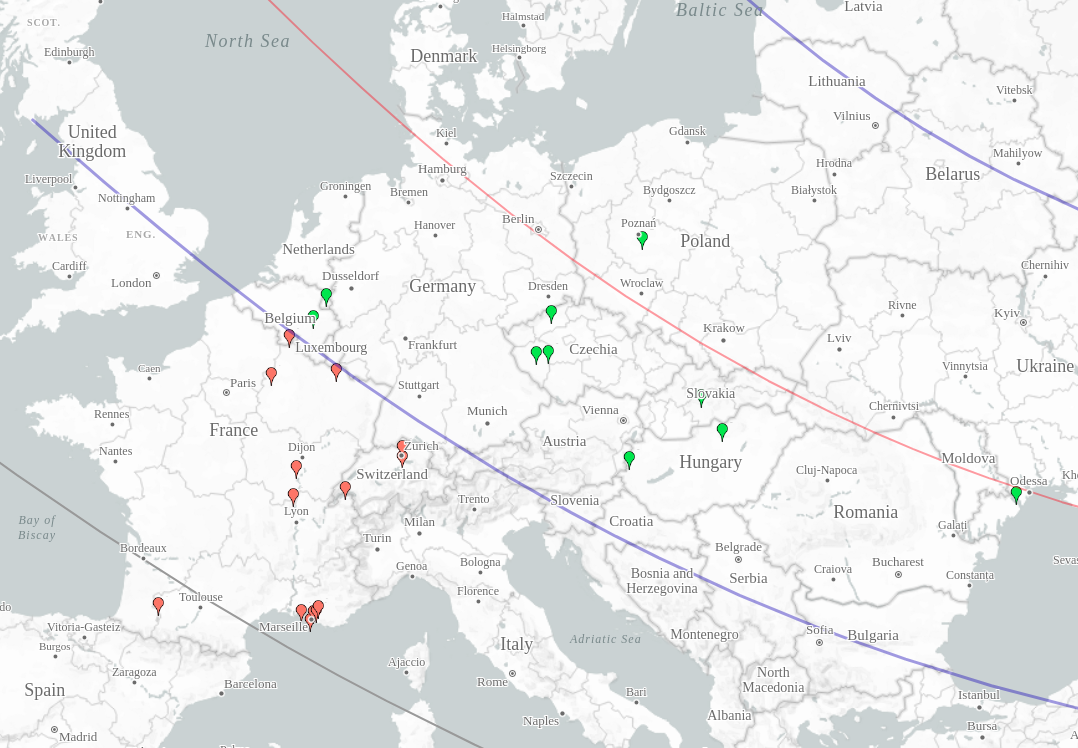
Figure 1 – The map shows the nominal Lucky Star prediction (NIMAv7) together with the location of the observation sites. The centre line of the shadow is given in red, the northern and southern shadow limits are given by the blue lines, based on an assumed mean diameter of 455 km. The southern 1-σ limit is marked by the grey line. The observation sites are represented by green markers (with positive occultation observation) and by red markers, were no occultation was detected.
How to cite: Kretlow, M., Ortiz, J. L., Sicardy, B., Desmars, J., Santos-Sanz, P., Morales, N., Braga-Ribas, F., Vara-Lubiano, M., Rommel, F. L., Souami, D., Duffard, R., Alvarez-Candal, A., Morgado, B., and Fernández-Valenzuela, E. and the 2002 KX14 occultation collaboration: The May 26, 2020 multi-chord stellar occultation by the trans-Neptunian object (119951) 2002 KX14, Europlanet Science Congress 2021, online, 13–24 Sep 2021, EPSC2021-520, https://doi.org/10.5194/epsc2021-520, 2021.
Physical properties of Trans-Neptunian Objects (TNOs) have been of increasing interest in the last two decades, as these objects are considered to be among the least altered through the Solar System evolution, and thus preserve valuable information about its origin [1]. The study of these objects through the ground-based method of stellar occultations has risen in the last years, as this technique allows the determination of physical properties with considerably good accuracies [2,3,4].
Here we present the results of the multi-chord stellar occultation of the GAIA source 3444789965847631104 (mv≈16.8) by the TNO (19521) Chaos on 2020 November 20, which was predicted within our systematic programme on stellar occultations by TNOs and outer solar system bodies [5]. The prediction was updated with astrometric observations carried out two days before the event with the 1.23-m telescope at Calar Alto observatory in Almería, Spain, and it was favorable to the South of Europe. The campaign that we organized involved 19 observing sites and resulted in three positive detections, one of them obtained from the 4.2-m WHT telescope at La Palma, 11 negative detections, and 5 sites that could not observe due to bad weather.
We derived the instantaneous limb of Chaos by fitting the extremities of the positive chords to an ellipse to determine accurate size, shape, and geometric albedo for this object. The preliminary results give a slightly smaller area-equivalent diameter than the one derived from Herschel thermal data [6], but photometric observations of this object are still under analysis to complement and improve the results.
References
[1] Morbidelli, A., Levison, H. F., & Gomes, R. 2008, ed. M. A. Barucci, H. Boehnhardt, D. P. Cruikshank, A. Morbidelli, R. Dotson, 275
[2] Ortiz, J. L., Sicardy, B., Braga-Ribas, F., et al. 2012, Nature, 491, 566
[3] Braga-Ribas, F., Sicardy, B., Ortiz, J. L., et al. 2013, ApJ, 773, 26
[4] Ortiz, J.L., Santos-Sanz, P., Sicardy, B., et al. 2017, Nature, 550, 7675, pp. 219-223
[5] Camargo, J. I. B., Vieira-Martins, R., Assafin, M., et al. 2014, A&A, 561, A37
[6] Vilenius, E., Kiss, C., Mommert, M., Müller, T., et al. 2012, A&A, 541, A94
Acknowledgements
We acknowledge financial support from the State Agency for Research of the Spanish MCIU through the "Center of Excellence Severo Ochoa" award to the Instituto de Astrofísica de Andalucía (SEV-2017-0709). Part of the research leading to these results has received funding from the European Research Council under the European Community’s H2020 (2014-2020/ERC Grant Agreement no. 669416 “LUCKY STAR”). M.V-L. acknowledges funding from Spanish project AYA2017-89637-R (FEDER/MICINN). P.S-S. acknowledges financial support by the Spanish grant AYA-RTI2018-098657-J-I00 ``LEO-SBNAF'' (MCIU/AEI/FEDER, UE). This work has made use of data from the European Space Agency (ESA) mission Gaia (https://www.cosmos.esa.int/gaia), processed by the Gaia Data Processing and Analysis Consortium (DPAC, https://www.cosmos.esa.int/web/gaia/dpac/consortium). We are grateful to the CAHA and OSN staffs. This research is partially based on observations collected at the Centro Astronómico Hispano Alemán (CAHA) at Calar Alto, operated jointly by Junta de Andalucía and Consejo Superior de Investigaciones Científicas (IAA-CSIC). This research was also partially based on observation carried out at the Observatorio de Sierra Nevada (OSN) operated by Instituto de Astrofísica de Andalucía (CSIC). Partially based on observations made with the Tx40 telescope at the Observatorio Astrofísico de Javalambre in Teruel, a Spanish Infraestructura Cientifico-Técnica Singular (ICTS) owned, managed and operated by the Centro de Estudios de Física del Cosmos de Aragón (CEFCA). Tx40 is funded with the Fondos de Inversiones de Teruel (FITE).
How to cite: Vara-Lubiano, M., Morales, N., Rommel, F., Ortiz, J. L., Sicardy, B., Santos-Sanz, P., Souami, D., Braga-Ribas, F., Skvarč, J., Jehin, E., Rodriguez-Alarcon, M., Licandro, J., Serra, M., Pallé, E., Parviainen, H., Vieira-Martins, R., Desmars, J., Duffard, R., Camargo, J., and Lecacheux, J. and the Chaos occultation team: The multi-chord stellar occultation by (19521) Chaos on 2020 November 20, Europlanet Science Congress 2021, online, 13–24 Sep 2021, EPSC2021-626, https://doi.org/10.5194/epsc2021-626, 2021.
Within the Lucky Star international collaboration* on stellar occultations by TNOs and other outer solar system bodies, we predicted the occultation by the TNO (143707) 2003 UY117 of an mV ~ 14.6 mag star on 23 October 2020. Around a week before the occultation date, we updated and refined the prediction using high precision astrometry obtained using the 2 m Liverpool telescope located at El Roque de Los Muchachos Observatory on La Palma, Spain. The update resulted in a shadow path with good observability potential. We carried out a specific campaign involving 27 observing sites in the south of Spain and North of Africa to observe the occultation. We recorded 4 positive detections and several very close misses to the south of the body. With this information we determined the silhouette of 2003 UY117 at the moment of the occultation. We also obtained the geometric albedo and the size for this object. In addition to this, we carried out several photometric runs with large telescopes to determine the rotation period and rotational phase at the time of the occultation. The body presents a clear double-peaked rotational light curve consistent with a triaxial ellipsoid of considerable elongation, which means that a rotational light curve analysis is critical to correctly interpret the occultation results. The preliminary analysis indicates a larger equivalent diameter than that determined from Herschel thermal data, although consistent within the large error bars of the thermal determination. We will present the preliminary results and discuss their implications.
*Lucky Star (LS) is an EU-funded research activity to obtain physical properties of distant Solar System objects using stellar occultations. LS collaboration agglomerates the efforts of the Paris, Granada, and Rio teams. https://lesia.obspm.fr/lucky-star/
Acknowledgements:
JLO, PS-S, NM, MV, and RD acknowledge financial support from the State Agency for Research of the Spanish MCIU through the ‘Center of Excellence Severo Ochoa’ award for the Instituto de Astrofísica de Andalucía (SEV-2017-0709), they also acknowledge the financial support by the Spanish grant AYA-2017-84637-R and AYARTI2018- 098657-J-I00 ‘LEO-SBNAF’ (MCIU/AEI/FEDER, UE).
How to cite: Ortiz, J. L., Santos-Sanz, P., Sicardy, B., Vara-Lubiano, M., Morales, N., Fernandez-Valenzuela, E., Braga-Ribas, F., Souami, D., Castro-Tirado, A., Fernández-García, E. J., Sota, A., Sánchez, M., de la Cueva, I., Maestre, J. L., Popescu, M., Guijarro, A., Jehin, E., Pozuelos, F. J., Licandro, J., and Rodriguez-Alarcon, M. and the 2003UY117 occultation team: A portrait of the Trans-Neptunian Object (143707) 2003 UY117 from a stellar occultation and photometry data., Europlanet Science Congress 2021, online, 13–24 Sep 2021, EPSC2021-463, https://doi.org/10.5194/epsc2021-463, 2021.
Trans-Neptunian Objects (TNOs) are thought to be among the least evolved Solar System objects, which retain information on the origin and evolution of the outer parts of it. They are located at far distances of the Sun, where the influence of our star is less dramatic than in the closer regions. Thus, these icy objects are extremely interesting bodies that hide plenty of information on the physical and dynamical processes that
shaped our Solar System.
We only know a few retrograde TNOs so far (e.g. 2008 KV42 [1], 2011 KT19 [2], 2004 XR190). One of the few known retrograde objects listed in the MPC database as a scattered disk object is 2013 LU28, which has a high orbital eccentricity (e = 0.95), a large semimajor axis (a= 181 AU) and a very high inclination (i = 125.4º). This exotic object is also classified as an “extended centaur”, because its perihelion at 8.7 AU moves it into the centaur region.
The physical properties of 2013 LU28, such as its rotational period and light curve amplitude, are unknown but can be revealed through photometry. With this aim, we observed this object during three observing runs on 2021 January and March using two telescopes, the 1.23 m telescope at Calar Alto Observatory in Almería, Spain and the 1.5 m telescope at Sierra Nevada Observatory in Granada, Spain. From these observations we derived the first determination of the rotational light curve of 2013LU28 from which we derived its rotational period and its peak-to-peak light curve amplitude. The obtained amplitude turned out to be higher than the average amplitude of most TNOs, which points toward an elongated or a binary object. Other magnitudes, such as its absolute magnitude (H) were also derived. We will present and discuss preliminary results on all the above.
Acknowledgements
The authors acknowledge financial support from the State Agency for Research of the Spanish MCIU through the "Center of Excellence Severo Ochoa" award to the Instituto de Astrofísica de Andalucía (SEV-2017-0709). P.S-S. acknowledges financial support by the Spanish grant AYA- RTI2018-098657-J-I00 "LEO-SBNAF" (MCIU/AEI/FEDER, UE). We are grateful to the CAHA and OSN staffs. This research is partially based on observations collected at the Centro Astronómico Hispano Alemán (CAHA) at Calar Alto, operated jointly by Junta de Andalucı́a and Consejo Superior de Investigaciones Cientı́ficas (IAA-CSIC). This research was also partially based on observation carried out at the Observatorio de Sierra Nevada (OSN) operated by Instituto de Astrofı́sica de Andalucı́a (CSIC).
Bibliography
[1] B. Gladman, J. Kavelaars, J.-M. Petit, M. L. N. Ashby, J. Parker, J. et al. ApJ 697:L91–L94, 2009
[2] Ying-Tung Chen , Hsing Wen Lin, Matthew J. Holman, Matthew J. Payne et al. ApJ 827:L24 (5pp), 2016
How to cite: Morales, N., Ortiz, J. L., Santos-Sanz, P., Vara, M., and Souami, D.: Rotational properties of the retrograde object (468861) 2013 LU28, Europlanet Science Congress 2021, online, 13–24 Sep 2021, EPSC2021-703, https://doi.org/10.5194/epsc2021-703, 2021.
Please decide on your access
Please use the buttons below to download the presentation materials or to visit the external website where the presentation is linked. Regarding the external link, please note that Copernicus Meetings cannot accept any liability for the content and the website you will visit.
Forward to presentation link
You are going to open an external link to the presentation as indicated by the authors. Copernicus Meetings cannot accept any liability for the content and the website you will visit.
We are sorry, but presentations are only available for users who registered for the conference. Thank you.
Please decide on your access
Please use the buttons below to download the presentation materials or to visit the external website where the presentation is linked. Regarding the external link, please note that Copernicus Meetings cannot accept any liability for the content and the website you will visit.
Forward to session asset
You are going to open an external link to the asset as indicated by the session. Copernicus Meetings cannot accept any liability for the content and the website you will visit.
We are sorry, but presentations are only available for users who registered for the conference. Thank you.

