Oral presentations and abstracts
Impact processes shaped the solar system and modify planetary surfaces until today. This session aims at understanding planetary impact processes at all scales in terms of shock metamorphism, dynamical aspects, geochemical consequences, environmental effects and biotic response, and cratering chronology. Naturally, advancing our understanding of impact phenomena requires a multidisciplinary approach, which includes (but it is not limited to) observations of craters, strewn field or airbursts, numerical modelling, laboratory experiments, geologic and structural mapping, remote sensing, petrographic analysis of impact products, and isotopic and elemental geochemistry analysis.
We welcome presentations across this broad range of study and particularly encourage work that bridges the gap between the investigative methods employed in studying planetary impact processes at all scales.
Session assets
Planetary collisions play an important role in the compositional and thermal evolution of the planetary system. The Moon-forming impact event is thought to be Earth’s last giant collision event, marking the end of the main accretion phase of the Earth. This large event (re)set the conditions for the subsequent thermochemical evolution of both bodies, Earth and Moon. Large parts of proto-Earth are thought to melt as a consequence of the impact and the extent of melting affects the evolution of the Earth’s interior and atmosphere. It is critical to address the initial conditions of the proto-Earth and the volume and shape of a possible magma ocean after the impact to understand the Earth’s subsequent evolution. To address these questions, we consider two different impact scenarios and present a benchmark study by comparing two different numerical codes. Further, we investigate the effect of strength on melt production for the two different impact scenarios. We compared results using the shock physics code iSALE [1,2], an Eulerian code with a fixed grid in space and a Langrangian mesh-free, so-called smoothed particle hydrodynamics code, (SPH [3]).
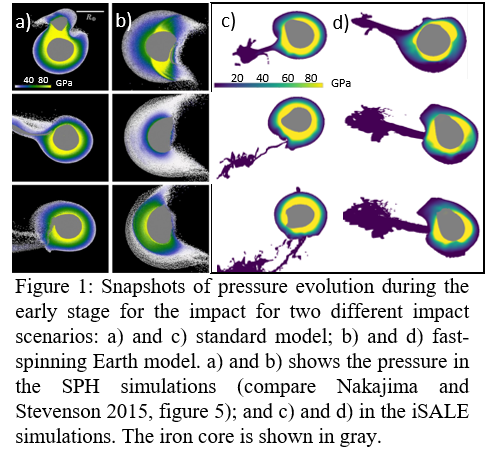
Therefore, we consider two different impact scenarios that are described in Nakajima and Stevenson (2015); the canonical model (i) (e.g., [4]) and a fast-spinning Earth model (ii) [5]. The former (i) assumes a Mars-size impactor colliding with proto-Earth at an impact angle of 41° (90° corresponds to head-on collision) at a velocity corresponding to the escape velocity of Earth. The colliding bodies are differentiated into a mantle and core. The latter (ii) case is characterized by a smaller impactor colliding with a rapidly rotating Earth at a steeper impact angle of 73° and a much higher impact velocity of 20 km/s. In iSALE the impactor and target mantle consist of dunite, the core of iron; both materials are represented by an Analytical Equation of state (ANEOS [6]), the SPH code uses an MgSiO3 liquid and ANEOS for forsterite and iron. In iSALE we neglect the core of the impactor as well as the initial spin of Earth. The pre-impact temperature of the colliding bodies is 2000 K and near the solidus. Nakajima and Stevenson (2015) only consider hydrodynamic behavior of the colliding bodies. In the iSALE models a constitutive model accounting for strength is included. Thus, in addition to a comparison of the two different codes, we investigate the effect of strength on melt production. The simulations of the two codes are compared in terms of thermodynamic parameters (pressure evolution, Figure 1) as well as melt production (Figure 2) after the moon-forming impact.
In Figure 1, a comparison of pressure evolution of both impact scenarios and the two numerical approaches is shown. In general, a good agreement in terms of pressure ranges for the two codes is observed. In the fast-spinning model a large fraction of mantle undergoes an extensive expansion and becomes subject to low pressure before some part falls back towards the core where it gains high pressures (Nakajima and Stevenson 2015). This process is not as prominent in the standard model. In the iSALE simulation we do not observe the fall back of the material although the post-impact state of Earth looks similar in both simulations.
The SPH simulations show that the majority of mantle experiences melting (between 80 and 100% mantle melting) pointing to the existence of a global magma ocean with a base close to the core-mantle boundary in both impact scenarios (Nakajima and Stevenson 2015).
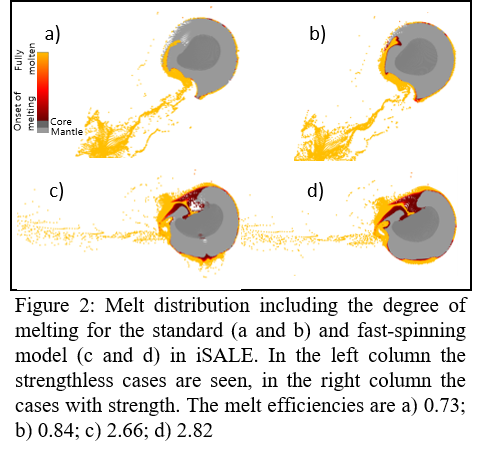
The melt production obtained by the iSALE simulation is at least for the standard impact scenario smaller. For the fast-spinning Earth model about 60% of mantle material are molten. Thus, for the standard model, we only observe partial mantle melting whereas for the fast-spinning model we can assume that a global magma ocean exists. However, we have to note that the iSALE simulations have not run as long as the SPH simulations yet and that with a longer run time melt production most likely increases. Neglecting an impactor core in iSALE will also underestimate melt production. The accretion of the core would increase melting.
Regarding the effect of strength, we observe a slight increase of melting when the colliding bodies exhibit some initial strength. However, the effect of the chosen impact scenario is much more significant as seen in Figure 2. The melt efficiency (melt volume normalized by the impactor volume) is over three times larger for the fast-spinning Earth model (2.66 corresponding to 60% of mantle volume) than for the standard model (0.73 corresponding to 20 % of mantle volume).
The presented benchmark study shows an overall good agreement of two numerical codes and indicates the significance of the chosen impact scenario with respect to melt production on Earth during the Moon-forming impact. However, the differences of the two numerical methods may also be caused by some differences in the setup (e.g. different EoS, spin of Earth, differentiated impactor).
In addition, in an ongoing study we systematically carry out simulations of the moon-forming impact event using iSALE. We vary the impact angle (15° to 60°) and impact velocities (12 to 20 km/s) and use different initial temperature profiles. First results show that with increasing impact angle as well as with increasing impact velocity, melt production increases. The effect of the pre-impact temperature becomes more prominent for increased impact angles.
How to cite: Güldemeister, N., Manske, L., Nakajima, M., and Wünnemann, K.: Numerical modelling of the thermal state of Earth after the Moon-forming impact event - A benchmark study, Europlanet Science Congress 2020, online, 21 Sep–9 Oct 2020, EPSC2020-217, https://doi.org/10.5194/epsc2020-217, 2020.
Introduction: A common outcome of a giant impact event is the formation of a circumplanetary debris disk, and in some cases, the capture of the surviving impactor, which results in a system composed of a primary, secondary, and a debris disk. The material in the debris disk may be accreted by the primary body (and secondary, if it exists), escape the system, or coalesce into larger clumps. A classic example of a system thought to originate by such an impact event is the Pluto-Charon binary system (Canup, 2005, 2011), in which all six bodies (including the other smaller satellites) lie approximately on the same plane and have nearly circular orbits.
Such impacts are simulated using smoothed particle hydrodynamics (SPH) codes including self gravity. The equation of state (EOS) governs the relationship among the thermodynamic variables of the simulated material. The specific EOS used in the simulation may influence the final post-impact structure. In order to quantify the typical differences, we compare two approaches, one simple analytic and one tabulated EOS. Tillotson (Tillotson, 1962) is a widely used analytic EOS and is computationally fast, but it lacks important details such as the treatment of phase changes. Sesame (Bennett et al., 1978) is a commonly used tabulated EOS and is more accurate, but is computationally slower and may be poorly sampled in the required thermodynamic phase-space. Here we show a set of SPH impact simulations that assume similar geometric and dynamic initial conditions but different EOS.
Methods: We performed ~100 SPH simulations using SWIFT code (Schaller et al., 2018), simulating Pluto-like impacts with 105-106 particles. The initial bodies are assumed to be differentiated, with target to impactor mass ratio of 1 or 7/3, impact angle, ξ, of 0, 30, 45, 60°. Impact velocity was chosen to be relatively small, 1-1.1 times the escape velocity. The impactor was either spin-less or rotating with a period of 5 or 10 hours. This parameter space was motivated by previous simulations (Canup, 2011) for the formation of the Pluto-Charon system. We compare results using the Tillotson and Sesame EOS. The simulations were stopped after 4 days, the typical time for the central body to relax to a stable spherical shape. We developed an algorithm to detect post-impact clumps. Two particles were considered in contact if their mutual distance was smaller than their combined smoothing lengths. The orbital elements of each clump (“satellitesimal”, defined as 100 particles in pairwise contact, equivalent to ~10-3Mpluto) were computed and studied.
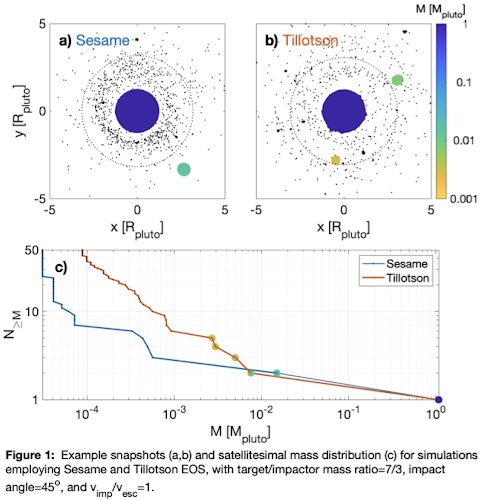
Results: Disk systems were formed for impact angles >30°, in using both EOSs. Satellitesimals, when formed, showed different properties. Figure 1 panels (a,b) show the final snapshots of an impact that produced a debris disk and several satellitesimals highlighted in color corresponding to their masses. In this example, a more massive debris disk with a larger number of satellitesimals is obtained when using Tillotson EOS than using Sesame. Moreover, in addition to the target body, at least one large satellitesimal was formed in each of the simulations, but their composition, mass, and orbital elements differ between the EOSs. In comparing the Sesame run to Tillotson, the largest satellitesimal has a mass of 0.015Mpluto (with water fraction of 0.16) and 0.008Mpluto (with water fraction of 0.30) respectively. Its orbital elements are e=0.67, a=10.07Rpluto for Sesame runs, and e=0.15, a=3.2Rpluto for Tillotson. At smaller masses, using Tillotson EOS produces a greater number of clumps, as seen in Figure 1c. Three more satellitesimals were formed (some beyond the plot limits of 1b), with e=0.86, 1.35, 0.10. Note that the satellitesimal mass is an order of magnitude smaller than Charon, so alone they do not predict Charon’s formation (Canup, 2011).
In the final snapshot, a greater fraction of debris disk particles lie within the Roche limit (computed using present-day Charon’s density (McKinnon et al., 2017)) in the Sesame simulation, whereas the Tillotson disk extends to a greater distance. In terms of mass, angular momentum, and composition, the debris disks are similar (0.025 versus 0.033 of the total mass; 0.19 versus 0.25 of the total angular momentum; water fraction of 0.44 versus 0.37 for Sesame and Tillotson respectively). We note the execution time was 2-3 times longer for the simulations using Sesame than Tillotson, a factor which may be considered in choosing EOS.
Exploring the parameter space, we note that head-on impacts (ξ~0°) produce a merged single body, with the vast majority of ejected particles accreted by the planet, and the rest ejected to space. Oblique, faster than escape velocity impacts (vimp/vesc=1.1 and ξ=60°) resulted in two unbound bodies, with little mass transfer between the two, consistent with previous studies of planetary impacts (Leinhardt & Stewart, 2012).
References:
Bennett, B. I., Johnson, J. D., Kerley, G. I., & Rood, G. T. (1978). Recent developments in the Sesame equation-of-state library. https://doi.org/10.2172/5150206
Canup, R. M. (2005). A Giant Impact Origin of Pluto-Charon. Science, 307(5709), 546–550.
Canup, R. M. (2011). On a Giant Impact Origin of Charon, Nix, and Hydra. The Astronomical Journal, 141(2), 35.
Leinhardt, Z. M., & Stewart, S. T. (2012). Collisions Between Gravity-Dominated Bodies. I. Outcome Regimes and Scaling Laws. The Astrophysical Journal, 745(1), 79.
McKinnon, W. B., Stern, S. A., Weaver, H. A., Nimmo, F., Bierson, C. J., Grundy, W. M., et al. (2017). Origin of the Pluto–Charon system: Constraints from the New Horizons flyby. Icarus. https://doi.org/10.1016/j.icarus.2016.11.019
Schaller, M., Gonnet, P., Chalk, A. B. G., & Draper, P. W. (2018, May 1). SWIFT: SPH With Inter-dependent Fine-grained Tasking. Astrophysics Source Code Library. Retrieved from https://ui.adsabs.harvard.edu/abs/2018ascl.soft05020S
Tillotson, J. H. (1962). Metallic equations of state for hypervelocity impact (No. Rep. GA-3216 ). General Dynamics San Diego CA.
How to cite: Shimoni, Y., Aharonson, O., and Rufu, R.: Properties of Debris Disk and Satellitesimals in Pluto-Like Impacts Under Different Equations of State, Europlanet Science Congress 2020, online, 21 Sep–9 Oct 2020, EPSC2020-1033, https://doi.org/10.5194/epsc2020-1033, 2020.
Introduction
Almost 50 years ago, NASA’s Mariner 9 space probe performed the first complete orbit of a planet other than Earth. This was around our smaller celestial neighbour – Mars. Along the way, this spacecraft obtained images of approximately 85% of the planet’s surface in unprecedented detail, revealing a stark contrast between the northern and southern hemispheres now known as the martian crustal dichotomy. This moniker predominantly refers to the 4-8 km difference in elevation between the southern hemisphere and an apparent basin covering roughly 42% of the north. Other associated features include a higher density of volcanoes and visible impact craters in the south relative to the north.
Some studies have attempted to explain these properties through endogenic means; namely via degree-1 mantle convection studied using large-scale thermochemical models (e.g. Keller and Tackley, 2009). Others have taken the exogenic route, proposing that a giant impact early in Mars’ history caused the excavation of a large mass of material from the northern hemisphere, thus giving rise to the observed dichotomy (e.g. Marinova et al., 2008). Given that such collisions are expected to be very common in the final stages of terrestrial planetary accretion, this approach is highly feasible. The latter studies have, however, generally ignored any long-term geodynamical consequences on the martian interior that such an event may cause.
Recent work has proved the importance of coupling these methods, introducing a hybrid exogenic-endogenic scenario whereby a giant impact triggered a localized magma ocean and subsequent superplume in the southern hemisphere (Golabek et al., 2018). This hypothesis has, however, only been investigated using a very limited range of initial parameters, all of which lead to significant heating deep into the mantle. This therefore motivates an interesting area of study – could there be a parameter space that leads to a hemispherically-thickened crust without significantly heating the mantle? We aim to answer this question using a suite of smoothed-particle hydrodynamics (SPH) simulations that explore a large parameter-space chosen with the intention of limited internal heating, allowing us to neglect any long-term geodynamical effects with reasonable confidence.
Method
The chosen initial parameters for the main suite of SPH simulations are as follows: impact angles of 0-90° in steps of 15°; impact velocities of 1.0, 1.2 and 1.4 times the mutual escape speed; impactor radii of 1000km, 1500km and 2000km; and relative core masses of 25% and 50%. All of these simulations use a resolution of 200,000 SPH particles, with near head-on collisions (0-30°) being modelled for 50 hours after impact and oblique collisions (45-90°) for 200 hours to allow for any secondary (or even tertiary) impacts. In addition, a smaller set of high resolution (1,000,000 SPH particle) simulations are being used to investigate extremely low-velocity (less than mutual escape speed) collisions in a bid to quantitively identify the transition from impacts of large-scale mantle heating to those of relatively cool accretionary piles similar to those described in Jutzi and Asphaug (2011). This then allows for discussion of the potential mechanisms that could lead to such events and their feasibility.
Each model includes the effects of shear strength and plasticity (via a Drucker-Prager-like yield criterion) as such effects have been shown to be significant on the scales concerned in this study (Emsenhuber et al., 2018). Moreover, the sophisticated equation of state ANEOS is being used along with a Mars-specific solidus (Duncan et al., 2018) to accurately calculate the physical environment in which such solid characteristics must be considered.
In all of these studies, both Mars and the impactor are treated as differentiated bodies composed of an iron core and a silicate mantle. An example result of one of these simulations can be seen in Figure 1.
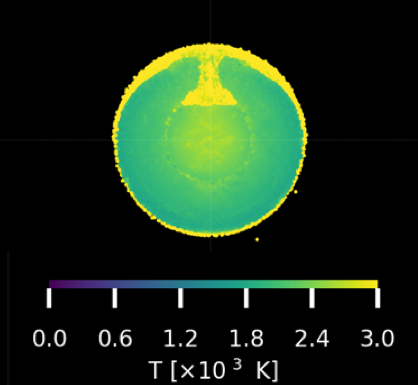
Figure 1: The resulting temperature field of a Mars-like body from a 106 particle SPH simulation 12hr after an impact with a ≈1000km radius impactor at a 0° impact angle and a velocity of 80% of the mutual escape speed.
Preliminary Results
The initial results of this study have revealed promising hemispherical features in certain cases, particularly when examining the melt distribution in the upper mantle. Of notable interest are the results of the grazing impact angles, as some of the initial kinetic energy of the impactor is converted to rotational energy of Mars, allowing for subsequent merging events of decreased impact velocity. In addition, the effects of material strength have been found to be non-negligible, in contrast to previous beliefs that such aspects can be ignored on the length-scales involved in planetary collisions.
References
Canup, R. and Salmon, J. (2018). Origin of Phobos and Deimos by the impact of a Vesta-to-Ceres sized body with Mars. Science Advances, 4(4).
Duncan, M. S., Schmerr, N. C., Bertka, C. M., and Fei, Y. (2018). Extending the Solidus for a Model Iron-Rich Martian Mantle Composition to 25 GPa. Geophysical Research Letters, pages 211–220.
Emsenhuber, A., Jutzi, M., and Benz, W. (2018). SPH calculations of Mars-scale collisions: The role of the equation of state, material rheologies, and numerical effects. Icarus, 301:247–257.
Golabek, G. J., Emsenhuber, A., Jutzi, M., Asphaug, E., I., and Gerya, T. V. (2018). Coupling SPH and thermochemical models of planets: Methodology and example of a Mars-sized body. Icarus, 301:235–246.
Jutzi, M. and Asphaug, E. (2011). Forming the lunar farside highlands by accretion of a companion moon. Nature, 476(7358), 69-72.
Keller, T. and Tackley, P. J. (2009). Towards selfconsistent modeling of the martian dichotomy: The influence of one-ridge convection on crustal thickness distribution. Icarus, 202(2):429–443.
Marinova, M. M., Aharonson, O., and Asphaug, E. (2008). Mega-impact formation of the Mars hemispheric dichotomy. Nature, 453(7199):1216–1219.
Murchie, S. L., Thomas, P. C., Rivkin, A. S., and Chabot, N. L. (2015). Phobos and Deimos.
How to cite: Ballantyne, H. and Jutzi, M.: Forming the Martian Crustal Dichotomy Without Significant Mantle Heating, Europlanet Science Congress 2020, online, 21 Sep–9 Oct 2020, EPSC2020-665, https://doi.org/10.5194/epsc2020-665, 2020.
1. Introduction
Moonlets from an equatorial debris disk caused by a giant impact (a mechanism by which Phobos and Deimos may have formed (Craddock 2011; Rosenblatt 2011), may have had slowly decaying orbits leading to craters formed at low impact angles (< 5°). The absence of crater morphologies consistent with very low impact angles has been used to argue against the spiralling moonlet hypothesis for the formation of elongated craters (Bottke et al. 2000). The absence of comprehensive atmospheric entry and impact modelling for decaying moonlets leaves open the possibility that some only moderately elongated craters on Mars were formed by decaying moonlets in a thicker atmosphere. Indeed, the 12.5km spatial separation and apparent 3-3.7Ga age and cogenesis of double-oblique impact craters observed by (Chappelow and Herrick 2008) could be inconsistent with formation by a fast (i.e. non-moonlet) meteorite impactor unless a thicker atmosphere provided drag to increase impact angle during spiralling.
2. Method
To explore the effect of ancient atmospheric conditions on the impact angle of potential spiralling moonlets, we construct a simple 2D model to spiral down a moonlet from the top of a hypothetical Mars atmosphere. A body that is at mean circular orbital velocity at the top of the atmosphere,
![]()
experiences gravitational pull
![]()
and atmospheric drag,
![]()
Where G is the gravitational constant, Mm is the mass of Mars, r is the distance between the centres of mass of the impactor and Mars’, CD is the coefficient of drag, 𝜌 is the atmospheric density, and A is the cross-sectional area of the impactor (with respect to the velocity direction).
The model proceeds at each time step (1s) by updating the impactor velocity with a vector of the resultant acceleration, calculated using instantaneous gravitational and atmospheric drag forces. We simulate impact angle, retrieved at the point of contact between spherical impactors and the Mars surface for plausible parameter ranges for impactors and ancient Mars atmosphere.
CD is typically determined experimentally, and is a function of many parameters. At low speeds and for a small spherical projectiles, CD ~ 0.5 (Miller and Bailey 1979). For large projectiles and mach numbers > 1, behaviour of CD becomes complex and may reach values > 1. To account for this we run simulations for a range of CD up to 1.1.
Impactors 10m to 10km in diameter, surface atmospheric pressures 5 to 500 mbar, coefficients of drag 0.5 to 1.1, and densities covering the range between Phobos and Deimos (1400-1900 kg m-3). An atmospheric temperature profile from (Schofield et al. 1997) was used, and linearly interpolated as a function of altitude.
We assumed a present day atmospheric composition, with component fractions of 0.7532, 0.227, 0.016 and 0.08 of CO2, N2, Ar and CO, respectively. It is highly likely that an ancient Mars atmosphere had a different composition. As a cursory assessment of the potential impact of different atmospheric composition, we note that substituting 20% of Mars CO2 fraction for N2, the mean molecular mass, 𝜇, would change from 0.0455 to 0.0415, a shift of ~9%. Given that 𝜇 appears only a first order denominator in the calculation of scale height (H = RT/𝜇g) we do not expect uncertainty on past atmospheric composition to have a major impact on our conclusions.
A summary of the parameters used is shown in Table 1. We ran the model for all permutations of the parameter grid, yielding ~2.6x10⁵, model runs.

Table 1: Domain and sampling intervals for parameter space explored for spiralling impactors.
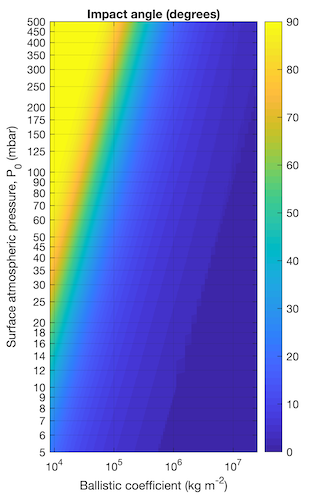
Figure 1: Impact angle as a function of surface atmospheric pressure (mbar) and ballistic coefficient (BC). Surface is a bilinear interpolation of BC run over the parameters listed in Table 1.
3. Discussion
With a drag coefficient of 0.5, Phobos has a ballistic coefficient ~ 8x10⁷ kg m-2, while Deimos’ is ~2.4 x 10⁶ kg m-2. Both moons are therefore sufficiently large and dense that their impact angle would not be substantially modified by atmospheric drag, even for a 0.5 bar atmosphere. However, moonlets decaying from a quasi-stable equatorial debris disk has been proposed to be in the range 1-4km (Rosenblatt et al. 2016). A 1km diameter object with Deimos density would have a BC ~1.8x10⁶. Such an object would experience a shift in impact angle of several 10s of degrees in atmospheres > 100 mbar.
Importantly, we note that the model does not account for non-spherical shapes, heterogeneous density distribution in the impactor, or fragmentation of impactors. Fragmentation would produce a group of impactors, each with lower ballistic coefficients than the parent impactor, and therefore whose impact angle may be steeper than if fragmentation did not occur.
4. Conclusions
We find that apparent lack of very oblique impacts that should be expected from decaying moonlet hypothesis could be due to increased atmospheric drag in an ancient, thicker atmosphere. Based on a simplistic model, impact angle deviations > 10° (compared to present day) are possible in atmospheres of few 100 mbars, for objects with low ballistic coefficients in the ~sub-km diameter range.
5. References
Bottke, W. F., Love, S. G., Tytell, D., and Glotch, T. 2000. “Interpreting the Elliptical Crater Populations on Mars, Venus, and the Moon.” Icarus 145(1): 108–21.
Chappelow, J. E., and R. R. Herrick. 2008. “On the Origin of a Double, Oblique Impact on Mars.” Icarus 197(2): 452–57.
Craddock, R. A. 2011. “Are Phobos and Deimos the Result of a Giant Impact?” Icarus 211(2): 1150–61.
Miller, D. G., and Bailey, A. B. 1979. “Sphere Drag at Mach Numbers from 0·3 to 2·0 at Reynolds Numbers Approaching 107.” Journal of Fluid Mechanics 93(3): 449–64.
Rosenblatt, P. 2011. “The Origin of the Martian Moons Revisited.” Astronomy and Astrophysics Review 19(1).
Rosenblatt, P. et al., 2016. “Accretion of Phobos and Deimos in an Extended Debris Disc Stirred by Transient Moons.” Nature Geoscience 9(8): 581–83.
Schofield, J. T. et al. 1997. “The Mars Pathfinder Atmospheric Structure Investigation/Meteorology (ASI/MET) Experiment.” Science 278(5344): 1752–58.
How to cite: Sefton-Nash, E., Witasse, O., and Faes, Z.: Impact angle of impactors decaying from circular orbits in an ancient Mars atmosphere, Europlanet Science Congress 2020, online, 21 Sep–9 Oct 2020, EPSC2020-1095, https://doi.org/10.5194/epsc2020-1095, 2020.
Introduction: Meteoroid bombardment is one of the sources of seismic activity on planetary bodies. The very first seismometer operating on the surface of another planet was successfully deployed by the NASA InSight (Interior Exploration using Seismic Investigations, Geodesy and Heat Transport) mission to Mars. It gives us an opportunity to investigate the seismicity of Mars, including impact-induced seismic activity. This work investigated the seismic efficiency associated with small meteorite impacts on Mars, using numerical methods in targets analogue to the Martian surface. The Martian crust was simulated as non-porous bedrock (0% porosity) or regolith with different porosities (25%, 44% and 65%)
The seismic efficiency, k, is presented as a portion of impact energy that is transferred into seismic energy. It has been suspected that consolidated (bedrock) and non-consolidated (regolith) materials will have different values of seismic efficiency. Estimates of seismic efficiency range from k=10-2 to 10-6 (Schultz and Gault, 1975; Daubar et al., 2018; McGarr et al., 1969; Hoerth et al., 2014; Richardson & Kedar, 2013; Güldemeister & Wünnemann, 2017). High seismic efficiency is typical in bedrock or highly consolidated materials (k>10-3). Low seismic efficiency is typical for sediments or unconsolidated sands and soils (k<10-5) (e.g., Patton and Walter 1993). In this work, we used a simplified approach (e.g. Güldemeister & Wünnemann, 2017) that defines the seismic efficiency as: ; where x represents distance from the impact point, P is the amplitude of the pressure pulse, t is the duration of the pressure pulse, ρ is the density of the target, Cp is the speed of sound in the target and Ek is the kinetic energy of the impactor.
Numerical impact modelling: All simulations were performed with the iSALE-2D shock physics hydrocode (Collins, et al., 2004; Wünnemann et al., 2006). The impact conditions were modelled to replicate recent fresh meter size impact that occurred on Mars since the landing of InSight (Daubar et al., 2020). Impact crater was estimated to be ~1.5 m in diameter. Impactor radius was 4.4 cm and kinetic energy of 1.8x10⁶ J.
To simulate bedrock and fractured bedrock (25% porosity) we used the ROCK strength model (Collins et al., 2004). To simulate the regolith (44% and 65% porosity) we used Lundborg strength model (Lundborg, 1968) (Table 1). We used the Tillotsen equation of state for basalt (Tillotson, 1962; Wójcicka et al., 2020). For porous cases, we used the ε-α porosity model (Wünnemann et al., 2006;) (Table 2).
Table 1. Strength model parameters for targets with different porosity
| Parameter | 0% | 25% | 44% | 65% |
| Strength model | ROCK | ROCK | LUNDD | LUNDD |
| Strength (damaged) (kPa) | 10 | 0 | 10 | 0.3 |
| Friction (damaged) | 0.6 | 0.67 | 0.7 | 0.7 |
| Limiting strength (damaged) (GPa) | 3.5 | 0.17 | 0.25 | 0.25 |
| Strength (intact) (MPa) | 10 | 0.2 | ||
| Friction (intact) | 1.2 | 1.8 | ||
| Limiting strength (intact) (GPa) | 3.5 | 0.17 |
Table 2. ε-α porosity model parameters (Borg et al., 2005; Wünnemann et al., 2006; Wójcicka et al, 2020).
| Parameter | 25% | 44% | 65% |
| Initial distension, α | 1.33 | 1.8 | 2.8 |
| Elastic threshold, ε0 | -4x10⁻⁴ | 10-4 | 10-5 |
| Distension at transition αx | 1.1 | 1.15 | 1.0 |
| The rate change of distension with respect to volumetric strain, k | 0.98 | 0.98 | 0.98 |
| Ratio of speed of sound in porous over non-porous medium, χ | 0.6 | 0.33 | 0.21 |
All variables in the equation for the seismic efficiency were calculated from iSALE outputs. The pressure wave was observed via gauges cells, placed at 45° equidistantly throughout the target. The pressure wave amplitude and pulse duration were calculated at full width half maximum. The sound speed was calculated from assumed bulk modulus of basalt (Wójcicka et al, 2020).
Results: Seismic efficiency was calculated for the same impact conditions in all four material models, representing the reference 1.5 m crater recently observed on Mars. There is a clear decrease in seismic efficiency with increasing porosity. It is of the order of 10-5 for porous and highly porous regolith and 10-4 for fractured bedrock. Estimates for the non-porous basalt bedrock are in the order of 10-3 (Figure 1).
Porosity of the target affected pressure wave amplitudes, duration of the pressure pulse and speed of sound in the target. These are all parameters used in calculation of seismic efficiency. This implies that if impact occurs on very dusty parts of Mars with thick regolith cover, efficiency would be smaller than efficiency of the impact that occurred on the bedrock, or area with thinner regolith cover.

Figure 1. Seismic efficiency calculated in targets with different porosity
Conclusions. Impact cratering represents one of the most important geological processes in the Solar System. Defining relationship between target’s properties and seismic efficiency is of interest to the NASA InSight science, since it helps in understanding the properties of the uppermost crust on Mars. Previous approximations of seismic efficiency were of 2x10⁻⁵ with an order of magnitude uncertainty for seismic efficiency on Mars (Teanby and Wookey, 2011) and Daubar et al. (2018) adopted the seismic efficiency of 5x10⁻⁴ calculated from the seismic moment (Gudkova et al., 2011; 2015; Teanby 2015). In this work, we calculated the seismic efficiency in meter-size impacts on Mars to be different for bedrock (order of 10-3) and porous materials (order of 10-5).
How to cite: Rajsic, A., Miljković, K., Collins, G., Wünnemann, K., Wieczorek, M., Wojcicka, N., and Daubar, I.: Seismic efficiency of Martian upper crust simulant., Europlanet Science Congress 2020, online, 21 Sep–9 Oct 2020, EPSC2020-708, https://doi.org/10.5194/epsc2020-708, 2020.
Introduction
Understanding the shock behavior of the calcium sulfates gypsum (CaSO4·2H2O), bassanite (CaSO4·0.5H2O), and anhydrite (CaSO4) is essential for understanding hypervelocity impacts into evaporite sediments that are widespread on Earth and which also occur on Mars [1,2]. Most interest focuses on quantification of the impact-induced release of volatiles (H2O and SO2/SO3) to assess its role in the generation or modification of planetary atmospheres [3–11]. Estimates of the amount of gas released from volatile-bearing materials in hypervelocity impact scenarios rely on assignment of the shock-pressure thresholds for incipient and complete vaporization [10]. However, these thresholds are poorly constrained for calcium sulfates, and many studies produced inconsistent to even contrasting results (cf. [5,7,9]). In addition, reports of sulfate impact melts [6] suggest that the shock behavior of the calcium sulfates is more complex than traditionally thought and possibly involves interaction with coexisting silicate impact melts.
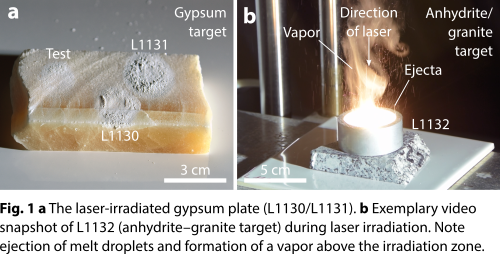
Based on our previous study on the interaction between carbonates and silicates in laser-generated melts [12], we report here on the fate of gypsum and anhydrite in laser-irradiation experiments. Specifically, we laser-irradiated gypsum, gypsum–granite, and anhydrite–granite targets to investigate dehydration, decomposition, and melting of the calcium sulfates as well as interaction between calcium sulfates and silicates in an impact-related context.
Materials and methods
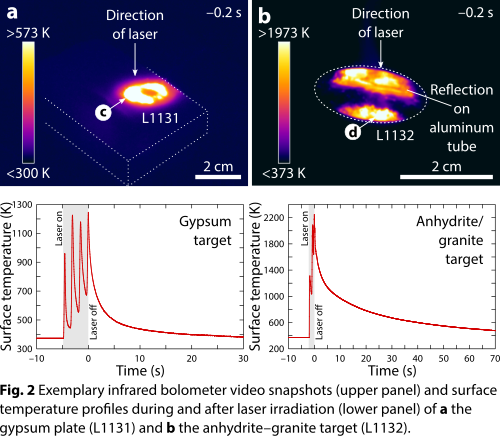
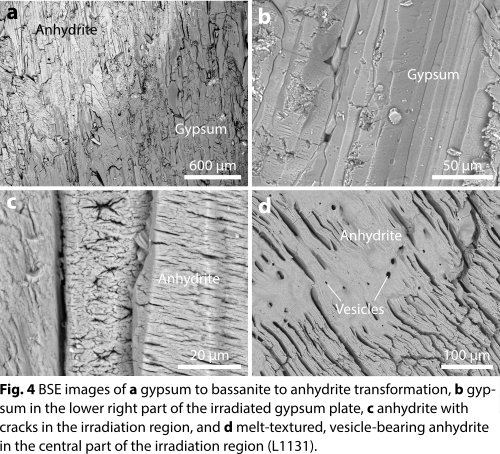
We used a continuous-wave fiber laser of 1.07 µm wavelength at Fraunhofer Institut für Kurzzeitdynamik, Freiburg, Germany, to irradiate a gypsum plate (experiments L1130 and L1131) and pulverized gypsum–granite (experiment L1133) and anhydrite–granite (experiment L1132) mixtures in air at 1 bar and room temperature (Fig. 1). The laser emitted a power of 2 or 5 kW for 2 or 5 s, and 1/e2 beam diameters of 6 or 17 mm were used. The laser intensity varied between 8.8 × 10² and 1.8 × 10⁴ W/cm2 and the laser–matter interaction zone was observed using the setup described in [13]. Temperature measurements (Fig. 2) show that peak temperatures were in the range of 1200 K for the gypsum plate and 2200 K for the composite targets. Textural and compositional characterization of the recovered samples employed transmitted-light microscopy, Raman spectroscopy, and scanning electron microscopy.
Results and discussion
Laser irradiation of the gypsum plate resulted in dehydration of gypsum and successive transformation of gypsum to anhydrite via bassanite. The transformation is evident from the 3250 to 3750 cm–1 region in Raman spectra (Fig. 3), in which the Raman bands corresponding to the stretch vibration modes of water are positioned. Consistent with previous investigations [8,14], the gypsum to anhydrite transformation is also accompanied by a slight upshift of the Raman band associated with the ν1 symmetric stretch vibration modes of the SO4 tetrahedra (i.e., from 1010 cm–1 in gypsum to 1017 cm–1 in bassanite to 1018 cm–1 in anhydrite).
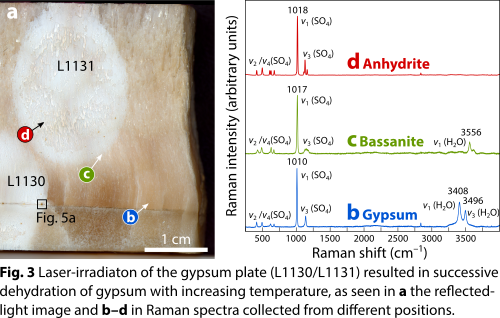
In addition, dehydration of gypsum is also evident from BSE images obtained from the irradiation zones by an increase in brightness (Fig. 4a) and by the presence of cracks in individual anhydrite crystals that are absent in the gypsum crystals of the starting material (Figs. 4b,c). In addition, textures indicative of melting (occurrence of round vesicles; filling of cleavage space by flow-textured material of anhydrite composition) are present in the interior parts of the laser-irradiated regions (Fig. 4d).
Textures indicative of melting and recrystallization of anhydrite were also detected in clast-bearing melt droplets recovered from the gypsum–granite and anhydrite–granite experiments (Fig. 5). Specifically, anhydrite intimately associated with silicate melts occurs in the form of clusters of lath-shaped, typically vesicle-bearing crystallites that often enclose small silicate melt droplets. These clusters are interpreted as quenched CaSO4 liquids. The interfaces between the silicate melts and the anhydrite clusters are typically sharp and reminiscent of menisci formed by liquid immiscibility (cf. [8]; Fig. 5).
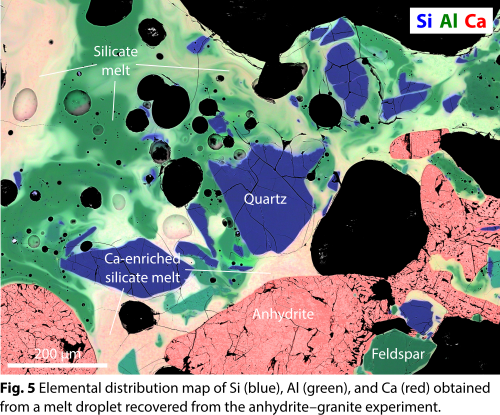
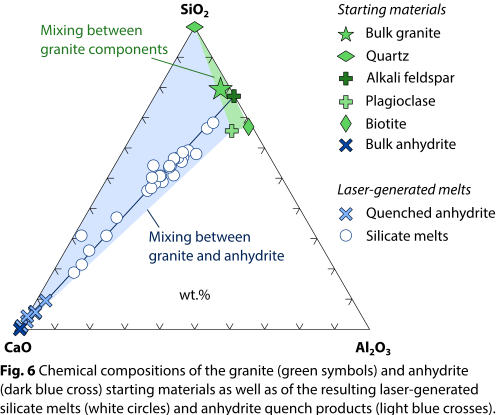
Furthermore, chemical interaction between CaSO4 and the silicate melts derived from the granite is evident from elemental distribution maps (Fig. 5) and point analyses (Fig. 6). Specifically, most silicate melts are heavily enriched in CaO (Fig. 6) as well as SO3, showing data trends in binary (e.g., CaO–SiO2) or ternary (e.g., CaO–SiO2–Al2O3) composition space that cannot be explained by melting and mixing of the granite components alone. In keeping with previous findings [6], limited amounts of SiO2 were detected in the quench anhydrite, suggesting that the CaSO4 liquids and silicate liquids readily exchanged chemical components during the brief time scales (seconds; cf. Fig. 2b) in which the materials were in the liquid state.
Conclusions
Our results suggest that the thermally triggered dehydration of gypsum due to hypervelocity impacts or magmatic activities can be exceptionally fast (seconds to tens of seconds) and results in dehydration of gypsum, formation of anhydrite via basanite, and melting of anhydrite. The presented Raman spectra and microtextures may be useful for interpretation of similar reaction products observed on Mars [2,15–17]. Our results confirm previous observations on shock-melted sulfates [6] and suggest that impact melting of calcium sulfates should be indeed more prevalent than previously thought. Specifically, our experiments illustrate that calcium sulfate impact melts will readily interact with coexisting silicate impact melts, resulting in Ca-enriched silicate melts and Si-enriched, quenched anhydrite melts.
References
[1] Langevin et al. 2005, Science 307, 1584–1586. [2] Vanimann et al. 2018, Am. Mineral. 103, 1011–1020. [3] Chen et al. 1994, Earth Planet. Sci. Lett. 128, 615–628. [4] Pierazzo et al. 1998, J. Geophys. Res. 103, 28607–28625. [5] Gupta et al. 2001, Earth Planet. Sci. Lett. 188, 399–412. [6] Osinski and Spray 2003, Earth Planet. Sci. Lett. 215, 357–370. [7] Skála et al. 2005, GSA Special Paper 384, 413–425. [8] Bell and Zolensky 2011, 42nd LPSC, Abstr. #2008. [9] Prescher et al. 2011, Meteorit. Planet. Sci. 46, 1619–1629. [10] Artemieva et al. 2017, Geophys. Res. Lett. 44, 10180–10188. [11] Kurosawa et al. 2019, Geophys. Res. Lett. 46, 7258–7267. [12] Hamann et al. 2018, Meteorit. Planet. Sci. 53, 1644–1686. [13] Hamann et al. 2016, Geophys. Res. Lett. 43, 10602–10610. [14] Liu et al. 2009, 40th LPSC, Abstr. #2128. [15] Knauth et al. 2005, Nature 438, 1123–1128. [16] Squyres et al. 2012, Science 336, 570–576. [17] Robertson and Bish 2013, Icarus 223, 407–417.
How to cite: Hamann, C. and Hecht, L.: Dehydration, melting, and recrystallization of calcium sulfates (gypsum, bassanite, anhydrite) in laser-irradiation experiments, Europlanet Science Congress 2020, online, 21 Sep–9 Oct 2020, EPSC2020-869, https://doi.org/10.5194/epsc2020-869, 2020.
The Dellen impact structure is located in a ca. 20 km wide basin filled by two lakes in the east central Sweden. This complex structure is covered by a thick moraine deposit, and most impact melted material can be found as loose blocks and boulders scattered throughout the moraine. Geophysical measurements show the presence of a coherent impact melt body about 9 km in diameter and 200 to 500 m thick (Henkel, 1992) for which impact ages ranging between 90, 110, to 140 Ma have been determined (see Deutsch et al., 1992; Mark et al., 2014, and references therein).
Here we describe the petrography and mineral chemistry of an impact melt glass (commonly referred to as dellenite) consisting of phenocrysts of subhedral orthopyroxene (average Wo4En63Fs33), skeletal plagioclase (average An59Ab38Or3), and euhedral magnetite within a glassy matrix of rhyolitic composition.
Moreover we aimed to use the pyroxene crystals as a petrological tool to define the host rock cooling rate and the water content dissolved in their parental melt during pyroxene growth.
MicroFTIR measurements performed both in the glass matrix and in the euhedral glass blebs within the skeletal plagioclase show the presence of 1.4 wt% water in the rhyolitic glass. Comparing the water content of the glass with the water solubility of a silicate melt with the same composition as determined by the model by Papale, suggests that the studied sample vitrified at a pressure of about 200-300 bar.
Orthopyroxene crystals from the dellenite sample were studied by polarized FTIR spectroscopy, Mössbauer spectroscopy, single crystal X-ray diffraction and electron probe micro analysis. Dellenite orthopyroxenes are iron rich enstatite (Wo4 En63 Fs33) with a Fe3+/Fetot ratio of 1.6%, as measured by Mößbauer spectroscopy.
The studied orthopyroxenes have very weak to absent OH vibrational bands in the IR spectra, corresponding to H2O contents ranging from 0 to 39 ppm H2O. These variable contents seem to indicate H loss during post-formation processes, which may occur via the relatively fast redox reaction Fe2+ + OH- = Fe3+ + O2- + ½H2.
In volcanic pyroxenes H loss may be a common process occurring at different moments from crystallization to post-eruption. However, H incorporation in pyroxene is associated with point defects governed by slow kinetics diffusion rates, which are retained in the structure when H is lost. By reversing the redox reaction the original H content of pyroxene can thus be recovered by thermal annealing experiments under reducing conditions (Weis et al., 2016).
In order to restore H that was possibly lost, dellenite pyroxenes were thermally annealed under hydrogen atmosphere (at 1 Atm) in a horizontal glass-tube furnace at the Department of Geosciences (Natural History Museum Stockholm). We performed thermal annealing experiments at 700°C for 17 hours. FTIR spectra were recorded after each heating step. All the samples increased their hydrogen content and the final average water content is 77 ppm.
Cation partition as derived by the single crystal X-ray diffraction and EMPA were used to calculate the orthopyroxene closure temperature (Tc) which is expression of the cooling rate for the cpx-host rock. Preliminary results point to a high Tc (833°C) due to a quite fast host-rock cooling rate.
A tentative model for the evolution of the rhyolitic portion of the Dellen impact melt is under development merging geophysical data with our experimental data on water content of pyroxene and glass, and pyroxene geospeedometry.
References:
- Deutsch A., Buhl D., Langenhorst F. (1992) on the significance of crater ages: new ages for Dellen (Sweden) and Araguainha (Brazil). Tectonophysics, 216, 205-218.
- Henkel H., (1992) Geophysical aspects of meteorite impact craters in eroded shield environment, with special emphasys on electric resistivity. Tectonophysics, 216, 31-40.
- Mark D.F., Lindgren P., Fallick A.E. (2014) A high precision 40Ar/39Ar age for hydrated impact glass from the Dellen impact, Sweden. Geological Society of London Special Publication 378, 349-366.
- Papale P., (1999) Modelling the solubility of H2O+CO2 fluid in silicate liquids. American Mineralogist, 84, 477-792.
- Weis FA, Skogby H, Stalder R (2016) Experimental hydration of natural volcanic clinopyroxene phenocrysts under hydrothermal pressures (0.5–3 kbar). American Mineralogist 101(10): 2233-2247
How to cite: Giuli, G., Nazzareni, S., and Skogby, H.: Dellen impact melt rock: pyroxenes as a proxy for the melt thermal history and water content, Europlanet Science Congress 2020, online, 21 Sep–9 Oct 2020, EPSC2020-1027, https://doi.org/10.5194/epsc2020-1027, 2020.
1. Introduction
A recent study on a Muong Nong-type tektite [1] revealed the occurrence of quartz with a “spongy texture”. The orientation and distribution of the voids in quartz were supposed to be crystallographically controlled.
Similar structures were not reported before in the literature except for a glass impactite from the 45-m-Kamil crater, Egypt (sample L09) [2]. No Raman or TEM studies were carried out on this lapillus and due to the occurrence of voids, this SiO2-rich material was interpreted as glass.
The renewed interest induced us to check again these structures in Kamil impactites. They were found along borders and fractures in numerous quartz relicts occurring in impact melt lapilli. In this work, we present the preliminary results of the characterization of these structures.
2. Impactite L09
The present study focuses on the SiO2 glass-rich impactite L09 (max length ~5 cm). This sample was described in [2] as white glass, i.e., a glass derived from the melting of the target rock without interaction with the projectile (Ni below detection limit). The glass is locally stained by reddish-brownish material. Among Kamil white glasses, L09 is the only sample showing large quartz relicts (up to a few millimeters).
3. Methods
The sample was optically characterized through polarized microscope and Raman spectroscopy. Successively, it was investigated by scanning electron microscopy (SEM) and spot chemical analyses from the vesicular glass and quartz relicts were acquired through electron microprobe (EMP).
4. Results
Under crossed polarized light the quartz relicts have a very low birefringence and show sporadic birefractive domains. In the birefractive domains, planar deformation features (PDFs) have been observed. Raman spectra of quartz relicts vary between a pure SiO2 glass spectrum with the typical large asymmetric band at ~490 cm-1 and a glass-free shocked-quartz spectrum (main peak at 460 cm-1). Shocked-quartz is easily recognized by Raman spectroscopy: the peaks are shifted towards lower frequencies due to the increase in the angle spanning two tetrahedra [3,4]. Up to two sets of PDFs were recognized at the SEM. PDFs are irregular, closely spaced, enlarged, and tend to coalesce. The PDF areas are in spatial continuity with PDF-free amorphous regions. The PDF-free amorphous regions can contain sporadic vesicles. No flux textures have been recognized in quartz relicts. Occasionally, quartz relicts are crossed by vesicular glass veins chemically enriched in Al2O3 and FeO and open fractures.
The margins of the quartz relicts and fractures are mostly surrounded by a layer (usually 30-µm-thick; exceptionally up to 100-µm-thick) of unshocked quartz (Raman main peak at 465 cm-1). Quartz appears in form of skeletal hexagonal aggregates. The numerous voids left out from the skeletal growth are partially filled by iron oxides. The number of the voids increases and their size decreases towards the quartz relicts describing a kind of rim. Small concentric fractures are frequent in the quartz relicts, marking the rim of the skeletal quartz layers. No cristobalite or high-pressure SiO2 polymorphs (i.e., coesite and stishovite) have been detected by Raman.
5. Preliminary discussion
The occurrence of skeletal quartz is indicative of a rapid crystallization of the quartz from a fluid phase. Due to the size of the impact event and size of the lapillus, a hydrothermal post-shock alteration could be ruled out. Thus, it is plausible that the quartz crystallized from a SiO2-rich melt. Due to its viscosity, this melt should have been formed at the same location where the skeletal quartz occurs. The melt formed at the expense of the highly-shocked-quartz/diaplectic-glass grains with a minor involvement of the Si-Fe-Al surrounding melt/glass. The melting should have occurred immediately after the pressure release, in the early decompression stage. The subsequent drop of the temperature induced the fast (skeletal) crystallization of the quartz. That probably started in the stability field of β-quartz (4.5 GPa<P<0.6 GPs). The crystallization propagated radially towards the glass from the grain boundaries and fractures. Changes in the rim texture of the skeletal quartz could be related to changes in growth rate. The iron-rich oxides in the cavities of the skeletal quartz represent the immiscible/residual melt of the quartz crystallization. The forthcoming focus ion beam milling (FIB) and a transmission electron microscopy (TEM) investigations aim to establish the crystallographic and phase relations between the quartz relicts and the skeleton quartz aggregates to constrain their formation and meaning in the framework of the impact melting process.
Acknowledgements
This work is supported by the Deutsche Forschungsgemeinschaft (DFG; FA 1599/1-1 to AF). Prof. Langenhorst is thanked for the access to the SEM/FIB and TEM facilities at the University of Jena founded via the Gottfried Wilhelm Leibniz prize (LA830/14-1). Dr. Kiefer (University of Jena) is acknowledged for technical assistance during the EMP measurements. The studied sample was collected during the 2010 geophysical expedition carried out within the framework of the 2009 Italian- Egyptian Year of Science and Technology and supported by the Italian Ministero degli Affari Esteri e Cooperazione Internazionale (MAECI)—Progetti di Grande Rilevanza.
References
[1] Glass, B.P., et al. (2020) Coesite in a Muong Nong-type tektite from Muong Phin, Laos: Description, formation, and survival. Meteoritics & Planetary Science. 55:253–273.
[2] Fazio, A., et al. (2016) Target-projectile interaction during impact melting at Kamil Crater, Egypt. Geochimica et Cosmochimica Acta 180:33-50.
[3] Fritz, J., et al. (2011) Shock experiments on quartz targets pre-cooled to 77 K. International Journal of Impact Engineering 38:440-445.
[4] Mcmillan, P.F., G.H. Wolf, and P. Lambert (1992) A Raman-Spectroscopic study of shocked single crystalline quartz. Physics and Chemistry of Minerals 19:71-79.
How to cite: Fazio, A. and Folco, L.: Skeletal crystallization of quartz from SiO2 impact melt, Europlanet Science Congress 2020, online, 21 Sep–9 Oct 2020, EPSC2020-235, https://doi.org/10.5194/epsc2020-235, 2020.
Introduction: Orbital images of impact crater floors show heterogeneity in texture, relief of central structures, peak rings or terrace zones, and presence or absence of blocks. The absence of the 3rd dimension renders challenges in interpreting the thickness of impactites that fill these craters. Whereas texture in orbital images give clues to emplacement process, terrestrial craters benefit from seismic imaging and scientific drilling.
The Cretaceous-Paleogene (K-Pg, 66 Ma), 200 km Chicxulub impact crater, México, provides the unique opportunity to study crater formation processes related to a large impact [1]. Chicxulub is a multi-ring basin with an intact melt sheet, peak ring, and crater floor (Fig. 1) [1,2]. It is well preserved due to its youth and burial beneath 100s of meters of Cenozoic carbonates [1,2].
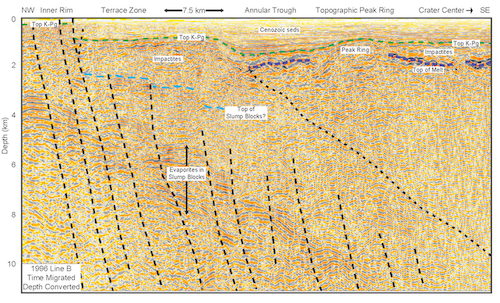
Figure 1. Northwest orientied, time migrated seismic line (Line B), which was depth converted using 3D seismic refraction velocity model, crosses from near the crater center to inner ring faults of Chicxulub impact structure showing features with 3x vertical exaggeration. Line shows that impactites represent substantial thicknesses of material burying slump blocks within annular trough, capping the peak ring, and overlying the central melt sheet. Top K-Pg represents top of suevite layer drilled in IODP-ICDP Expedition 364 (see Figure 2). Figure modified from [2].
The 14.9 Ma, 25 km Ries impact crater, Germany, appears to represent a transitional crater form between central peak and peak ring crater with a collapsed central uplift. It has a well-preserved crater floor within the central crater due to burial by lacustrine sediments, but no clear indication of a melt sheet [3].
Insights from Scientific Drilling and New Geophysical Analyses: The International Ocean Discovery Program with co-funding from the International Continental Scientific Drilling Project drilled into the Chicxulub peak ring in 2016 [4]. Hole M0077A (Fig. 2) recovered the uplifted crystalline rocks of the peak ring and the layered deposit that overlies it consisting of impact melt rock overlain by clast-rich impact melt rock and breccia, suevite, and finally sorted suevite with decreasing clast size upsection. These impactites all have a low velocity (~3000 m/s or less) and high porosity (20-40%). Interpretation of this low-velocity sequence is that the lower portion was rapidly deposited onto and perhaps intermixed with impact melt rocks during impactoclastic flows and melt-water interactions. The upper sorted suevite is a resurge deposit in this marine target setting [5].
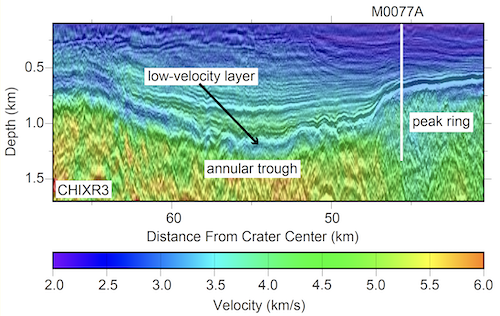
Figure 2. Seismic reflection Line ChicxR3 within the Chicxulub crater overlain by full waveform inversion generated velocity model. The Chicxulub impact crater peak ring is overlain by a low-velocity zone that can be mapped into the adjacent annular trough which maps to a sorted suevite within IODP-ICDP Exp. 364 Hole M0077A core. White line representing depth reach during drilling (1335 meters below seafloor) where this low velocity layer represented ~90 m thick and was underlain by additional 40 m of more melt rich impactites. Figure modified from [5].
2D, full-waveform tomographic velocity images from the grid of seismic data recorded on a 6-km streamer across the Chicxulub impact crater allowing mapping of these units (Fig. 2). These images show both the lower and upper portions of the low-velocity layer present at Site M0077 thus allowing us to potentially map the thickness of both the resurge deposit and the lower more rapidly deposited layer. Prominent high-velocity zones are also visible that are interpreted to represent intact melt rock (Fig. 2) [2].
In the Ries Crater new high-resolution images highlight layered sequences within the central crater. One interpretation of this package is that it may represent so-called crater suevite penetrated by the Nordlingen 1973 drill core, that we suggest were deposited in impactoclastic flows. In this drill core, suevite is overlain by a thin section of sorted suevite perhaps similar to the upper low velocity zone at Chicxulub. Within the annular trough, the suevite lays unconformably over bunte breccia which was transported inward during crater modification [3].
Impactites and Crater Floor: The Chicxulub crater floor is largely made of the sorted suevite resurge deposit expressed as the upper low velocity zone, which only occasionally is penetrated by a cropping out of deeper impactites. This may reflect the volume of ejecta and impactites formed within the 100 km diameter transient cravity at Chicxulub, that were then uniformly distributed within the final crater due to depth of resurge. The lower more rapidly deposited layer however varies with the greatest thicknesses in the central basin at Chicxulub which may provide insights for Ries.
The layered crater suevite at Ries may be equivalent to this lower unit of melt rich impactites wherein impactoclastic flows incorporate the melt potentially providing an explanation for the lack of an intact melt sheet in this smaller crater. In turn the 2 km thick impactites in the annular trough at Chicxulub (Fig. 1) may represent both ejecta curtain material similar to the bunte breccia at Ries and outward directed melt rock and suevite such that the suevite overlies the ejecta similar to at Ries. The Ries crater floor may have been more heterogeneous with some areas exhibiting blocks of bunte breccia emergent through the suevite and the sorted suevite perhaps not being present throughout the crater.
References: [1] Morgan et al. (2007) Nature, 390, 472-476 [2] Gulick et al. (2013) Rev Geophysics, 51, 31-52 [3] Stöffler et al. (2013) Meteoritics & Planetary Science, 48, 515-589, [4] Morgan J. V. et al. (2016) Science, 354, 878–882 [5] Gulick et al. (2019) Proc Nat Acad Sci.,116, 19342-19351.
How to cite: Gulick, S., Christeson, G., McCall, N., Morgan, J., and Ormö, J.: Impactite stratigraphy and depositional processes in the Chicxulub and Ries impact structures: What is a crater floor? , Europlanet Science Congress 2020, online, 21 Sep–9 Oct 2020, EPSC2020-928, https://doi.org/10.5194/epsc2020-928, 2020.
The upper portion of the lunar highland crust is known to show a wide range of porosities between 3 and 23% (Wieczorek et al., 2013). Impact cratering seems to be the primary mechanism for the porosity structure of the lunar crust as it can be observed today.
As demonstrated in previous work by Soderblom et al. (2015), impact cratering changes the initial porosity structure of the upper crust. Considering the Bouguer gravity signal of lunar complex craters, it was shown that preimpact porosity of the target material controls the magnitude of the postimpact Bouguer gravity anomaly. Impacts in targets with initially low porosity were found to result in a negative Bouguer anomaly (indicating a higher porosity after impact). In contrast, impacts in target materials with high porosity result in positive Bouguer anomaly (indicating a lower final porosity). To avoid the contribution of the gravity signal caused by the uplift of mantle material, their study concentrates on complex craters with diameters smaller than 200 km.
We compute a global map of crustal porosity in high spatial resolution (analysis region of 3° and grid size of 0.75°), using most recent Gravity Recovery and Interior Laboratory (GRAIL) mission gravity field model, developed to degree and order 1500 (Park et al., 2015). By filtering the long wavelength portion of the measured gravity signal, our results are independent from bending of the crust-mantle boundary, allowing us to investigate the porosity of impact basins with diameters larger than 200 km.
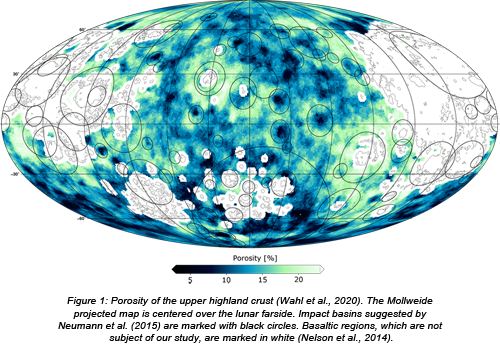
In a first step, bulk density was estimated by analyzing the correlation between Bouguer gravity and topography. Using only the short wavelength portion of the measured gravity field signal and applying a Bouguer correction (using the correct bulk density), the result should be uncorrelated with the surface topography. Testing different densities for calculating the Bouguer correction and minimizing the correlation with topography, the bulk density of each small analysis region is determined. Relating the bulk densities with independently obtained grain densities, lateral variations in porosity of the upper crust are determined (Figure 1). Since the lunar maria possess a complex interior structure, with dense basalts (originating most likely from the upper mantle) overlying the anorthosite crust, we omit locations of basaltic maria in our consideration.
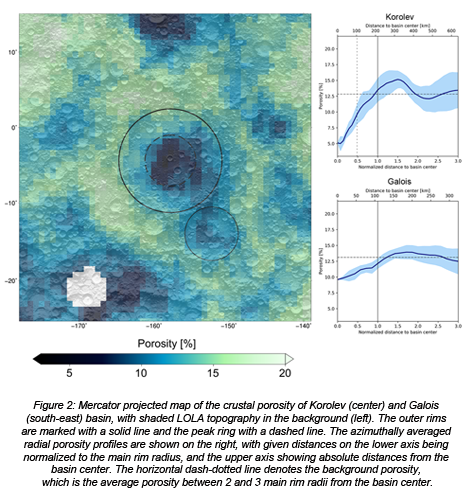
Overall, we studied the porosity of 40 individual impact basins located in the lunar highlands. Specifically, we compute azimuthally averaged radial porosity profiles. For many basins, we found distinct porosity signatures, with regions of low porosity (i.e., high compaction) in their center and high porosity about one crater radius from the center. Larger basins are found to show a stronger pronounced porosity signature than smaller basins. Higher porosities could be explained by a more extensive fracturing of the target rock, caused by a stronger shock wave and/or a thicker blanket of excavated material during crater formation. Compact material in basin centers could be associated with larger quantities and depths of impact melt. Some basins show a less distinctive and muted porosity pattern, which we attribute to postimpact modification by superposed large basins and craters (Figure 2). Moreover, even though the data statistics are limited, we tentatively identify a correlation between the porosity structure of impact basins and their relative ages. While older candidates show a less pronounced porosity signature with a lower porosity contrast, younger basins show the highest porosities near their rims and the lowest values interior to the peak ring. We relate the lower contrast for older basins to modifications through later impact events. We suggest that after formation all basins show a pronounced porosity signature, which is erased later, by subsequent large-scale impact events.
References:
Nelson et al. (2014) Mapping lunar maria extents and lobate scarps using LROC image products. LPSC Abstract #2861.
Neumann et al. (2015) Lunar impact basins revealed by Gravity Recovery and Interior Laboratory measurements. Science Advances, 1(9), 1-10.
Park et al. (2015) A high resolution spherical harmonic degree 1500 lunar gravity field from the GRAIL mission. AGU Fall Meeting, Abstract #G41B01.
Soderblom et al. (2015) The fractured Moon: Production and saturation of porosity in the lunar highlands from impact cratering, Geophys. Res. Lett., 42, 6939–6944.
Wahl et al. (2020) Crustal porosity of lunar impact basins. Journal of Geophysical Research: Planets, 125, 1-14.
Wieczorek et al. (2013) The crust of the Moon as seen by GRAIL. Science, 339, 671-675.
How to cite: Wahl, D., Wieczorek, M., Wünnemann, K., and Oberst, J.: Porosity Signature of Lunar Impact Basins, Europlanet Science Congress 2020, online, 21 Sep–9 Oct 2020, EPSC2020-280, https://doi.org/10.5194/epsc2020-280, 2020.
Introduction: The lunar surface is characterized by large impact basins that formed in the early history of the Moon. To better understand how basin size and their corresponding gravity signature are related to the impactor size and the thermal history of the Moon, we investigated how properties of impactor and target could affect this formation process. Impactor properties are defined by its size, density, and impactor velocity. The target is characterized by the crustal thickness and the thermal state. Previous studies (e.g.[1],[2],[3],[4]) revealed that thermal conditions in crust and mantle rocks affected the crater formation process, the final basin structure, and the gravity signature. Here, we present numerical simulations for 16 basins located on the lunar farside. The simulations are constrained by gravity data from the Gravity Recovery and Interior Laboratory (GRAIL) mission, and differ in impactor size, crustal thickness and target temperature as a function of depth. We established a relationship between the observed gravity, the geometry of the basin and the pre-impact thermal conditions of the target. These observations lead to a better understanding on how the thermal evolution of the Moon is related to changes in the formation of basins.
Methods: We used the iSALE2D shock physics code to simulate the basin formation process ([5],[6],[7],[8]). We used impactor sizes of 20km to 100km in diameter. The impactor speed was set to 13km/s. The resolution of all models was set to 25 cells per projectile radius (grid cell sizes from 400m to 2000m). The target was composed of a basaltic crust on top of a dunitic mantle. We changed the target properties by using two different crustal thicknesses (40km, 60km) and three temperature profiles which represent the Moon’s thermal states at 4.4, 4.1, and 3.8 billion years ago [9]. Gravity data from GRAIL mission [10] provides detailed information about the deep structure of lunar basins. By combining the most recent GRAIL gravity model GL1500E [11] with LOLA derived topography [12], we obtained a highly resolved Bouguer gravity field.
We assumed constant densities in both crust and mantle to calculate Bouguer gravity anomalies from the basin formation models. This approach can be understood as a simple way to mimic the density distribution after a long-term cooling process in the basin. The shape of the gravity signal preserves information about the position of the crust-mantle boundary and, therefore, assuming constant densities is useful in order to verify the geometry of the model.
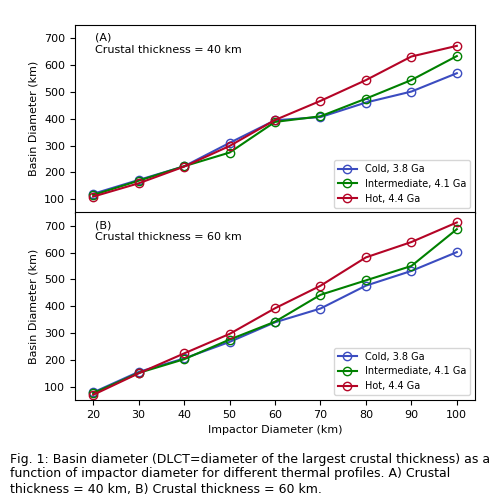
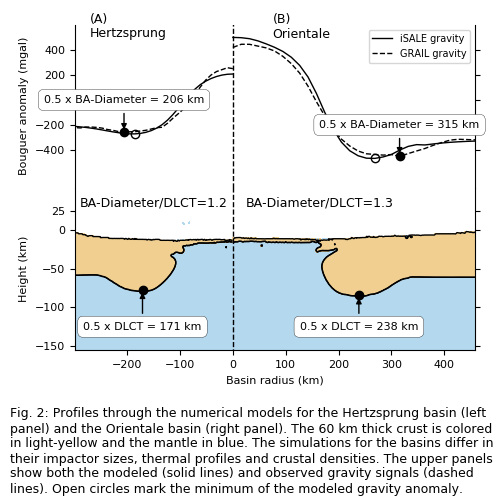
Results: For all 54 models we determined the diameter of the largest crustal thickness (DLCT) as a measure of the size of the basins. Figure 1 shows the relationship between impactor sizes and the DLCT for different temperature profiles and initial crustal thicknesses. The results show similar basin diameters for small impactors independently from the thermal profile. For impactor sizes larger than 40km (Fig.1A) or 30km (Fig.1B), the diameters of the hotter profile are significantly higher than those of the cold and intermediate profiles.
We present Hertzsprung and Orientale basin as two examples for gravity modeling. In the formation model of Hertzsprung (Fig. 2A), we used the thermal profile corresponding to an age of 4.1Ga [13]. Figure 2 shows our best-fit model assuming an impactor size of 60km, and a crustal density of 2950kg/m3. The results for Orientale are shown in Figure 2B. In the best-fit model the impactor is 80km in diameter, crustal density is 2750kg/m3 and we assume a cold thermal profile corresponding to an age of 3.8Ga [13]. Gravity profiles from the formation models show that the position of Bouguerminima correlate with the DLCT. The ratio of Bouguerdiameter and DLCT evaluates the fit of the models. A ratio of one indicates that the Bouguerminimum is close to the DLCT.
Conclusion: Our results agree with previous studies [4] in terms of the importance of the thermal state of the target material. Final crater morphologies are sensitive to the thermal conditions in the target material. In our study, temperature effects are visible in simulations with impactors larger than 40km and the change from intermediate to hot thermal states. Isostatic relaxation processes might further modify the initial gravity signature over time. The correlation between basin size and the position of the minimum in observed gravity is a powerful tool to predict impactor diameters without extensive modeling studies.
Acknowledgments: We gratefully acknowledge the developers of iSALE. Topography and gravity data are available at NASA’s PDS. This work is funded by the DFG-grant SFB-TRR 170 (A4). Katarina Miljković research is funded by the Australian Research Council.
References: [1]Ivanov, B., Melosh, H., and Pierazzo, E. (2010) Large Meteorite Impacts and Planet. Evol. IV,29-49. [2]Potter, R. W. K. et al. (2013) JGR:Planets,118,963-979. [3]Zhu, M.-H., Wünnemann, K. and Potter, R. W. K. (2015) JGR:Planets,120,2118-2134. [4]Miljković, K. et al. (2016) JGR:Planets,121,1695-1712. [5]Collins, G. S., Melosh, H. J. and Ivanov, B. A., (2004) Meteoritics & Planet.Sci.,39,217-231. [6]Wünnemann, K., Collins, G. and Melosh, H. (2006) Icarus,180,514- 527. [7]Thompson, S. L. (1990) Sandia National Laboratories Albuquerque, SAND89-2951. [8]Melosh, H. J. (2007) Meteoritics & Planet.Sci.,42,2079–2098. [9]Padovan, S. et al. (2018) EPSC,Abstract#755. [10]Zuber, M. T. et al. (2013) Science,339,668-671. [11]Park, R. S. et al. (2015) AGU Fall Meeting,Abstract#G41-B01. [12]Smith, D. E. et al. (2017) Icarus,283,70-9. [13]Orgel, C. et al. (2017) JGR:Planets,123,1-15.
How to cite: Lompa, T., Wünnemann, K., Miljković, K., Wahl, D., and Padovan, S.: Numerical modeling of farside impact structures on the Moon constrained by gravity data, Europlanet Science Congress 2020, online, 21 Sep–9 Oct 2020, EPSC2020-305, https://doi.org/10.5194/epsc2020-305, 2020.
1. Introduction
The returned lunar mare soil samples contain highland anorthosites [1]. The source of those non-mare component has been debated since the Apollo epoch ([2]-[9]). In this study, a numerical model was developed to trace the diffusion of non-mare material with the cumulative effect of impact mixing and intermittent filling of mare material.
2. Model
In our previous work [10], a spatially-resolved numerical model was developed to investigate the diffusion of impact melts through impact mixing using the Monte Carlo method. In this study, we extend the capabilities of the model and take into account the volcanic basin infilling forming the lunar mare regions.
2.1 Ejecta distribution
The thickness distribution of proximal ejecta with distance from crater center (r) conforms to a power law, typically: δ(r) = Ar-3 [11]. Since the distal ejecta would fade into the background with continuous impact mixing and the thickness distribution becomes more uniform, we assume that the distal ejecta is also continuously distributed, and the thickness is calculated based on the extrapolated power law. Given the value of the minimum deposit thickness (0.01 m), the ejecta coverage range of each impact event can be calculated.
2.2 Melt volcanic filling
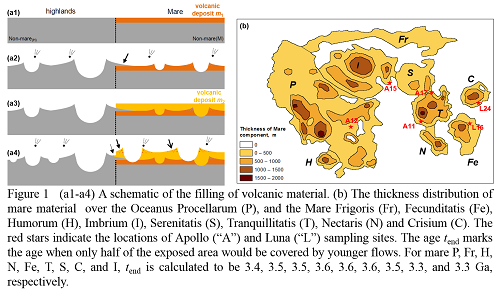
The qualitative eruption features of volcanic history of the Moon were pictured showing a trend of eruption flux from high to low but with different peak times [12]. The thickness distribution of volcanic deposits was systematically studied using crater-geometry techniques pioneered by De Hon (Figure 1b, HDeHon). For each mare region, the areas showing the thickest mare deposit are flooded first. As time goes on, mare material accumulates according to the eruption flux. The surrounding areas of thinner mare deposit are subsequently flooded. After the deposit of the youngest volcanic eruption, the thickness of volcanic deposit corresponds to HDeHon. A time step of 0.01 Ga is used to simulate such continuous eruption. At each step, the mare filling occurred within a certain contour region is taken to be uniformly emplaced (Figure 1a). Volcanic eruptions are assumed to initiate soon after the formation of the respective basin. Due to the great volume and the large flooding areas, only the early eruptions are considered [12]. The rough cessation time of the main filling (tend, Figure 1b) among different mare regions is determined based on the areas of differently-aged mare units.
3. Results and discussions
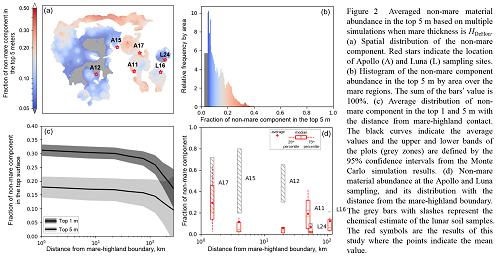
Given the uncertainty in the flux of mare filling, simulations with the varying setting of mare fillings are run to investigate the major factors affecting the non-mare mixing. Figure 2 shows the results when the mare thickness, cessation time of the major mare filling, and the peak time of eruption are taken to be HDeHon, tend and 3.8 Ga, respectively. By taking an average of the results from multiple simulations where the spatial configuration of generated craters is different, the regional differences are averaged out and the general features of non-mare material concentration are obtained. It shows that throughout the mare regions the non-mare component is present. The older mare surfaces accumulate more non-mare material. If most of the mare regions have filled mare material about 500 m in thickness since the formation of basins, the average and median fractions of non-mare components over all the mare regions are both ~0.1. In the top 5m, the average fraction of the non-mare material within 100 km is both about 0.2; between 100 km and 200 km, the non-mare abundance quickly decreases. In the very top surface (1 m) the non-mare abundance is greater. Apollo 11, 17 and Luna 16 located in the relatively old mare regions have the higher abundance of non-mare components (up to ~0.3). The Apollo 15, 12, and Luna 24 sampling sites located in the relatively young mare regions have a less non-mare component (~0.1).
By comparing the background composition with the geochemical analysis of the lunar mare soil samples, we infer the most plausible geologic processes that have significantly altered the material composition at the sampling sites: for the Apollo 15 and 17 mare soil samples, the large fraction of non-mare material is likely to have resulted from the downslope slumping or lateral transport of the nearby massifs. The Apollo 12 sampling site has a component of Copernicus ejecta. A mixing of both Copernicus ejecta and excavated local underlying material by high-velocity ejecta has altered the composition at the surface. The non-mare material contained in the Apollo 11 and Luna 24 mare soil samples could have been built up gradually by both long-time lateral and vertical mixing. The mare deposit at the Luna 16 landing site is likely to be relatively thin resulting in the abundant local-origin non-mare component.
4. Conclusions
A spatially-resolved numerical model tracing the diffusion of non-mare material was developed to study the source of the non-mare component in the lunar mare soil samples. We find that almost the entirety of the lunar mare regions contains some non-mare components. If the mare thickness is ~500 m, half of the areas possess a fraction ranging from 0.05 to 0.15. By comparing our results with the analysis of the collected soil samples, the most plausible geologic processes that may have altered the non-mare material abundance at the sampling sites are inferred.
References
[1] Wood J.A. (1970), JGR; [2] Rhodes J.M. (1977), Phil Trans Math Phys Eng Sci, 293-301; [3] Simon S.B. et al. (1982), LPSC, 371-388; [4] Huang Y. et al. (2017), JGR-Planets, 1–23; [5] Head J.W. (1982), The moon and the planets, 26(1), 61–88; [6] Budney C.J. and Lucey P.G. (1988), JGR-Planets, 103(E7), 16855–16870; [7] Evan A.J. (2016), GRL, 43(6), 2445–2455. [8] Aridson R. et al. (1975), The Moon, 13(1–3), 67–79; [9] Hörz, F. (1978), LPSC, 3311–3331; [10] Liu T. et al. (2020), Icarus, 113609. [11] Melosh, H.J. (1989), Oxford University. [12] Head J. W. and Wilson L. (1992), Geochim. Cosmochim. Acta, 56(6), 2155–2175.
How to cite: Liu, T., Michael, G., Zuschneid, W., Wünnemann, K., and Oberst, J.: Lunar megaregolith mixing by impacts: Evaluation of the non-mare component of mare soils, Europlanet Science Congress 2020, online, 21 Sep–9 Oct 2020, EPSC2020-186, https://doi.org/10.5194/epsc2020-186, 2020.
1. Introduction
Lunar meteorites constitute direct, varied samples of the materials forming the lunar surface, allowing to study its bulk chemistry, mineralogy and even geological history. The study of these meteorites not only sheds light on the composition of the Moon but also on its formation and the origin of the Solar System itself. Nowadays we know that these Lunar rocks are delivered to Earth in relative short timescales after being ejected by the impact of an asteroid or a comet from the lunar surface. So far, no lunar meteorite has ever been associated with a crater, not even has been witnessed to fall on Earth [1].
The atmosphere of the Moon is extremely thin, being unable to decelerate particles that are either impacting or escaping from the Moon [2]. It is due to the impact of these high-velocity projectiles that some lunar rocks can be ejected with a velocity above the escape velocity of the Moon (2.38 km/s) [3]. When a projectile of a certain mass impacts the surface of the Moon excavates an impact crater and releases a mass between 3-4 orders of magnitude higher than the projectile mass [3, 4]. Most of the ejected mass falls near the crater and forms continuous ejecta blankets, while the rest follows an impact trajectory far away from the initial impact, while a small part of the ejecta achieves enough velocity to escape the Moon [3, 4]. Our study focuses on the dynamic evolution of these Lunar rocks once they left our satellite, and their ability to reach the Earth as meteorites.
2. Methodology
This study simulates trajectories of lunar ejecta to explore which parameters influence on their fate (impactor/survivor) and their transfer time using the Mercury 6 software [5]. It has been built upon the results and possible time limitations of a previous study [6]. Ejecta trajectories are calculated with a simplified Solar System model (Earth-Moon-Sun) when time scales are below 1000 years (short transfers). Beyond this value (long transfers, up to 100,000 years), secular perturbations caused by near-by planets are no longer negligible [7] and an 8-planet Solar System model needs to be implemented. Particles found in the vicinity of Earth, at a maximum of 10 Earth's Hill radii, are considered to be in geocentric orbit while those beyond belong to heliocentric orbits. The parameters changed in each simulation were: the local azimuth angle and elevation, launch velocity and the date of the launch. Additionally, the orbital parameters compiled and studied to understand the ejecta evolution and delivery time to our planet.
We have also analyzed a case study corresponding with the impact flare recorded on Sept. 11th, 2013 at 20h07m28s.68 UTC by two telescopes in Seville, Spain (37.34611ºN, 5.98055ºW) provoked by the impact of a meteoroid on the surface of the Moon [8]. The impact was located in the west region of the Mare Nubium, at 17.2ºS 20.5º W (selenographic coordinates). We performed a simulation with 360 particles launched across an arc of 360º from the Mare Nubium impact point, ejected at 45º with respect to the local vertical and with a launch velocity 2.6 km/s. The particle's evolution was then propagated until 104 years to get information about the delivery efficiency, and common timescale.
3. Results
In general we noticed that most ejecta are reaching the Earth in particularly short timescales, between a few days and 10 years. For this fast transfers, predicting if the ejecta will become a future impactor depends only on the launch angle and ejection velocity. Parameters at launch have less and less influence on the fate of the ejecta as time increases. For delivery timescales larger than 1000 years any particle may collide with Earth regardless of its launch angle. The evolution of the main orbital elements for a typical long case is described in Fig. 1. The peak of accumulated collisions shifts to a lower launch velocity at 2.4 km/s.

Figure 1. Evolution of a lunar ejecta impacting with Earth in 7500 years. Stability periods correspond to heliocentric stages (yellow), perturbations occur in geocentric stage (blue).
In general, the orbital elements (a, e, i) present higher oscillations during geocentric orbits than during the heliocentric orbit stages. However, the orbital elements of survivor particles and those of the impactors remain indistinguishable before the impact event.
Concerning the impact event occurred on Sept. 11th, 2013 our simulation shows that most rocks reach Earth is relatively short timescales (Fig. 2). A significant number of rocks reach our planet during the first decade after the impact. As a future work we wish to quantify the geometric entry circumstances and the geocentric velocity for selected cases to get clues to better identify these rare fireballs among the heliocentric population.

Figure 2. Sept. 11th, 2013 simulation: number of collisions with Earth over time.
Conclusions
The parameters that influence on the fate of the Lunar ejecta (short transfers) are:
- Launch velocity: accumulated collisions with Earth reach a peak for velocities between 2.6 and 2.7 km/s. For these values nearly 20% of the original ejecta population has impacted with Earth in the first 100 years.
- Launch angle (relative angle between launch velocity and lunar velocity): This angle results from the combination of local azimuth, local elevation and particular launch site. When its value is ≈120º or above ejecta escape the Moon's gravity with barely any velocity left and eventually “fall” due to Earth's pull.
- Ejection angle: default is considered at 45º. Its variation only influences Earth collisions for peak collision velocities (between 2.6 and 2.7 km/s) when launches are towards the East or the West (in selenographic coordinates).
Acknowledgements
The authors acknowledge financial support from the Spanish Ministry (PGC2018-097374-B-I00, PI: JMTR).
References
[1] Korotev R. L. (2005) Chemie der Erde 65, 297–346.
[2] Fritz, J. (2012) Icarus. 221, 1183–1186.
[3] Artemieva, N. A. and Shuvalov, V. V., (2008) Solar System Res. 42, 329–334.
[4] Melosh, H. J.,, Oxford University Press, 1989.
[5] Chambers, J. E. (1999), MNRAS 304, 793–799.
[6] Gladman, B. J., PhD thesis, 1996.
[7] Galibina, I. V. and Terenteva (1982), A. K., AVest , 15, 132–137
[8] Madiedo, J. M. et al. (2015) MNRAS 439, 2364– 2369.
How to cite: Mas-Sanz, E., Trigo-Rodríguez, J. M., and Peña-Asensio, E.: A dynamic study of the post-impact transport of Lunar rocks to Earth and its application to the Sept. 11th, 2013 impact, Europlanet Science Congress 2020, online, 21 Sep–9 Oct 2020, EPSC2020-592, https://doi.org/10.5194/epsc2020-592, 2020.
A key uncertainty in our understanding of crater populations is the number and spatial distribution of secondary craters, which can contaminate and artificially increase the number of observed impacts, especially at sub-km diameter ranges [1]. Constraints to this unknown have been derived from two branches of work, or in combination. One is physical modelling, in which simulations and our understanding of impact process dynamics provide estimates of the size, number and trajectory of secondary impactors produced by the primary [2]. The other uses visuospatial studies, wherein experts attempt to identify and count craters thought to be secondaries, and use these to produce bounds on the number of secondaries produced by a specific primary crater [3], [4]. In this work, we propose a third approach which we hope to use to further quantify the extent of the secondary crater population on Mars, in a way that is as independent as possible of previous estimates.
We propose to use spatial statistics and stochastic modelling across a large region of Mars in order to decouple the primary and secondary populations, using some simple assumptions about the nature of the two overlapping distributions. First, the primary distribution is---although locally random---constant over the region of interest. Second, the secondary crater population can be modelled as a 2-dimensional normal distribution emanating from each primary crater, with a standard deviation much smaller than the dimensions of the region of interest. With these assumptions, we can then model the total distribution with only a few parameters: The primary distribution, the number of secondaries produced by a primary of a given size, and the standard deviation of the secondary craters' distance from their parent.
Given the importance of a uniform primary population for our method to work, we have selected Isidis Planitia as our study site. This large, flat plain is remarkable in its geological consistency, and is thought to be the basin of a large impact in the Noachian period. The surface we see today, excluding overlaid impact sites, is a single geological unit, with an estimated age of 2.8 Gy [5]. In total, it covers roughly 6 million km2.
The huge quantity of craters required for a method such as this to be successful has necessitated the use of automated detection. We have refined the Mask R-CNN architecture [6]---widely used for instance segmentation tasks---in order to detect craters. Trained on a variety of different Martian crater datasets, we have used this model to produce the most numerous crater survey to date over the Isidis Planitia region of Mars (see Figure 1). With these data, we will attempt to use statistical analysis to empirically estimate the number of expected secondaries, and their spatial distribution, for a primary of a given size.
We hope that our results will further constrain the processes governing the production of secondary craters. In the future, this method could be straightforwardly applied to other regions of Mars, as well as the Moon, to see how the atmosphere and a surface's geology affects secondary craters.
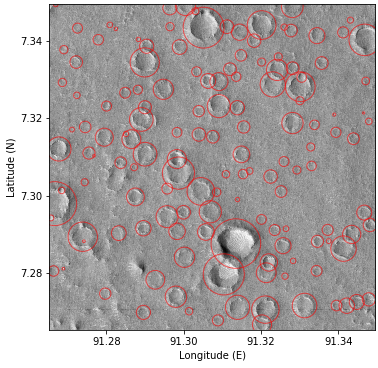
Figure 1: Automatically detected craters over Isidis Planitia, using CTX imagery. Diameters are enlarged so that crater candidates can be seen more clearly.
[1] Williams, J.P., van der Bogert, C.H., Pathare, A.V., Michael, G.G., Kirchoff, M.R. and Hiesinger, H., 2018. Dating very young planetary surfaces from crater statistics: A review of issues and challenges. Meteoritics & Planetary Science, 53(4), pp.554-582.
[2] Watters, W.A., Hundal, C.B., Radford, A., Collins, G.S. and Tornabene, L.L., 2017. Dependence of secondary crater characteristics on downrange distance: High‐resolution morphometry and simulations. Journal of Geophysical Research: Planets, 122(8), pp.1773-1800.
[3] McEwen, A.S., Preblich, B.S., Turtle, E.P., Artemieva, N.A., Golombek, M.P., Hurst, M., Kirk, R.L., Burr, D.M. and Christensen, P.R., 2005. The rayed crater Zunil and interpretations of small impact craters on Mars. Icarus, 176(2), pp.351-381.
[4] Robbins, S.J. and Hynek, B.M., 2011. Secondary crater fields from 24 large primary craters on Mars: Insights into nearby secondary crater production. Journal of Geophysical Research: Planets, 116(E10).
[5] Ivanov, M.A., Hiesinger, H., Erkeling, G., Hielscher, F.J. and Reiss, D., 2012. Major episodes of geologic history of Isidis Planitia on Mars. Icarus, 218(1), pp.24-46.
[6] He, K., Gkioxari, G., Dollár, P. and Girshick, R., 2017. Mask r-cnn. In Proceedings of the IEEE international conference on computer vision (pp. 2961-2969).
How to cite: Francis, A., Crawford Clarke, R., Sidiropoulos, P., and Muller, J.-P.: Towards a Statistical Analysis of Secondary Cratering Rates over Isidis Planitia, Mars, Europlanet Science Congress 2020, online, 21 Sep–9 Oct 2020, EPSC2020-717, https://doi.org/10.5194/epsc2020-717, 2020.
Introduction
Impact craters are widely used to investigate the geologic history of planetary surfaces. For example, their morphology bears clues on past surfaces processes that affected the surface such as erosion, sedimentary deposit and volcanic processes. One of the most interesting use of impact craters is the dating of planetary surfaces using their size frequency distribution (Hartmann and Neukum 2001; Stöffler and Ryder 2001; Young 1940). This method has been used in almost every study that provide an age for geologic bodies other than Earth.
If lunar crater size frequency distributions are most often pristine, craters on many other bodies are degraded over time. Hence crater size frequency distributions often present a depletion of small craters compared to the lunar ones. Mars is a good example of this phenomenon that has been named Opik effect (Opik 1966). Taking into account crater degradation when dating planetary surface will not only improve this method, but also provides new insights into the geological processes which resulted in the crater degradation.
In this study we combine statistic and morphology of craters in order to investigate the timing and intensity of surface processes. We introduce the notion of crater size and depth frequency distributions, adding a dimension to classic size and depth frequency distribution. Using crater chronology models, those crater size and depth frequency distributions can be interpreted in term of crater depth depletion speed that we refer as crater obliteration.
Method
Craters populations are already widely referenced. On Mars, Robbins & Hynek, 2012 proposed a huge crater database that they estimate complete down to 1 km of diameter. In this database, most craters above 6 km of diameter are provided with a morphology. We computed crater depth from the elevation of the floor and the median elevation of the rims.
Crater size and depth frequency distribution are then constructed using probability density distribution as recommended by Robbins et al., 2018. Each crater is convoluted by a 2D gaussian determined by the analytical error on the measured depth and diameter.
Assuming that the deepest craters are the freshest ones, we used crater chronology models (Ivanov 2001; Neukum, Ivanov, and Hartmann 2001) to associate a depth for each diameter and age (Figure 1). For each diameter, we then derivate depth according to age to compute obliteration.
We observe strong noise at the limit of the distribution, that cause an increase in computed obliteration for recent ages. This is caused by the spreading of the crater size and depth frequency distribution beyond the observed craters as a result of convolution. To remove this bias, we only keep obliterations measured when the model number of crater is more than 5.
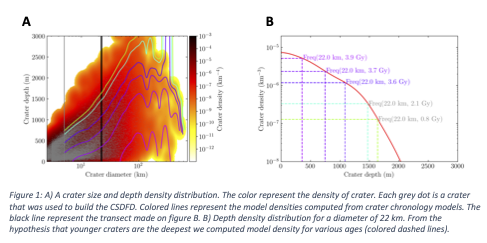
Results
From Robbins & Hynek, 2012 crater databases, we computed crater size and depth frequency distribution for geologic areas of Mars simplified from the geologic map of Tanaka et al., 2014. We computed obliteration rates from those
We presents here the obliterations rates obtained for 3 Martian geologic areas, namely the Southern Highland, Tharsis Province and the Hesperian lowlands, that illustrate our main results.
Only the most cratered surfaces, such as the Southern Highlands present a number of craters large enough to investigate Noachian obliteration rates (Figure 2). During this era, obliteration rates reach several thousands m/Gy, but rapidly decrease during early Hesperian and are close to 0 during Amazonian.

Volcanic provinces such as Tharsis, Isidis and Elysium present obliterations rates more important than the rest of the planet during Hesperian. This suggest that our method is sensitive to volcanic activity. We show here the example of the province of Tharsis (Figure 3), where obliteration rates decreased slower than on the rest of the planet, suggesting a persistence of volcanic activity until early Amazonian.

Northern lowlands witness Amazonian obliteration rates one order of magnitude higher than the rest of the planet (Figure 4). This observation is still under further investigation, but may suggest a continuous emplacement of geologic material during middle Amazonian which may be related to Vastitas Borealis Formation.

We have developed a new method to model crater distribution and degradation taking into account of the size and depth of impact craters. Using this model, we were able to retrace the variations of crater obliteration through Martian era, and provide insight into the geological processes dominating crater degradation. The method with additional inputs from crater depths provides novel insights into the geological processes dominating crater degradation at different epochs in Martian history. Combined with higher resolution datasets, this method has potential to be applied to understand regional geological processes on Mars and other planetary bodies.
Bibliography
Hartmann, William K., and Gerhard Neukum. 2001. “Cratering Chronology and the Evolution of Mars.” Space Science Reviews 96(1–4): 165–94.
Ivanov, Boris A. 2001. “Mars/Moon Cratering Rate Ratio Estimates.” Space Science Reviews (November 2000).
Neukum, Gerhard, Boris A. Ivanov, and William K. Hartmann. 2001. “Cratering Records in the Inner Solar System in Relation to the Lunar Reference System.” Space Science Reviews 96(1–4): 55–86.
Opik, E. J. 1966. “The Martian Surface.” Science 153(3733): 255–65. http://www.sciencemag.org/cgi/doi/10.1126/science.153.3733.255.
Robbins, Stuart J. et al. 2018. “Revised Recommended Methods for Analyzing Crater Size-Frequency Distributions.” Meteoritics and Planetary Science 53(4): 891–931.
Robbins, Stuart J., and Brian M. Hynek. 2012. “A New Global Database of Mars Impact Craters ≥1 Km: 1. Database Creation, Properties, and Parameters.” Journal of Geophysical Research E: Planets 117(5): 1–18.
Stöffler, D., and G Ryder. 2001. “Stratigraphy and Isotope Ages of Lunar Geologics Units: Chronological Standard for the Inner Solar System.” : 9–54.
Tanaka, Kenneth L. et al. 2014. “Geologic Map of Mars.” USGS.
Young, J. 1940. “A Statistical Investigation of Diameter and Distribution of Lunar Craters.” Journal of the British Astronomical Association.
How to cite: Breton, S., Quantin-Nataf, C., and Pan, L.: Estimating crater obliteration rate through crater depth statistics, Europlanet Science Congress 2020, online, 21 Sep–9 Oct 2020, EPSC2020-823, https://doi.org/10.5194/epsc2020-823, 2020.
Introduction: The knowledge of impact craters age constellating planetary surfaces is a crucial information involved in the understanding of the geological history of planetary bodies and more specifically on erosion rates measurements, meteorites ejection, impact flux evolution and the loss of magnetic field. The derivation of their age is currently performed through manual crater counting but this method is limited to small and/or young surfaces and in the case of the derivation of crater emplacement age, to a small set of impact craters. Here we used a Crater Detection Algorithm developed by [1] to solve this issue.
Automatic crater detection: We used the HiRISE mosaic [2] covering a part of the Jezero crater where 1624 craters have been manually identified. Our model has then been applied over the CTX global mosaic [2] covering the ejecta blanket of 10 large impact craters whom the emplacement age has been estimated in other studies. Our CDA detected 129,799 small impact craters larger than 70m in diameter superposed on their blanket. A visual inspection of the CDA results reveal the presence of a non-negligible portion of secondary craters (fig.1). Mainly circular, these secondary craters are identifiable due to their clustered spatial distribution. In order to automatically reproduce manual counting avoiding clusters of secondaries, we developed an Algorithm for the Identification of Secondary Crater (ASCI) inspired from already published technique [3, 4, 5] based on cluster analysis technique.
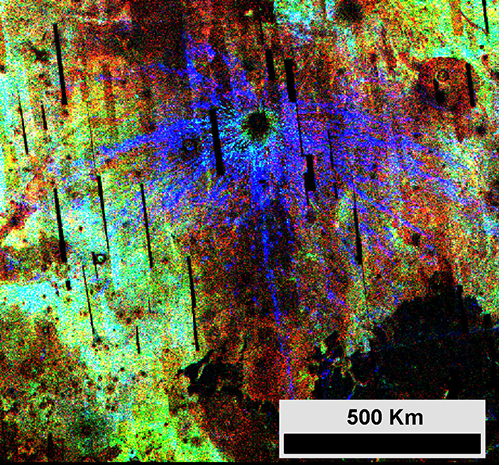
Figure 1: Mars crater detection map (RGB based on size). The blue rays correspond to 800,000 small impact craters (25m - 50m in diameter).
Secondary craters identification: A Voronoi polygons (VPs) tessellation is computed over a crater population detected on a counting area where the cratering density should be homogeneous.
The size-frequency distribution (SFD) of VPs is then calculated and compared to those produced by 300 different impact crater population containing the same number of craters than the data, whom the position is randomly generated. The mean and the standard deviation of these VPs SFD are calculated (fig.2.a).
The intersection between the VPs SFD from the detected crater and those from the simulated population at +1σ correspond to the threshold value polygon size from which all detected craters located inside a VP whom the size is below this threshold are considered being clustered [5] and therefore from a secondary origin (fig.2.b). All of these detection are removed from the crater population used to date as well as their associated VP. The crater count area is finally recalculated taking into account the removing VPs.
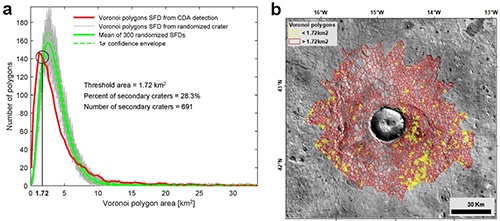
Figure 2: ASCI process and results. a: simulation of 300 random VPs on the Arandas ejecta blanket. b: Distinction between VPs associated to crater clusters, considered here as secondaries and those outside of clusters according to the threshold area determined by ASCI.
Model age results: Red curves on figure 3 correspond to the Poisson probability density function (PDF) of the age derived from Craterstats II [6] without the using of the ASCI while green curves are the PDF of ages using the ASCI. Blue bars correspond to the model age reported in the literature, converted into the Hartmann (2005) CS [7] if necessary. The relatively slight difference observed between the ages derived in this study and those using manual count suggest that the technique is valid for this set of Martian craters. The results are even closer from the reported age using the ASCI. The inclusion of primary craters into crater clusters identified by the ASCI that have been then removed is one of the disadvantage of this technique. It is expected that a run of the ASCI considering an area where the crater clusters dominate the entire crater population, within a crater cluster, on a too small area or exhibiting a too low number of impact craters would lead undoubtedly to an obvious secondary craters identification bias. We therefore catch the reader attention on the fact that the technique presented here should not be blindly used and should always be accompanied by a careful inspection of the automatic detection crater population and the results of its filtering using the ASCI.
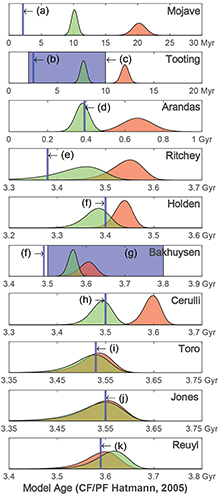
Figure 3: Model ages derived for each crater with and without using the ASCI, respectively the green and the red curves. Blue bars corresponds to the age reported in the literature. (a) Werner et al., 2014 ; (b) Mouginis-Mark et al., 2012 ; c) Hartmann et al., 2010 ; (d) Lagain et al., 2020 ; (e) Sun & Miliken, 2014 ; (f) Robbins et al., 2013 ; (g) Tornabene et al., 2012 ; (h) Berman et al., 2011 ; (i) Fairen et al., 2010 ; (j) Mangold et al., 2012 ; (k) Vijayan et al., 2020.
Conclusion: Used by following advices stated in the previous section, the automatic crater count using our CDA coupled to a cluster analysis aiming to remove potential secondary crater clusters contamination (ASCI) is a powerful tool allowing to generate consistent isochrones for surfaces of Mars even in a context of secondary crater contamination. The combination of both tools offer thus a way to access to the emplacement age of many impact craters. This can be used to investigate potential temporal fluctuation in the size frequency distribution of impact craters on the surface of Mars. Applied to other geological structures, this can also be used to the reconstruction of the geological history of a portion of the Martian surface at a regional scale. The ASCI will be released as a toolbox implementable to ArcMap (ESRI).
References: [1] Benedix, G. K. et al., 2020, ESS, 7, e2019EA001005. [2] Dickson, J. L. et al., 2018, 49th LPSC, Abstract #2480. [3] Michael, G. G. & Neukum, G., (2010), EPSL, 294, 223-229. [4] Salih, A. L. et al., 2017 Int. Arch. Photogramm. Remote Sens. Spatial Inf. Sci., XLII-3/W1, 125-132. [5] Andronov, L. et al., 2016, Nature, Sci. Reports, 6, 2045-2322. [6] Michael, G. G. et al., 2012, Icarus, 218, 169-17, [7] Hartmann, W. K. (2005) Icarus, 174, 294–320.
How to cite: Lagain, A., Servis, K., Norman, C., Benedix, G., and Bland, P.: Automatic Crater Counting: Model Ages Derivation of Large Martian Impact Craters., Europlanet Science Congress 2020, online, 21 Sep–9 Oct 2020, EPSC2020-477, https://doi.org/10.5194/epsc2020-477, 2020.
Abstract
JUICE, JUpiter ICy moons Explorer, the ESA mission planned to be launched in 2022 and to arrive at Jupiter in 2029, will make detailed observations of Jupiter and three of its largest moons. One of its goals is to improve the current estimates of Ganymede surface age. As part of the future activities, we make new crater counts to be then used to refine current Ganymede crater-based chronology.
Impact craters are one of the most important landforms on planetary bodies with a solid surface (e.g., [2]). Crater morphology and their characteristic ejecta blankets of excavated materials provide important constraints to crustal stratigraphy, and variations of rheology with depth. Planetary landscapes exhibit a large number of impact craters, of very different size. Crater morphological “freshness” may represent a first qualitative hint to the relative ages of individual craters, while the quantitative analysis of impact crater populations is the primary tool to derive absolute ages of planetary and small body terrains.
One of the most commonly used chronological model was initially developed for the Moon and is based on relating crater counts at the Apollo/Luna landing sites to radiometric ages of the collected samples [4]. The lunar chronology has been then extrapolated to other planetary bodies, including the Galilean satellites (e.g., [3]), by making a number of assumptions including the source of the projectile population. Specifically for the Galilean satellites, other chronologies based on current estimates of the impact flux have been derived [8]. All these chronologies, however, suffer from a limited understanding of the variation of the impact flux with time for the Galilean system.
The aim of this project is to i) derive a revised crater counts for Ganymede, and ii) improve Ganymede crater chronology using the most updated understanding on the current and historical impact flux resulting from recent dynamical models. In this work, we will present our preliminary result in developing a newer crater database on Ganymede.
Ganymede was observed firstly by Voyager 1 and 2 in 1979, and then by Galileo between 1996 and 2000 through six flybys, which revealed that the surface has two main types of terrains, which differ in albedo, crater density, and surface morphology [6]. The first one, the “dark” terrains, is low albedo terrains, covered by regolith material, and heavily cratered. The second one, the “light” terrains, has higher albedo and lower crater density, suggesting a younger age. They can occur as smooth elongated and polygonal shaped areas, or as grooves. An accurate chronology for Ganymede can therefore provide information about resurfacing and the evolution of the surface, including the extent of the cryovolcanism [5].
The present global image mosaic of Ganymede is available at a resolution of ~1 km/pixel. Being only 74% of the surface at a resolution better than 2 km/pixel, either image resampling or degradation was applied [1], [6]. We select the areas of Ganymede acquired at the highest resolution (<100 m/pixel).
On the existing global geological map [1], [6], we performed cartographic refinement to better define the contours of the geological units used in this study. Crater counting is then performed by selected impact structure by means of photo-interpretation (e.g., primary vs secondary, degradation degree, peculiar morphology, ejecta blanket, etc.).
As case study, we report the crater count performed in Harpagia Sulcus, east of the prominent crater Enkidu, which gives an example of smooth material, fine material, and slightly grooved material [6]. The image data was ~116 m/pixel. The total number of the impact structures is 2657, 841 of which are considered bonafide “primary” craters (cf. Figure 1).
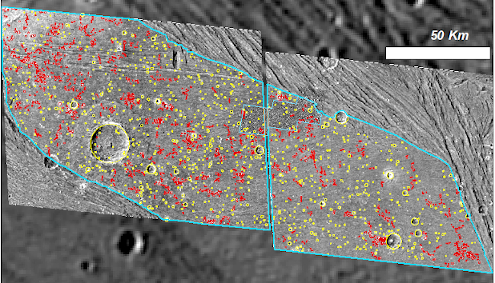
Figure 1. Crater counts performed in Harpagia Sulcus: Primary craters (yellow), and Secondary craters (red).

Figure 2. Cumulative size frequency distribution of the primary craters measured in the larger area (red) at 116 m/pixel, and in the smaller 16 m/pixel area (green).
A small selection of the studied area was available also at very high resolution (~16 m/pixel, blue polygon in Figure 1). We performed there an additional crater counts, finding 1575 impact structures, 619 of which are primaries. Comparing the two cumulative distributions of the primary craters (Figure 2), we found that a minimum resolution of 7 pixels is necessary to correctly detect primary craters from false crater-like features (circular features with an inner shade).
This study highlighted how a minimum crater diameter threshold of the order of ten pixels would be opportune to adequately develop crater statistics.
We obtained as cumulative number at 1 km N(1)~6×10⁻³. A previous study of [7] found N(1)~4×10⁻³ for similar aged terrains (Harpagian terrains, which are based on the bright tectonically resurfaced materials in Harpagia Sulcus).
This crater database and the new chronology model will improve our understanding of the geological evolution of the Galilean satellites, and lead the way to future investigations of the Jupiter System by the ESA JUICE mission
Acknowledgements
The authors acknowledge support to the project under ASI-INAF agreement n. 2018-25-HH.0.
References
[1] Collins et al.: Global geologic map of Ganymede. U.S. Geological Survey Scientific Investigations Map 3237, scale 1:15,000,000, http://pubs.usgs.gov/sim/3237/, 2013.
[2] Melosh, H.J: Impact Cratering: A geologic Process. Oxford University Press, 245 pp., 1989.
[3] Neukum, G.: Cratering records of the satellites of Jupiter and Saturn. Adv. Space Res., Vol. 5, pp. 107–116, 1985.
[4] Neukum, G., and Ivanov, B.A.: Crater size distribution and impact probabilities on Earth from lunar, terrestrial-planet, and asteroid cratering data, in: Gehrels (eds), “Hazards Due to Comets and Asteroids”, UoAP, pp. 359–416, 1994.
[5] Pappalardo, R.T., et al.: Geology of Ganymede, in: Bagenal, F., Dowling, T., McKinnon, W. (eds), “Jupiter”, Cambridge University, Press, Cambridge, UK, pp. 363–396, 2004.
[6] Patterson, G.W. et al.: Global geological mapping of Ganymede. Icarus, Vol. 207, pp. 845–867, 2010.
[7] Wagner, R.J., et al.: The large bright ray crater Osiris on Ganymede: its age, role as a potential time-stratigraphic marker, and target for detailed imaging by the JUICE/JANUS Camera. EPSC Abstract, Vol. 12, EPSC2018-855, 2018.
[8] Zahnle, K., Dones, L., and Levison, H.F.: Cratering Rates on the Galilean Satellites. Icarus, Vol. 136(2), pp. 202−222, 1998.
How to cite: Martellato, E., Marchi, S., Galluzzi, V., Palumbo, P., and Rotundi, A.: Ganymede’s Cratering Record, Europlanet Science Congress 2020, online, 21 Sep–9 Oct 2020, EPSC2020-1088, https://doi.org/10.5194/epsc2020-1088, 2020.
Introduction: The Late Cretaceous Wetumpka impact structure is a marine-target crater located in central Alabama [1, 2]. The target region was comprised of weathered crystalline rock of the Piedmont metamorphic terrane, which was overlain by several tens of meters of poorly consolidated sediments, specifically the Upper Cretaceous Tuscaloosa Group and Eutaw Formation. The water depth is interpreted to have been approximately in the range of 35 to 100 m [1, 3]. Wetumpka averages about 5 km in diameter but it reaches a maximum NE-SW diameter of 7.6 km [1, 3]. Wetumpka’s surficial geology consists of a deformed, semi-circular, crystalline-rim, and a relatively lower relief area, composed by deformed sediments and mega-blocks from sedimentary and crystalline target rocks, as well as resurge chalk deposits [4]. It is noteworthy that Wetumpka impact structure has no evident central uplift, despite a diameter where such a feature is generally thought likely to develop [3, 5]. Wetumpka impact structure’s crater-filling materials have been investigated during field campaigns (1997-date) and core-drilling campaigns (1998 and 2009), which are briefly summarized below. A geophysical (i.e., gravity) profile, which lends insights into the deeper part of the crater fill not observed in the field or by drilling, is also summarized below.
Synopsis of field campaigns: The results of field studies at Wetumpka impact structure, which began in 1997 and continue to present, include the definition of three main impact-related terrains. These are impact structure crystalline rim, interior structure-filling unit, and the exterior disturbed terrain [1, 3, 4]. The impact structure rim is an asymmetrical feature that spans approximately 270 degrees of arc; open on the southern side. The width of the impact structure rim is not the same all around and neither is the orientation of constituent foliation within the rim [3, 4]. The interior structure-filling unit consists of broken sedimentary formations, which is a term that is intended to mean that the formations have been intensively deformed and in some instances disintegrated, yet these interior components are still recognizable as to formation of origin [3, 4]. The interior structure-filling unit has several distinctive components. In apparent order of formation during impact, these components are impactite sands, trans-crater slide unit, polymict boulder-bearing bed, and resurge chalk deposits. Impactite sands are monomict clastics that contain sedimentary target blocks; the trans-crater slide unit is related to the failure of the southern rim [3, 4]. The polymict boulder-bearing unit consists of shocked proximal ejecta and crystalline boulders up to 45 m in diameter [3, 5]. Resurge chalks are resedimented beds of Mooreville Chalk that contains fine ejecta components, and contain evidence of long-distance transport from the coeval shelf area (suggesting a turn-around of the original rim-wave tsunami). All these various interior-filling components comprise the upper few tens of meters of the Wetumpka impact structure’s interior structure-filling materials. The exterior disturbed terrain, which comprises a limited area outside the southern open area of the structure’s rim, consists of a target formations that are part of large slump blocks that appear to have rotated and moved toward the crater interior. In this regard, Wetumpka’s exterior disturbed terrain mimics the annular slumped feature at Chesapeake Bay impact structure [3, 4].
Synopsis of core-drilling campaigns: The 1997 drilling campaign consisted of drilling two central core holes to depth of approximately 200 m. Both drill cores showed approximately the same sequence: the lower 100 m of the drill cores is comprised of impactite sands, the middle part (~ 10 m) is impact breccia and crystalline blocks, and the upper part is broken sedimentary formations, which appear to be related to the trans-crater slide and the polymict boulder-bearing bed. The 2009 drilling campaign consisted of drilling four core holes of various depths ranging from ~ 30 to 215 m. One core was drilled in the crystalline rim, and one was drilled in the polymict boulder-bearing bed (~ 30 m). The other two were drilled in the interior crater-filling terrain. One of these drill cores penetrated ~ 25 m of resurge chalk and ~ 70 m of impactite sand; and the other drill core penetrated trans-crater slide unit (~ 15 m) and ~ 200 m of impactite sand. Therefore, of the five drill cores that penetrate materials of the interior crater-filling terrain, nearly all of the crater materials penetrated is of sedimentary target origin.
Overview of deeper crater-filling materials: Outcrops and cores drilled so far reveal some details of the upper ~ 200 m of the Wetumpka crater-filling materials, yet the crater bowl of Wetumpka is likely to have as much as 1 km of material within it. For insight about deeper crater-filling materials, some limited geophysical data are pertinent. A gravity model, based a single gravimeter-based, west-east, trans-crater profile, shows an interpreted cross section of the crater fill [6]. We suggest that the lower unit of higher density (2.6 g/cm3; not yet drilled) is likely composed of crystalline bedrock blocks or that it contains a much higher proportion of crystalline blocks than the upper unit. The implications of field, drill core, and geophysical analysis is that the sequence of events in the development of Wetumpka impact crater involved collapse of crystalline materials from the transient crater rim, which was followed in turn by collapse of a substantial volume of sedimentary rim materials (2.1 g/cm3).
References: [1] King D.T. Jr. et al. (2002) EPSL 202, 541-549. [2] Wartho J.-A. et al. (2012) MAPS 47, 1243-1255. [3] King and Ormö (2011) GSA SP 483, 287-300. [4] King D. T. Jr. et al. (2006) MAPS 41, 1625–1631. [5] King D. T. Jr. et al. (2015) GSA SP 518, 149-164. [6] Robbins E. A. et al. (2011) LPSC abst. no. 2732.
Acknowledgements: The authors are grateful to the CSIC financial support for international cooperation: I-LINK project LINKA20203 “Development of a combined capacity of numerical and experimental simulation of cosmic impacts with special focus on effects of marine targets.”
How to cite: King Jr., D. T., Ormo, J., Petruny, L. W., De Marchi, L., and Agrawal, V.: Crater-filling materials, Wetumpka impact structure, Alabama, Europlanet Science Congress 2020, online, 21 Sep–9 Oct 2020, EPSC2020-996, https://doi.org/10.5194/epsc2020-996, 2020.
Introduction: The Wetumpka impact structure is a Late Cretaceous marine-target crater located in central Alabama, USA [1][2]. The target region was comprised of weathered crystalline rock of the Piedmont metamorphic terrane, which was overlain by poorly consolidated sediments from the Upper Cretaceous Tuscaloosa Group and Eutaw Formation. The water depth is interpreted to have been approximately 35-100 m [1][3]. The current crater is heavily eroded and exhibits asymmetric rims, due to collapse of the southwest section, reaching a maximum NE-SW diameter of 7.6 km [1][3]. Wetumpka’s surficial geology consists of a deformed, semi-circular, crystalline-rim, and a relatively lower relief area, composed by deformed sediments and mega-blocks from sedimentary and crystalline target rocks, as well as resurge chalk deposits [4].
Not unlike other marine-target craters, the layer of sea water may have played an important role on Wetumpka’s crater unique features, such as the collapsed rim and the distinctive moat-filling sequence. The water may influence since early stages of crater formation, as transient crater depth and diameter, until late formation stages, as tsunami-influenced sediment transport and an aqueous-dominated, moat-filling sequence. This study aims to understand the effect of water depth, tsunami formation, and mechanical parameters of target materials, on crater development and final morphology.
Methodology: The formation of Wetumpka was simulated using iSALE-2D, an extension of the SALE hydrocode developed to model impact crater formation [5][6][7][8]. The current study focuses on an axisymmetric approximation of the original impact problem and a resolution of 32 CPPR (cells per projectile radius). A lower resolution simulation (9 CPPR) was also used to obtain a rough but faster estimate of the visible processes during the crater evolution. The main questions to be explored in this study are the influences of impact velocity, water layer, and target properties on crater formation.
The target consisted of three layers: (1) metamorphic bedrock as granite; (2) a layer of sediment as either wet tuff or quartzite; and (3) the topmost sea water layer. A spherical impactor of 400m diameter traveling at 12 and 20km/sec was considered. Simulations were achieved using different water depths (60m and 125m), different sediment material (quartzite and wet tuff) and thicknesses (100, 200, or 300m), while maintaining the impactor and target properties. Samples were collected from the crystalline rim for split-Brazilian and compressive tests as per ASTM standards to obtain better estimate of material parameters.
Results and Discussion: Three main processes were identified in 9 CPPR simulations: (1) crystalline rim collapse, (2) sedimentary rim collapse, and (3) tsunami resurge. For 32 CPPR simulations, a total of 24 distinct simulations were performed with different combinations of initial water depth scenarios (60m and 125m), impact speed (12km/sec and 20km/sec), sediment layer thickness (100, 200, and 300m), and EoS used for sediment (wet tuff and quartzite). Tensile and compressive strength values, obtained by split-Brazilian and compressive tests, were used to estimate cohesion (17.12 MPa) and friction angle (0.373) of metamorphic bedrock. These values were then used to set more realist input parameters for the 32 CPPR simulations.
While the simulations are ongoing, results are presented for approximately 70 seconds after the impact. The main differences observed between the simulations are connected to the impact velocity and sediment layer thickness. The higher velocity impact shows a maximum diameter of the transient crater developed by about 13 seconds, with an approximate 6 km diameter and 1.8 km depth. For the lower velocity impact, the maximum transient crater size was attained at about 10 seconds, with an approximate 5 km diameter and 1.5 km depth. In both cases, the rim started to collapse at about 25 seconds, and the ejecta curtain started to fall on top of the water layer, creating tsunami waves that move outwards. This turbulent flow carried sea floor sediments and blocks of the impacted target rocks, which are more abundant in the proximities of the crater.
Simulations with different sediment layer thickness show differences in the composition of the crater rim and upper crater wall. According to our simulations, the crater rim was composed mostly by sedimentary material that can extend to the upper crater walls. Thicker initial sediment layer result in greater areas of crater wall composed of sedimentary material.
Higher velocity simulations also show higher peak pressure and temperature, reaching about 47GPa and 7700K at 0.1 seconds, whereas lower velocity impacts produce peaks of about 42 GPa and 4500K. Temperature peaks act on a greatly small volume of rock on lower speed simulations. This could lead us to relate the lack of melt fragments in the crater area with the lower velocity impact.
References: [1] King D.T. Jr. et al. (2002) EPSL 202, 541-549. [2] Wartho J.-A. et al. (2012) MAPS 47, 1243-1255. [3] King and Ormö (2011) GSA SP 483, 287-300. [4] King D. T. Jr. et al. (2006) MAPS 41, 1625–1631. [5] Melosh H.J. et al. (1992) JGR 97, no. E9, 14735-14759. [6] Ivanov B.A. et al. (1997) Int. J. Impact Eng. 20, 411-430. [7] Collins G. et al. (2004) MAPS 39, 217-231. [8] Wunnemann K. et al. (2006) Icarus 180, 514-527.
Acknowledgements: The authors are grateful to the CSIC financial support for international cooperation: I-LINK project LINKA20203 “Development of a combined capacity of numerical and experimental simulation of cosmic impacts with special focus on effects of marine targets”.
How to cite: De Marchi, L., King, D., Ormö, J., and Agrawal, V.: Numerical and experimental analysis of the Wetumpka (Alabama USA) impact crater, Europlanet Science Congress 2020, online, 21 Sep–9 Oct 2020, EPSC2020-401, https://doi.org/10.5194/epsc2020-401, 2020.
The Lockne Crater and its smaller companion Målingen form the yet only confirmed impact structure from a binary, most likely of “rubble-pile” configuration, asteroid on Earth [1]. Both craters formed simultaneously in a shallow sea that allowed them to become very well preserved with most of the crater filling and near-field ejecta remaining. This provides a unique opportunity to explore the crater morphology as it was directly after the cratering and early modification. The marine target setting with seawater and sedimentary strata covering a flat and near-horizontal crystalline peneplain can be seen as an extreme case of target layers of different density and strength, which is known to impose a certain concentric shape of the resulting crater. We are investigating how the concentricity may be enhanced by the oblique, rubble-pile (pancake-shape after atmospheric entry) impact.
Introduction
At Lockne, the inner, nested, crater of about 7.5 km width is surrounded by a shallow, approximately 14 km wide, outer crater visible in the sedimentary rock. The oblique impact caused a downrange offset of the outer crater [2]. At Målingen, the nested crater in the basement is only about 0.7 km wide (Fig. 1).
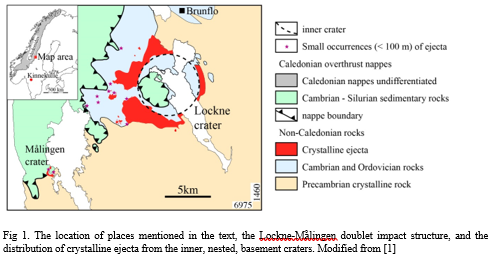
Both craters formed simultaneously (Fig. 2) by the impact of a binary asteroid at 458 Ma [1,3]. The Lockne/Målingen asteroid was generated in a massive collision in the asteroid belt at ~470 Ma, the so-called Middle Ordovician breakup event [4,5]. Not all fragments from a break-up event are massive and monolithic. After a catastrophic breakup of asteroids, smaller fragments can re-accumulate relatively fast (order of weeks) by gravitational attraction into larger objects, so-called “rubble-piles”. It is known that if an asteroid is binary, like in the case for Lockne-Målingen, it is a good indication that it is a rubble-pile.
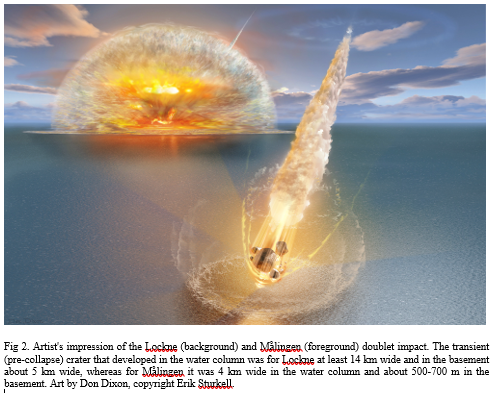
Geologically constrained, advanced 3-D numerical simulations of the Lockne impact have so far been done for a monolithic impactor [e.g., 6]. A best fit between the crater dimensions and the projectile for an impact of the most common configuration, i.e. 45° impact angle in an East to West direction, and 15 km/s impact velocity, gave a projectile size of about 600 m in diameter and a target water depth of slightly less than the projectile diameter. Likewise, based on numerical simulation of small marine target impacts [7], Ormö et al. [3] estimated the Målingen projectile to have been about 150 m in diameter if assumed a massive body. However, a rubble-pile asteroid of the dimensions of the Lockne and Målingen projectiles will separate upon entry into the atmosphere, but maintain their trajectory causing a “pancake-like” cluster, or debris-jet of projectiles [8]. The effect on the target area can, much simplified, be compared to that of a shotgun blast rather than a single rifle bullet, i.e. a shallow, widespread, but still coherent crater. The effect is enhanced in targets with weaker material covering a more massive substrate, as porous, wide projectiles tend to release their energy nearer to the target surface, i.e., in the here also more easily excavated upper layer. The diameter of the pancake-shaped cluster may exceed that of the initial projectile body by an order of magnitude [8]. Obliquity of impact is intensifying the breakup effect, the near-surface release of energy, and also the downrange extent and offset of the shallow outer crater [2].
Ongoing and planned activities
Our geological investigations of the Lockne- Målingen doublet crater serve as basis for numerical simulations [9], but also experiments to be carried out in the Experimental Projectile Impact Chamber (EPIC) at the Centro de Astrobiología in Spain. The simulations will increase our understanding of the subsurface morphology of the otherwise well-documented craters, e.g., the shape of true crater floor, the existence of a central uplift, and dimensions of the damaged zone around the crater. The experiments will focus on:
a) The influence of a layered target on both vertical and oblique impacts. Some initial studies have already been successfully performed [2,10]. The experiments are carried out as projectile shots into granular targets with layers of different properties.
b) The effects of a clustered projectile (”rubble-pile”) vs. a massive projectile of the same material and mass. The special design of the EPIC cannon allows the use of a great variety of projectiles. The shots will be made into single and dual layer granular targets.
c) A repetition of the shots in points ”a” and ”b” above, but in aquatic targets with various water layer thicknesses.
The definition of the deep subsurface morphology of especially the Lockne crater, combined with its already exceptionally well-known surface geology, will add the Lockne-Målingen doublet to the best-studied craters in the world as well as provide a unique opportunity for the analysis (geological and/or numerical) of the effects of an impact from a binary, “rubble-pile” asteroid into a layered target.


How to cite: Sturkell, E. and Ormö, J.: The Lockne – Målingen doublet: effects of a rubble-pile impact in a marine environment (layered target), Europlanet Science Congress 2020, online, 21 Sep–9 Oct 2020, EPSC2020-956, https://doi.org/10.5194/epsc2020-956, 2020.
The rim wall of water formed from even a modestly-sized marine impact may be kilometers in height. The portion that collapses inwards may generate a resurge flow with tremendous transport energy. We compare deposits generated by this ocean resurge inside one of the largest marine-target craters on Earth, the 200-km wide Chicxulub crater, with those from five other marine-target craters. Examination of the wide range of target water depths (H) relative to projectile diameters (d) reveals a high correlation between location at the crater, average clast frequency (<N>) and d/H from which any of these variables can be estimated if the others are known.
Introduction, aim and methods
Here we compare data on the resurge deposits recovered by International Ocean Discovery Program (IODP)- International Continental Drilling Program (ICDP) Expedition 364 Site M0077 located on the Chicxulub peak ring, a ~500-m topographic high, with resurge deposits in eight drill cores from five other marine-target craters. At Site M0077 (21.45°N, 89.95°W), core between 505.70 and 1334.73 mbsf (meters below sea floor) was recovered. The core shows, from top down, a sequence that begins with ~ 110 m of post-impact hemipelagic and pelagic Paleogene sedimentary rocks, which are followed downwards by ~ 130 m of a graded, polymict suevite (impact melt-bearing breccia) of which ~90 m are interpreted as a deposit from a single, forceful resurge [1, this study]. This sequence, in turn, overlies mainly impact melt rock and felsic basement rocks [1]. Here we estimate the effect of the oceanic resurge on deposition of the graded suevite. We apply the drill core line-logging method previously used in studies of resurge deposits at other impact craters formed at various relative water depths [e.g., 2, 3]. We compare the granulometric information of the M0077A core with previously obtained data on Lockne, Tvären, Chesapeake Bay Impact Structure (CBIS), Wetumpka, and Flynn Creek [cf., 2, 3, 4, 5].
To allow the transport in a suspension flow capable of generating the thick, single graded sequence observed in M0077A the amount of available water must also have been large. Factors that would influence the amount of water in the transported medium are: i) the relative target-water depth (vs. diameter of impactor), and ii) the type of target. It seems logical that a small crater formed in deep water has a more water-rich resurge than a much larger crater at the same water depth when considering the differences in the amount of debris from ejecta and rip-up. Likewise, it may be that an impact into poorly consolidated target sediments has a greater in-flux of debris than for a hard rock target. To investigate these factors, we looked at the relation between impactor diameter (d) and target water depth (H) as a way to relate the water depth to the magnitude of the event, and the average clast frequency per meter (here <N>) as well as the average of the mean clast size per meter (here <φ>) for the whole of the resurge deposits in the core. Critically, we also note the sedimentology, interpreted flow character, and location of the relevant cores to place these values in context.
Results and discussion
For essentially the same <φ>, a high <N> is considered to indicate a water-rich flow, whereas a low indicates a high matrix content. A high mud content despite the normal grading indicates a deposition from a hyperconcentrated flow [e.g., 2].
The advantage of having applied the same method at each of the investigated craters is that it allows direct comparisons. Intriguingly, when all ratios of d/H are plotted against <N>, two seemingly linear trends are clearly discernable (Fig. 1). The Lockne crater (especially the Lockne-1 core) with its relatively high water content and consolidated seafloor target rocks is at one end of the scale (with suspension deposits), whereas the Chesapeake Bay impact structure, despite having had a target water depth in the order of 200-500 m [6], is affected by its larger size in combination with a great thickness of poorly consolidated target sediments providing a relatively higher amount of material to the flow. A similar target situation is also known for the Wetumpka crater [7]. In the latter two craters, the resurge sediments are in the form of debris and mudflow deposits [3, 4].
Notably, the location of Site M0077 on top of the peak ring here can be compared to the situation of the Lockne-1 drill core, which due to the prolonged ‘washing’ of the resurge deposits at the inner flank of the crater rim obtained a relatively high clast frequency [cf. 2, 8].
Thus, one trend line seems to be for cores in deep crater locations such as annular troughs of complex craters or the center of simple craters. The other trend is for cores located proximal to elevated locations (e.g., Lockne-1 and Chicxulub M0077A). The exception is the CBIS Eyreville A core, which was drilled in the basement crater moat [e.g., 9], but plots along the trend line for elevated locations. Possibly, the in Eyreville A encountered 500 m thick granitic slab and other material from the mega-block slumping preceding the resurge created a topography affecting the flow dynamics. In the absence of any other common factor between the cores on the trend lines than the relative positions within the respective craters we suggest that depositional setting is the controlling factor between the two trend lines.
Furthermore, the two seemingly linear relations between mean clast frequencies of the resurge deposits and the d/H ratios for the craters provide an additional utility. The equations for the linear trends allow any of the four variables (i.e., location, clast frequency, projectile diameter, and target water depth) to be estimated if the three others are known. The physics behind these relations are analyzed by Herreros and Ormö [10].


How to cite: Ormö, J., Gulick, S. S. P., Whalen, M. T., King Jr., D. T., Sturkell, E., and Morgan, J.: A method to assess event magnitude and target water depth for marine-target impacts. Part 1: Granulometry of resurge deposits, Europlanet Science Congress 2020, online, 21 Sep–9 Oct 2020, EPSC2020-923, https://doi.org/10.5194/epsc2020-923, 2020.
Abstract
We present a mathematical model for the study of the aquatic settling process of resurge sediments after a marine-target impact with cratering of the seafloor. Fragments from the solid target are mixed with the seawater. After an initial turbulent phase the suspended solid particles begin to settle. Previous studies of resurge sediments in drill cores from several craters indicate a relationship between the sedimentology, the target water depth, and the magnitude of the event [1]. Here we investigate the physics behind the relationship.
1. Introduction
In this study, we assume that size segregation is correlated to the concentration of the solid particles [2,3] giving rise to the different settling patterns observed in the core samples. The density and viscosity of the solid-water mixture depend on the solid concentration causing a different settling velocity of the particles. For low concentrations, velocities of coarse particles are higher and fine particles are excluded from the lower part of the sediment while for high values of the concentration the settling of the coarse clasts become hindered by the higher concentration of fine grains in the solid-water mixture, thus reducing the packing of coarse fragments at the bottom of the sediment column.
2. Mathematical model
For the study of the size segregation during the particle settling, a fractal model is proposed [4-10]. Two types of particles are considered: (1) Fine particles, s, with radius Rs < Rp, and (2) Coarse particles, p, with radius Rp < RpL, being RpL the upper limit for the fractal behavior. The fractal model developed by Filgueira et al. [6,7] is applied in two steps, taking the settling time for the coarse particles in pure water, tmax, as a time reference:
- Step 1: Settling of fine particles with Rs < r < Rp for tmax in pure water: At this step, the settling of the fine particles is calculated, independently on the solid-water concentrations.
- Step 2: Settling of coarse particles with Rp < r < RpL for tmax in a solid-water mixture: The coarse particles are assumed to be immersed in a fluid mixture whose density and viscosity depend on the solid concentration. The deposited mass fraction of coarse particles for tmax is calculated at this step, and therefore, the number of settled coarse particles per unit length, i.e. the mean clast frequency <N>, can be approximated.
3. Impact cratering
After a meteorite impact, the transient crater diameter, Dt, can be related to the impactor diameter, d [11]. Considering a column of excavated material as a solid-water mixture column of height H = Hexc = Hw + Hsol, and taking into account that Hexc ≈ Dt /10 [12], the impactor diameter, d, can be written as a function of the solid concentration.
4. Results
As explained in previous sections, the mean clast frequency, <N>, and the impactor diameter, d, can both be written in terms of the solid concentration. Therefore it should be possible to represent <N> as a function of the impactor diameter over the depth of the water layer, d/Hw (Figure 1). This function indicates that for small values of d/Hw, i.e. either for small impacts and/or deep water bodies, the sediment pattern will show a higher number of coarse particles per unit length than for the case of very large impacts or very shallow water bodies (or both). This seems to be directly related to the solid concentration which is obviously greater in the case of large impacts and/or shallow seas.
To test the function trend obtained with the presented model, published data from five drill cores have been studied. These data have been presented for four natural impact craters, namely Lockne, Tvären, Flynn Creek (2 cores) and Wetumpka [1]. All the drill cores are from the deeper parts of the craters (e.g. moat). The values of d/Hw have been obtained performing numerical computations with the code iSALE-2D [13-15]. Figure 1 shows the model result (blue curve) along with the five drill cores’ data sets (dark dots). The model reproduces very well the trend based on observational data.

Figure 1: Mean clast frequency vs impactor diameter over the water depth.
5. Conclusions
A fractal model for the study of size segregation and particle settling after an impact event in a marine target is presented. The model assumes that the coarse particles will develop a different settling velocity depending on the volumetric concentration of fine particles, giving rise to a variety of size segregation patterns depending on the solid-water mixture properties. The model is able to reproduce the experimental tendency for five cores from four impact craters, for which the core samples were extracted in the deepest parts. However, a larger sample of craters would be desirable in order to further validate the proposed model.
Acknowledgements
The authors would like to gratefully acknowledge CSIC financial support for i-LINK project LINKA20203 and the Spanish State Research Agency (AEI) for project MDM-2017-0737.
References
[1] J. Ormö et al. EPSC-2020, id. EPSC2020-923.
[2] J. Spearman, A.J. Manning. Ocean Dynamics 67, 465–483, 2017.
[3] P. Snabre et al. Rheol Acta 48, 855–870, 2009.
[4] S.W. Tyler, S.W. Wheatcraft. Soil Sci. Soc. Am. J. 56, 362–369, 1992.
[5] M. Bittelli et al. Soil Sci. Soc. Am. J. 63, 782–788, 1999.
[6] R.R. Filgueira et al. Soil Sci. Soc. Am. J. 67, 1703–1706, 2003.
[7] R.R. Filgueira et al. Geoderma 134, 327–334, 2006.
[8] B.B. Mandelbrot. New York: Freeman & Co., 468, 1982.
[9] D.L. Turcotte . J. Geophys. Res. 91, 1921–1926, 1986.
[10] P. Baveye et al. Soil Sci. Soc. Am. J. 62, 1469–1470, 1998.
[11] B.C. Johnson et al. Icarus 271, 350–359, 2016.
[12] H.J. Melosh. Oxford Monographs on Geology & Geophysics. Oxford University Press Inc, USA, 1989.
[13] A. Amsden et al. Los Alamos National Laboratories Report, LA-8095:101p. Los Alamos, New Mexico: LANL, 1980.
[14] K. Wünnemann et al. Icarus 180, 514-527, 2006.
[15] G.S. Collins et al. Meteoritics and Planetary Science 39, 217-231, 2004.
How to cite: Herreros, I. and Ormö, J.: A method to assess event magnitude and target water depth for marine-target impacts. Part 2: The physics behind the observations, Europlanet Science Congress 2020, online, 21 Sep–9 Oct 2020, EPSC2020-931, https://doi.org/10.5194/epsc2020-931, 2020.
1. Introduction
Compared to other planetary bodies, terrestrial impact craters can be rather difficult to discover due to different geological processes, including sedimentation and erosion, that modify and eventually erase the original impact crater topography. Only a small number of marine impacts are known. The paucity of oceanic impact craters can be explained by the relatively young age of the oceanic crust compared to continental shields, the relatively fast sedimentation rates, the fact that only sufficiently big and thus less frequent impactors can penetrate the water column and form a crater at the ocean floor, and last but not least, the poor accessibility of the ocean floor making it more difficult to find and confirm the impact origin of suspicious structures (Grieve et al., 1995).
This study focuses on a new potential impact structure discovered during a marine seismic survey (Groth et al., in preparation). Figure 1 shows seismic reflectors depicting the structural deformations beneath the ocean floor as a function of depth. The structure shows typical features of complex impact craters such as a central uplift and concentric rings at a depth in the sediment layer corresponding to the ocean bottom at the time of potential impact. These features suggest an impact origin. However, the relatively small size of approximately 4.6 km is uncommon for a complex crater. At a depth of 0.64 km the reflector appears to be not affected by the potential impact, which also provides constraints on the size of the event.

Figure 1: Profiles derived from seismic data courtesy of TGS.
To unambiguously confirm the impact origin, shock metamorphic effects in sample material is required (French, 1998), but has not been found, yet. Drill cores are only available at some distance from the structure, which makes it difficult to correlate and find impact ejecta.
Therefore, we test the impact origin hypothesis by numerical modelling of crater formation. We use the given structure as reference and investigate what conditions are required to enable the formation of the given morphology. This is particularly challenging as a central peak and ring structures are unusual for the given structure dimensions and may be only explained by specific material properties and rheology.
2. Method
We performed a parametric study utilizing the iSALE shock physics code for 2D-simulations (Wünnemann et al., 2006) in order to simulate a formation caused by impact cratering and reproduce the given morphology. A simplified set-up was applied in all simulations: A projectile with a radius of 75m and a velocity of 12km/s is assumed to impact a one-layered target.
The parametric study comprises the application of different rheology models, among those are models for a Newtonian Fluid, competent rocks, and granular material. In the numerical models the controlling parameter for a Newtonian fluid is the viscosity, which was varied ranging from 102 to 109 Pa*s. The rheology models for competent rocks and granular material are used with varying values for the cohesion ranging from 102 to 106 Pa and the friction coefficient ranging from 0.1 to 1. The rock and granular material rheology is combined with the acoustic fluidization model (Melosh, 1979) to enable temporary weakening during crater formation. Acoustically fluidized material behaves according to a Bingham rheology with a Bingham viscosity which was varied between 10-4 to 102. Another controlling parameter is the attenuation time of the acoustically fluidized state of the material.
3. Results
The different combinations of parameters lead to results with a wide range of possible crater morphologies.


Figure 2: Comparison of seismic profiles (left) and models (right) using rheology models for (a) competent rock and (b) granular material with acoustic fluidization. Late timesteps are depicted when material is completely settled. Black lines represent tracers for material movement.
Figure 2 shows a comparison of the seismic profiles (left) with the models generated during this work (right). Assuming a rheology model for competent rock (a), it is possible to reproduce a central uplift with steep flanks. While the upper layer can be observed to be overturned, the material in a depth of 0.64 km is only to a small degree affected by the impact. Using a rheology model for granular rock and applying the concept of acoustic fluidization (b) as a temporary weakening, it is possible to produce a broad central uplift with shallow flanks. Although still larger than depicted in the seismic data the height of the central peak is noticeably smaller than in the model using competent rock. The material in a depth of 0.64 km is significantly deformed by the impact event.
To verify the visual analysis a quantitative analysis is performed by parameterizing the central peak of both the seismic data and the simulation results. The most prominent central peaks in depths of 0.3 km and 0.4 km are selected and their height and width are calculated for comparison. The quantitative analysis confirms that the model with a granular material rheology plus acoustic fluidization reproduces the seismic profiles in the upper layers while the model assuming competent rock agrees better with the seismic data in the lower layer.
4. Conclusion
An impact origin of the discussed structure is possible as the study succeeds in reproducing its most prominent morphologic features. It was possible to constrain rheology models that explain the formation of the given structural deformations. This study shows the significance of modelling to estimate the possibility of an impact origin when there is little prospect to find shock-metamorphic evidence.
References
Grieve, R., Rupert, J., Smith, J., Therriault, A. (1995), The Record of Terrestrial Impact Cratering, GSA Today, Vol. 5, pp. 195-196
French, B. M. (1998), Traces of Catastrophe: A Handbook of Shock–Metamorphic Effects in Terrestrial Meteorite Impact Structures. LPI Contribution No. 954, Lunar&Planetary Institute, Houston, p.31.
Wünnemann, K., Collins, G., Melosh, H. J. (2006), A strainbased porosity model for use in hydrocode simulations of impacts and implications for transient crater growth in porous targets, Icarus, Vol. 180, pp. 514-527.
Melosh, H. J. (1979), Acoustic fluidization: A new geologic process? Geophys. Res., 84 (B13), pp. 7513– 7520.
How to cite: Koch, L., Wünnemann, K., Groth, A., Dypvik, H., and Faleide, J. I.: Numerical Modelling of a Potential Oceanic Impact Structure, Europlanet Science Congress 2020, online, 21 Sep–9 Oct 2020, EPSC2020-740, https://doi.org/10.5194/epsc2020-740, 2020.
In recent years, interest in predicting the consequences of the encounter of a NEO with Earth has increased. Most studies focus on rocky or cometary objects [1-3]. However, in the most frequent size range of the smallest objects, the effects of iron objects are more severe than for equal-sized rocky objects. Indeed, most small craters on Earth have been formed by iron objects, which penetrate the atmosphere more efficiently than stony asteroids. Intact meteoroids form single craters (e.g. Kamil), fragmented meteoroids form crater/meteorite strewn fields (e.g. Morasko), and larger asteroids fragment and form a single crater (e.g., Barringer). The atmospheric entry and cratering generate shock waves, which can cause damage on the ground. In this project, we combine different approaches in a knowledge-base to predict the outcome of such events with sufficient accuracy in a fast way. Such a tool is highly desirable for ESA's Planetary Defence Office to release impact warnings and inform emergency response agencies.
We describe the behaviour of iron objects of few metres in size up to ~50 m in diameter. We assume that their strength follows a typical Weibull power law. In order to simulate the atmospheric entry of an iron object, we follow different approaches: 1) small (i.e. ~1 m sized) meteoroids that are strong enough to avoid fragmentation in the atmosphere are subject to ablation and deceleration, 2) slightly larger asteroids (i.e. few metres) are described by a separate fragment model [e.g. 4,5], and 3) the largest asteroids are described by the pancake model [e.g. 6].
The effect of atmospheric shock waves (i.e. overpressure and wind speeds on the ground) are calculated based on fits to nuclear explosion data [1,7], which yield circular-symmetric results. For cases that are not accurately described by simple parameterisation, we use the shock physics code SOVA [8] to simulate the evolution of shock waves based on pre-calculated energy release curves. Tracer gauges measure the pressure and velocity distribution over time in atmosphere and store the maximum values.
Distinction between individual fragments and a homogenous cloud of fragments: The fragmentation of an iron meteoroid/asteroid and the altitude at which such an event occurs depends on the initial parameters (velocity, entry angle, size). Large objects typically have a lower strength than smaller ones and fragment earlier in the atmosphere. Once fragmented, the individual pieces separate from each other with a lateral dispersion velocity, which depends on the absolute velocity of the object [4]. To decide which parameterisation to use, we compare the total cross- sectional area of all fragments with their separation distance (similar approach has been used in [9]). As long as the cross-sectional area of all fragments is larger than the corresponding size of the expanding fragment cloud (estimated from the dispersion velocity), the pancake model can be applied. This condition is expressed by the following equation (assuming equal-sized fragments):

with the initial size R, separation velocity constant C, air density ρair, asteroid density ρasteroid, Weibull exponent αW, atmospheric scale height H, number of fragments N and entry angle ϑ. The altitude of fragmentation (and, thus, the atmospheric density at fragmentation) depends on the initial parameters, which is why the equation cannot be solved analytically. The dependence is shown in Figure 1. A meteoroid of the size of the Morasko event (~3 m radius, [5]) falls into the regime where the separate fragment model is applied. An asteroid like the one that formed the Barringer crater (~25 m radius) can be modelled with the pancake model. We also apply this approach to fragments with exponential size-frequency distribution, and the results are essentially the same.

Figure 1: Expansion radii (colour lines) versus initial radius of a meteoroid (X-axis and grey line). Iron density is 7800 kg/m³, the reference strength for a 1kg sample is 440 MPa, αW=0.2. If the coloured lines are below the grey line, the pancake model is valid (separation distance is smaller than the maximum radius of the compact body). If the coloured lines are above the grey line, the separate fragment model is applicable (fragments are well-separated when the second fragmentation occurs). Colours represent different number of fragments: black – 10; blue – 100; green – 1000; and red – 106.
Overpressure: We show results for two size classes of objects, which represent the size of the Kamil and the Barringer cratering events (Figure 2). For the Kamil event (initial radius of ~ 1.5 m), the outcome depends on modelling parameters (e.g. strength) and can vary between the formation of a single crater or a strewn field. However, overpressure distributions show little variation with and without a fragmentation event. For larger objects, the strength is less important. Overpressures are caused mostly by the crater formation and to some part by the atmopsheric entry.


Figure 2: Overpressure caused by the entry of two different sized objects. Top: 1.5m radius, 20km/s, 45° entry angle, different strength parameters, Bottom: 23m radius, 18km/s, 30°- 45° entry angle (green, and red & blue, respectively). The red line represents a ten times weaker reference strength. Results based on nuclear explosion data [7] are shown in black.
Shock physics codes give most reliable results for the prediction of overpressures. However, for a range of input parameters, the usage of parameterisation in combination with nuclear explosion data produces reliable estimates much faster (cf. Figure 2). In this project, we use a combination of both approaches. For small iron objects, overpressures are low apart from a small range near the crater, and damage is localised within a few crater radii.
Acknowledgements
We acknowledge the funding by ESA SSA-NEO, contract code P3-NEO-VIII.
References
[1]Collins G.S., Melosh H.J. and Marcus R.A. (2005)M&PS,40(6),817-840. [2]Wheeler et al. (2018)Icarus,315,79-91. [3] Artemieva N. and Shuvalov V. (2019)M&PS,54(3),592-608. [4] Artemieva N. and Shuvalov V. (2001)JGR,106,3297-3309. [5] Bronikowska et al. (2017)M&PS,52(8),1704-1721. [6] Chyba C.F., Thomas P.J. and Zahnle K.J. (1993)Nature,361,40-44. [7] Collins et al.(2017)M&PS,52(8),1542-1560. [8] Shuvalov V.V. (1999)ShockWaves,9,381-390. [9] Svetsov V.V., Nemtchinov I.V., and Teterev A.S. (1995)Icarus,116,131-153.
How to cite: Luther, R., Artemieva, N., Wünnemann, K., and Koschny, D.: Predicting the Consequences of iron-NEO Collisions with Earth: The Impact Effects Knowledge-base, Europlanet Science Congress 2020, online, 21 Sep–9 Oct 2020, EPSC2020-879, https://doi.org/10.5194/epsc2020-879, 2020.
Geochemical evidence for a collision between a large (~10 km) extraterrestrial body and Earth at the end of the Cretaceous, ca. 66 million years ago, and the conclusion that this event was the cause for the global Cretaceous-Paleogene boundary extinction event [1], triggered an intense worldwide search for evidence of other impact events that could be temporally correlated to other extinction events [2, 3]. To date, no convincing links to any other extinction events have been presented [2].
Connecting extinction events with a specific impact event/crater is complicated by the fact that the inventory of terrestrial impact craters remains largely incomplete, due to, e.g., erosion and sedimentary cover. In addition, our understanding of impact diagnostic markers in sedimentary strata is far from complete, especially in the case of target rocks that lack quartz or when dealing with extraterrestrial projectiles with “not so distinctive” geochemical signature, such as achondrites. On top of these considerations, the ages of a large number of the known terrestrial impact structures are poorly constrained. A precise, and most importantly accurate, age for an impact event is crucial when attempting to tie a specific impact event to a biosphere episode recorded in the stratigraphic record.
The 40-km-diameter Puchezh-Katunki impact structure [4], located ~400 km northeast of Moscow (Russia), with an estimated age ranging from ~164 to 203 Ma [5, 6], has been discussed as a possible trigger for four different biotic crises (Fig. 1; [7-12]).
Here we present new 40Ar/39Ar data on impact melt rock samples from the Vorotilovo Deep Well drill core, retrieved from the center of the Puchezh-Katunki impact structure [4,6]. The new age obtained for the structure provides valuable data regarding relationships between impact events and extinction events in general and specifically the proposed relationship with some Mesozoic extinction/biotic events, and also contributes to the improvement of the age database of terrestrial impact structures.
Laser step-heating of four whole-rock samples of impact melt rock from the Puchezh-Katunki impact structure were run in duplicate (Fig. 1). The samples (V1018, V1144, and V1251) come from the upper parts of the drill core. The new 40Ar/39Ar data allow us to precisely and accurately date the formation of the Puchezh-Katunki impact structure to 195.8 ± 1.0 Ma (2σ; mean square of weighted deviates (MSWD) = 2.0; P = 0.11). This new age makes Puchezh-Katunki one of the most precisely dated impact structures on Earth (2σ relative error: 0.51%).
As previously noted, only one global mass extinction has been confirmed to be the direct result of an impact event. The possible relation between impact events and global mass extinctions has been extensively discussed in the literature [2, 3], and lower limits on crater sizes that cause global effects have been debated as well (op.cit.). For example, there is little evidence that the late Eocene impact events (e.g., the Popigai and Chesapeake Bay impact events) have caused any global biotic effects. It is of course possible that less severe, perhaps regional, biotic events have also played an important role in the evolution of life (e.g., [13]). Understanding these events can yield important insights into e.g., the relationship between environmental changes and extinctions (i.e., causality), and how life recovers after such sudden events. Despite not causing global mass extinction, impact events of significant magnitude to cause regional havoc (e.g., resulting in impact craters equivalent to the size of Puchezh-Katunki) will have an impact on life (e.g., [14]) at least on a regional to continent-wide scale, and could possibly have caused both yet undetected biotic events as well as some of the (minor) extinction events that are recognized in the stratigraphic succession. However, since the geological timescale is continuously refined and ages updated, connecting even a well-dated impact structure with an event in the stratigraphic record is by no means straight-forward.
Our new age of 195.8 ± 1.0 Ma for the formation of Puchezh-Katunki excludes any relationship with the previously mentioned biotic/extinction events, and clearly illustrates that connecting poorly constrained crater ages with extinction events is troublesome. Therefore, we stress that using poorly constrained or outdated ages leads to erroneous or problematic conclusions (see also e.g., [15, 16]). We also want to emphasize that proving synchronicity between an impact event and a biotic event is not the same thing as proving causality.
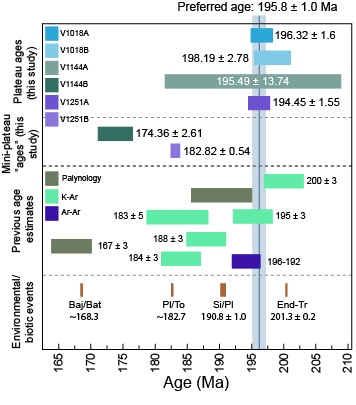
Fig. 1. Comparison of previous age data with our results from 40Ar/39Ar analyses of Puchezh-Katunki impact melt rocks, with plateau ages and mini-plateau “ages” (2σ errors, all ages in million years). For references to previous age estimates see [5, 6]. For references to environmental/biotic events that have been suggested to possibly be synchronous with the Puchezh-Katunki impact event, see text. Abbreviations: Baj/Bat = Bajocian/Bathonian, Pl/To = Pliensbachian/Toarcian, Si/Pl = Sinemurian/Pliensbachian, Tr = Triassic.
Acknowledgements
We are very grateful to our late friend and colleague Dr. Svetlana Bogdanova for providing the samples investigated here. SHA is supported by VR (2017-06388).
References
[1] Alvarez L. W., et al. (1980) Science 208, 1095–1108. [2] French B. M. and Koeberl C. (2010) Earth Sci. Rev. 98, 123–170. [3] Racki G. (2012) Acta Palaeontol. Pol. 57, 681–702. [4] Masaitis V. L. and Naumov M. V. (2020) The Puchezh-Katunki impact crater. Geology and Origin. Springer, 213 p. [5] Mashchak M. S. (1999) In Deep drilling in the Puchezh-Katunki impact structure. VSEGEI-Press. pp. 242–244. [6] Holm-Alwmark S., et al. (2019) Met. Planet. Sci. 54, 1764-1780. [7] Blackburn T. J., et al. (2013) Science 340, 941–945. [8] Cohen K. M., et al. (2013; updated) Episodes 36, 199–204. [9] Sell B., et al. (2014) Earth Planet. Sci. Lett. 408, 48–56. [10] Raup D. M. and Sepkoski J. J. (1986) Science 231, 833–836. [11] Rampino M. R. and Caldeira K. (2015) Mon. Not. R. Astron. Soc. 454, 3480–3484. [12] Rampino M. R. (2020) Earth-Sci. Rev. 201, 102990. [13] Patzkowsky M. E., and Holland S. M. (1993) Geology 21, 619. [14] Toon O. B., et al. (1997) Geophys. 35, 41–78. [15] Jourdan F., et al. (2012) Elements 8, 49–53. [16] Jourdan F., et al. (2009) Earth Planet. Sci. Lett. 286, 1–13.
How to cite: Alwmark, S., Jourdan, F., Ferrière, L., Alwmark, C., and Koeberl, C.: Temporal link between impact events and biotic crises – The case of the Puchezh-Katunki impact structure (Russia), Europlanet Science Congress 2020, online, 21 Sep–9 Oct 2020, EPSC2020-880, https://doi.org/10.5194/epsc2020-880, 2020.
The Double Asteroid Redirection Test (DART) plans to impact the smaller component of the 65803 Didymos asteroid system [1], Dimorphos, and alter the binary orbit period of the system [2]. The experiment aims to demonstrate the controlled deflection capabilities of a near-Earth asteroid. ESA’s Hera mission [1,2] will arrive at Dimorphos four years after the DART impact and provides a detailed characterization of the impact. For a successful analysis it is important to know the influence of various parameters known to affect the cratering. Here we present some preliminary results as well as planned experiments at the Experimental Projectile Impact Chamber (EPIC) at Centro de Astrobiología CSIC-INTA, Spain, carried out in concert with observations of natural craters and numerical simulations for mutual verification of the methods and a first analysis of the effects of factors such as heterogeneities in a granular (i.e. ‘rubble-pile’) target.
Introduction, aim and methods
As shown by previous impact experiments and numerical simulations [3,4,5], the amount by which the target asteroid can be deflected is highly dependent on the target properties and structure, and non-unique. Thus, the knowledge of the final crater as observed by Hera is important to assess the target properties of Dimorphos [6]. However, such an analysis based on numerical models requires accurate validation of the applied numerical codes [7,8]. Previous validation work has focused on impacts into homogeneous targets [e.g. 9,10]. However, it is unlikely that asteroids are as homogeneous at this scale [cf. 11] as on the scale of previous laboratory experiments. Therefore, there is a need for impact experiments specifically designed to mimic asteroid surface materials and structures (e.g. layered targets, rubble piles). The EPIC can be used to provide the impact experiments needed. In addition, field observation of relevant natural craters, both strength-controlled (e.g. Kaali, 110m) and gravity-controlled (e.g. Lockne, 7.5km) may provide additional information.
The EPIC utilizes a 20mm calibre compressed N2 (300bar) cannon that can shoot projectiles of various materials and composition (e.g., solid, clustered) at velocities of up to ~420m/s and into various target materials at impact angles from 20-90° over the horizontal. The experiments, half- or quarter-space, are recorded by high speed cameras, and the resulting craters (approx. 30cm in dry sand) can be scanned in 3D with 0.5mm resolution.
For the results shown here, we use the iSALE shock physics code [12,13] to simulate the conducted experiments from the laboratory. The strengths of iSALE are the availability of: different material models (brittle/ductile rheology), a damage model, various equations of state, and a porosity compaction model.
Planned activities and preliminary results
Vertical impact experiments into homogeneous targets can be used to validate ejecta curtain formation and final crater size from 2D numerical models. Then, simulations can be used to determine the influence of specific material properties in systematic parameter studies, which are difficult to be conducted in the laboratory (Fig. 1).
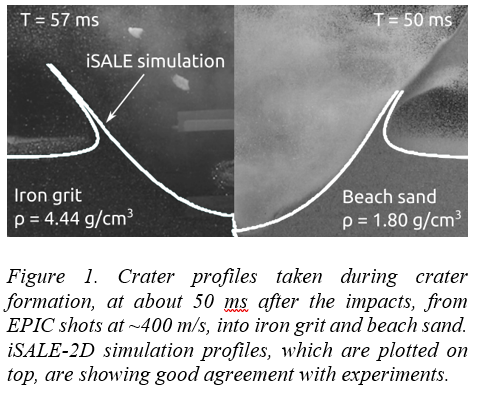
Most small bodies in the Solar System are not homogeneous, as shown by past missions to asteroids. Several visited asteroids have been observed to be covered by a layer of regolith, which overlies a much stronger or denser substrate [14]. The effects of target layering on impact cratering in the strength regime was studied extensively through laboratory experiments [e.g. 15] and simulations [16]. While much of the kinetic energy of the projectile is released in the weaker upper target, this material also requires relatively less energy to be cratered. Likewise, differing impedances of the cover layer and the substrate (i.e., basement) could result in reflection of the shock, with a reduction of the energy transferred into the basement and, consequently, more energy available for cratering the upper layer. Therefore, the crater in the weak layer may get relatively wider than a corresponding crater in an equivalent homogeneous material. For asteroids like Dimorphos the transition crater diameter will be well above the size of the target, giving that all impacts would be strength dominated. Nevertheless, even in the case of a strength dominated substrate, a layer of granular cohesionless material will still be gravity-dominated. For example, Hayabusa2’s SCI experiment created a concentric crater morphology specific to layered targets, which is believed to have formed in the gravity regime [11]. Layering affects also large gravity-dominated craters [17]. However, little is known about impact cratering into layered targets in the gravity regime.
As shown from numerical simulations into layered targets in the strength-regime, the presence of a stronger and/or denser substrate can both amplify and reduce the momentum transferred from a spacecraft for deflecting an asteroid. [6] This can have important implications for NASA’s DART mission.
We have already carried out some experiments at the EPIC with layers of different density (i.e., beach sand over iron grit) to simulate gravity-controlled cratering in layered targets (Figs. 2,3).

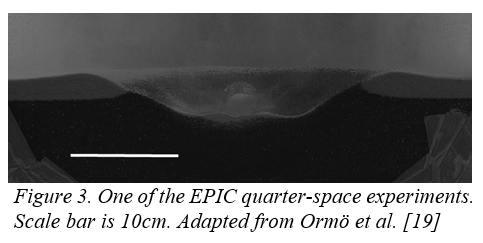
3. Complex target structures/Rubble piles
However, the variations in strength and density can also be compared to the configuration of greatly heterogeneous objects such as rubble-piles. Rubble-pile asteroids may have a highly irregular distribution of massive rock vs rubble (i.e. not in an orderly “layered” fashion), and strength and density vary locally. An irregular crater growth and, consequently, irregular ejection of material affect the asteroid deflection (e.g. unpredictable motions). Such irregularities may be difficult to model numerically and would require full 3-dimensional geometry, which is computationally expensive.
Nevertheless, current efforts to model rubble pile geometries in the context of the DART impact are undertaken [18]. Laboratory experiments are highly needed to validate such models. We intend to investigate these effects experimentally for both strength and gravity dominated targets (Fig. 4).
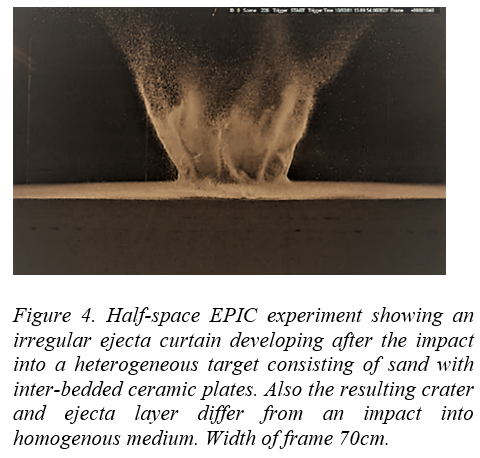

Acknowledgements
Ormö was supported by grants ESP2017-87676-C5-1-R from the Spanish Ministry of Economy and Competitiveness and Fondo Europeo de Desarrollo Regional. Ormö and Herreros were supported by the Spanish State Research Agency Project No.MDM-2017-0737 Unidad de Excelencia "María de Maeztu"- Centro de Astrobiología (INTA-CSIC), and the CSIC I-LINK project LINKA20203.
How to cite: Ormö, J., Raducan, S. D., Luther, R., Herreros, M. I., Collins, G. S., Losiak, A., and Wünnemann, K.: Effects of target heterogeneity on impact cratering processes in the light of the Hera mission: combined experimental and numerical approach, Europlanet Science Congress 2020, online, 21 Sep–9 Oct 2020, EPSC2020-922, https://doi.org/10.5194/epsc2020-922, 2020.
Motivation and Approach
Phobos’ proximity to Mars and short orbital period has led to the hypothesis that Phobos could sweep up particles ejected from large impacts on the martian surface [1]; models suggest that Phobos’ regolith could include up to ~250 ppm of martian ejecta material [2,3]. Considering that Mars’ surface has many “Special Regions” that could have been habitable in the past [4], it is not unreasonable to suggest that life could have developed and left behind biomarkers. An impact into one of these areas could eject material containing biologically-significant compounds and deposit it on the surface of Phobos. Therefore, an appealing possibility is that samples collected from the surface of Phobos, by missions such as JAXA’s Martian Moons eXploration (MMX) [5], could contain martian biomarkers. Further investigation into the feasibility of biomarker transfer from Mars to Phobos is hence necessary before returned samples and in situ spacecraft data are analysed.
In order to investigate this scenario, light gas gun impact and heating experiments will be used to simulate the conditions a martian rock, containing biologically-relevant material, would undergo throughout the transport process from Mars to Phobos [6,7]. However, prior to carrying out these experiments, the biologically-relevant material must be defined. It is important that this material represents plausible molecular fingerprints of the types of organisms that might have existed in the harsh radiation conditions of Mars’ near-surface for billions of years [8]. Furthermore, they must survive the shock conditions experienced during ejection by a sizeable impact capable of delivering material to reach Phobos’ orbit, and the subsequent deposition onto the surface of Phobos. Biomarkers that could satisfy these criteria include amino acids, polycyclic aromatic hydrocarbons (PAHs), fatty acids and sterols [e.g. 9], some of which may be precursors of chlorinated molecules detected in the Cumberland mudstone at Gale Crater [10].
Previous impact modelling has suggested that a small proportion of near-surface martian material can be ejected at high velocities, capable of reaching Phobos from Mars, and experience shock-pressures low enough to remain solid [11]. However, simulations of martian ejecta impacting Phobos are limited to mass-less [2,3] or “hard rock” projectiles [12] that neglect the reduced shock experienced at the trailing edge of a projectile during the early stages of contact and compression [13], which could aid biomarker survival [14]. Therefore, this study uses the iSALE-2D shock-physics code [15-17] to estimate the pressure and temperature regimes within martian ejecta as it impacts Phobos’ surface. This will enable constraints to be placed on conditions necessary for biomarker survival.
Model Parameters
Consistency between in situ [e.g. 18, 19] and remote sensing [e.g. 20] observations, and the global meteorite collection [21], indicate that Mars’ global surface composition can be approximated as basaltic. Thus, it can be assumed that basalt is the most likely crustal rock composition to be ejected from Mars. However, this igneous composition is not the most likely rock type in which to find biomarkers. Sedimentary rocks, such as mudstones, indicate favourable past conditions for habitability on Mars and have an increased potential to preserve biomarkers [22]. Organics and bioessential elements have been detected within mudstones at Gale crater [e.g. 23, 24]. However, mudstones are spread sparsely over Mars’ surface, so are less likely to be ejected by impacts. This work, therefore, considers both igneous and sedimentary ejecta, modelling basalt and mudstone projectiles.
For the target, the surface composition of Phobos is largely unknown, owing to the lack of direct sampling from the surface; spectral data indicate that the surface resembles D- or T-type asteroids or carbonaceous chondrites, rich in phyllosilicates [25]. Therefore, the closest match to Phobos’ compositional and physical properties will be chosen for the target, with reference to Phobos regolith simulants [e.g. 26].
The simulations will be run over a range of realistic impact parameters, including impactor size (~0.01 - 10 m [27]) and impact velocity (up to 5.3 km s-1 [3,12]).
Implications
The results from this modelling will provide insight into the survival of martian biomarkers during deposition onto Phobos. Furthermore, the results will inform the subsequent impact and heat experimental simulations.
References
[1] Murray, J. B., (2011) EPSC-DPS Joint Meeting, 1003. [2] Ramsley, K. R. & Head, J. W., (2013) Planet. & Space Sci., 86, 115-129. [3] Chappaz, L. et al., (2013) Astrobiology, 13(10), 963-980. [4] Rummel, J, D., et al., (2014) Astrobiology, 14(11), 887-968. [5] Usui, T. et al., (2018) 42nd COSPAR Scientific Assembly, B4.2-7-18, 2018. [6] Morland, Z. S. et al., (2020) Proc. 51st Lunar Planet. Sci. Conf., 1096. [7] Morland, Z. S. et al., (2019) Proc. British Planet. Sci. Conf., 88. [8] Kminek, G. et al., (2006) Earth Planet. Sci. Let., 245(1-2), 1-5. [9] Vago, J. L. et al., (2018) in B, Cavalazzi., and F, Westall (Eds.) Springer, 283-300. [10] Szopa, C., et al., (2020) Astrobiology, 20(2), 292-306. [11] Artemieva, N. & Ivanov, B., (2004) Icarus, 171, 84-101. [12] Summers, D., (2019) Life Sci. Space Res., 23, 101-111. [13] Pierazzo, E. & Melosh, H. J., (2000) Meteorit. Planet. Sci., 35, 117-130. [14] Pierazzo, E. & Chyba, C. F., (1999) Meteorit. Planet. Sci., 34, 909-918. [15] Amsden, A. et al., (1980) LANL Report, LA-8095. [16] Collins, G. S. et al., (2004) MAPS, 38, 217-231. [17] Wünnemann, K. et al., (2006) Icarus, 180, 514-527. [18] Filiberto J., (2017) Chemical Geology, 466, 1-14. [19] Cannon, K. M. et al., (2019) Icarus, 317, 470-478. [20] McSween Jr. H. Y. et al., (2003) JGR Planets, 108(E12), 5135. [21] Martian Meteorite Compendium, https://curator.jsc.nasa.gov/antmet/mmc/ [22] Hays, L. E. et al., (2017) Astrobiology, 17(4), 363–400. [23] Stern, J. C. et al., (2015) Proc. Nat. Acad. Sci., 112(14), 4245–4250. [24] Eigenbrode, J. L. et al., (2018) Science, 360(6393), 1096-1101. [25] Fraeman, A. A. et al., (2014) Icarus, 229. 196-205. [26] Morland, Z. S., (2019) Proc. 50th Lunar Planet. Sci. Conf., 2132. [27] Ramsley, K. R. & Head, J. W., (2013) Planet. & Space Sci., 75, 69-95.
How to cite: Morland, Z., Halim, S., Pearson, V., Patel, M., Green, S., and Ramkissoon, N.: Modelling the survival of ejected martian biomarkers impacting Phobos, Europlanet Science Congress 2020, online, 21 Sep–9 Oct 2020, EPSC2020-254, https://doi.org/10.5194/epsc2020-254, 2020.
Please decide on your access
Please use the buttons below to download the presentation materials or to visit the external website where the presentation is linked. Regarding the external link, please note that Copernicus Meetings cannot accept any liability for the content and the website you will visit.
Forward to presentation link
You are going to open an external link to the presentation as indicated by the authors. Copernicus Meetings cannot accept any liability for the content and the website you will visit.
We are sorry, but presentations are only available for users who registered for the conference. Thank you.