Oral presentations and abstracts
Mercury Science in the post-MESSENGER area, open to all Mercury relating subjects, and covering e.g.
- Mercury's interior, surface, environment, and interactions thereof
- BepiColombo Mercury Science
- BepiColombo Flyby (Earth, Venus, Mercury) and Cruise (Radio Science, Solar Wind, Gamma Rays): results and expectations
- Ground-based Mercury Observations: results and plans
- laboratory activities in support of Mercury Science
Session assets
The variability of Na exosphere of Mercury shows time scales from less than one hour to seasonal variations. While the faster variations, accounting of about 10-20% of fluctuations are probably linked to the planetary response to solar wind and Interplanetary Magnetic Field variability, the seasonal variations (up to about 80%) should be explained by complex mechanisms involving different surface release processes, loss, source and migrations of the exospheric Na atoms. Eventually, a Na annual cycle can be identified. In the past, ground-based observations and equatorial density from MESSENGER data have been analysed. In this study, for a better investigation of the exospheric Na features, we have studied the local time and latitudinal distributions of the exospheric Na column density as a function of the True Anomaly Angle (TAA) of Mercury by means of the extended dataset of images, collected from 2009 to 2013, by the THEMIS solar telescope. Our results show that the THEMIS images, in agreement with previous results, registered a strong general increase at aphelion and a dawn ward emission predominance with respect to dusk ward and subsolar region between 90° and 150° TAA. Unlikely other analyses, ours evidences a predominance of subsolar column density along the rest of Mercury’s orbit. An unexpected relationship between Northward or Southward peak emission and both TAA and local time is also evidenced by our analysis. This result seems to contradict previous results obtained from different data sets and it is not easily explained, thus it requires further investigations.
How to cite: Milillo, A., Mangano, V., Massetti, S., Mura, A., Plainaki, C., Alberti, T., Aronica, A., De Angelis, E., Ippolito, A., Kazakov, A., Noschese, R., Orsini, S., Rispoli, R., Sordini, R., and Vertolli, N.: Exospheric Na distributions along the Mercury orbit with the THEMIS telescope, Europlanet Science Congress 2020, online, 21 Sep–9 Oct 2020, EPSC2020-220, https://doi.org/10.5194/epsc2020-220, 2020.
References
Leblanc, F. et al., 2009. Short-term variations of Mercury's Na exosphere observed with very high spectral resolution. Geophys. Res. Lett. 36, 7.
Mangano, V. et al., 2015. THEMIS Na exosphere observations of Mercury and their correlation with in-situ magnetic field measurements by MESSENGER, Planet. Space Sci. 115, 102-109.
Potter, A. E., R. M. Killen and M. Sarantos. 2006. Spatial distribution of sodium on Mercury. Icarus 181, 1 -12.
Potter, A. E., R. M. Killen and T. H. Morgan, 1999. Rapid changes in the sodium exosphere of Mercury. Planet. Space Sci. 47, 1441-1448.
Potter, A. E. and T. H. Morgan, 1985. Discovery of sodium in the atmosphere of Mercury. Geophys. Res. Lett. 22, 3289-3292.
Sprague, A. L. et al., 1998. Mercury sodium atmosphere enhancements, Radar bright spots, and visible surface features. Icarus 136, 60-68.
How to cite: Killen, R.: Seeing Effects on Ground-Based Images of Mercury's Sodium Exosphere, Europlanet Science Congress 2020, online, 21 Sep–9 Oct 2020, EPSC2020-5, https://doi.org/10.5194/epsc2020-5, 2020.
Abstract.
Flux transfer events (FTEs) are magnetic flux ropes formed by multiple reconnection X-lines on the magnetopause between the planetary magnetic field and the interplanetary magnetic field (IMF). During FTE shower intervals, FTEs appear extremely frequently with typical rates of ~ 10 FTEs per minute. This study shows that FTE showers are observed during half of the dayside magnetopause crossings over the entire MESSENGER mission. The occurrence and physical properties of FTE showers depend on the magnetic shear angle across the magnetopause and the magnetosheath plasma (ratio of the plasma thermal pressure to the magnetic pressure). Modeling of these flux ropes in FTE shower intervals are determined to carry most (i.e., 60% - 85%) of the magnetic flux supplying Mercury’s Dungey cycle. Furthermore, sodium ions (Na+) are substantially enhanced during FTE shower intervals as compared with non-shower intervals. FTE showers lead to much larger precipitation rates on the cusp’s surface and would sputter large numbers of planetary atoms into the exosphere, which then be photon-ionized resulting in the enhancement of Na+.
1. Introduction.
Interactions between Mercury’s global intrinsic magnetic field and supersonic solar wind form a miniature magnetosphere. Without a significant neutral atmosphere, Mercury’s magnetosphere is able to prevent most of the planet’s surface from being directly hit by the streaming solar wind most of the times [1]. Magnetic reconnection on the dayside magnetopause generates FTEs, in which the magnetic field lines have one end connected to the solar wind and the other end connected to the planet. Magnetic flux ropes concentrate magnetic flux in the FTEs (FTE-type FRs), which transport magnetic flux from the dayside magnetosphere into the nightside following the convection of FTEs. Solar wind plasma can be transported along the magnetic field lines and precipitate to the surface at the planet’s cusps causing sputtering [2]. MESSENGER observations have shown that FTE showers correspond to a very high occurrence of FTEs (~ 10 FTEs per minute) [1, 3].
In this work, we investigate how the low Alfvénic Mach number (MA = VSW/VA) solar wind near Mercury’s orbit influences the occurrence and physical properties of FTE showers, and how FTE showers contribute to the Dungey cycle and influence sodium ions dynamics in the dayside magnetosphere.
2. FTE Shower at Mercury
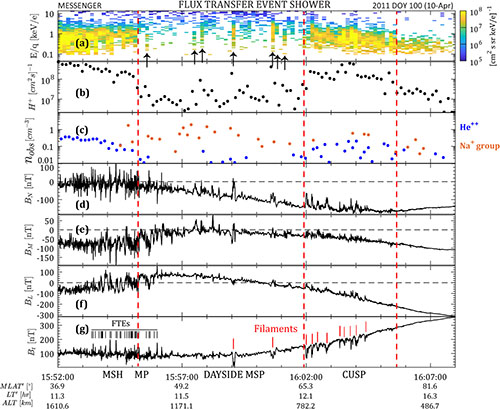
Figure 1. Overview of MESSENGER observations of a dayside magnetosphere crossing on 10 April 2011. (a) and (b) Differential and integrated particle flux for protons. (c) Densities of alpha particle (He++) and sodium group (Na+, m/q = 21 to 30). (d) to (g) Magnetic field measurements. The black arrows in (a) annotate the injected solar wind particles. FTEs and plasma filaments are marked in (g).
Figure 1 shows a FTE shower event observed by MESSENGER on 10 April 2011. Thirty-four FTE-type FRs appeared in two and half minutes surrounding the dayside magnetopause (~ 14 FTEs/minute). The occurrence of FTEs at Mercury is much higher than those at Earth, Jupiter and Saturn, which are commonly separated by several minutes [4]. The magnetic field intensity in the magnetosheath is even slightly larger than the magnetic field intensity in the magnetosphere, implying a thick plasma depletion layer with a low plasma ( 0.1) adjacent to the magnetopause. Magnetic shear angle across the dayside magnetopause is around 120.
The injected solar wind particles are marked in Figure 1a. In the low altitude region, especially at the cusp, the injected particles diamagnetically reduce the field strength and form the plasma filaments (Figure 1g, see also ref. [2]). The injected solar wind particles could precipitate to the surface and sputter planetary atoms refilling the exosphere. Planetary Na+ appear in a density of ~ 1 cm-3, which is around an order of magnitude higher than the average Na+ densities in the subsolar region [5].
3. Statistical Results
This study conducts a survey over the entire MESSENGER mission. In a total number of 3748 magnetopause crossings, around half (52%) of them were found to be accompanied by FTE showers. Further detailed investigations show that FTE showers occur more frequently when the magnetic shear angle is large and the magnetosheath plasma is small. The repetition time, i.e., the separation between neighboring FRs, and core magnetic field of FRs are negatively correlated with the shear angle and the plasma . The duration of FRs is positively correlated with the shear angle and the plasma . FTE showers could carry 60% to 85% of the magnetic flux needed to supply Mercury’s Dungey cycle.
The planetary Na+ is substantially enhanced during the FTE shower intervals compared with the Na+ during other intervals. The total number of Na+ on the dayside magnetosphere in the FTE shower intervals is more than twice the number of Na+ during the intervals without FTE showers. Since FTE shower events depend on solar wind variations, which last tens of minutes to an hour, the corresponding enhancements of exospheric Na+ should be on the scale of same order, i.e., short-term variations.
4. Conclusions
We have shown that the occurrence and physical properties of FTE showers clearly depend on the magnetic shear angle across the magnetopause current sheet and the magnetosheath plasma β. FTE showers play a dominant role in the flux circulation of Mercury’s Dungey cycle. Furthermore, FTE showers are closely associated with substantial enhancements in the Na+ density in the dayside magnetosphere.
How to cite: Sun, W.-J., Slavin, J., Smith, A., Dewey, R., Poh, G., Jia, X., Raines, J., Livi, S., Saito, Y., Gershman, D., DiBraccio, G., Imber, S., Guo, J., Fu, S., Zong, Q.-G., and Zhao, J.: MESSENGER observations of flux transfer event showers at Mercury: Contributions to Dungey cycle and influences on magnetospheric sodium ions, Europlanet Science Congress 2020, online, 21 Sep–9 Oct 2020, EPSC2020-62, https://doi.org/10.5194/epsc2020-62, 2020.
MESSENGER observations used to constrain surface composition suggest a global magma ocean formed on early Mercury [1, 2]. Our study models the coupled evolution of the Hermean magma ocean and atmosphere, and determines the extent of exospheric loss from an atmosphere formed by evaporation of a magma ocean. Using our framework to couple the interior and exterior chemical reservoirs, we evaluate a range of possible atmospheric evolution scenarios for early Mercury. These include the possibility that Mercury was fully-accreted before a mantle stripping event caused by a giant impact [3] led to degassing, or alternatively that the building blocks of Mercury were already relatively volatile-free.
Assuming an initial surface temperature of 2500 K and an oxygen fugacity fixed at 1 log unit below the Iron-Wüstite buffer, we find that the Hermean magma ocean cooled to 1500 K (the rheological transition) in around 400 to 9000 yrs, depending on the efficiency of radiative heat transfer in the atmosphere. We investigate the behaviour of two endmember cases: (1) a present-day sized Mercury that is volatile free and thus cools in a manner similar to that of a blackbody, and (2) a larger Mercury that is sufficiently volatile-rich to provide a greenhouse atmosphere that delays cooling. During the magma ocean stage, evaporation and sublimation of oxide components from the molten silicate magma contribute to the growth of the atmosphere, in addition to volatile outgassing. For the endmember case with initial volatile abundances based on enstatite chondrite-like precursors, the atmosphere is dominated by CO, CO2, H2, and H2O, with minor abundances of SiO, Na, K, Mg, and Fe gas species. For the endmember case without major volatiles (C, H), the atmospheric composition is dominated by metal- and metal oxide gas species only.
We apply a Monte Carlo (MC) atmospheric loss model [4] to calculate exospheric losses for all pathways and find that photoionization is the dominant loss mechanism for early Mercury. Cases both with and without major volatiles reveal that the atmosphere lasts between 100 and 250 years before the near-surface of Mercury becomes solid. Preliminary MC results show that photo-dissociation considerably alters the atmospheric composition, efficiently breaking SiO2 into SiO+ and O. Solar wind and magnetospheric plasma leads to rapid evacuation of the ionized species from the neutral exosphere whereas oxygen is lost efficiently by Jeans escape.
Using our coupled framework, future modelling efforts will aim to understand if and how the evaporation of the magma ocean of early Mercury has modified its surface composition, with a view to interpreting BepiColombo observations. Hence our work provides an important step to connect Mercury’s formation, earliest evolution, and upcoming observations.
References: [1] Vander Kaaden, K. E. and McCubbin, F. M. (2016). Cosmochim. Ac., 173, 246–263. [2] Berthet, S., Malavergne, V., and Righter, K. (2009). Geochim. Cosmochim. Ac., 73(20), 6402–6420. [3] Benz, W., et al. (2008). Mercury, pp. 7–20. Springer. [4] Wurz, P., and Lammer, H. (2003). Icarus, 164(1), 1–13
How to cite: Gamborino, D., Jäggi, N., Bower, D. J., Wolf, A., Sossi, P., Vorburger, A., Oza, A. V., Ligterink, N. F. W., and Wurz, P.: A magma ocean origin for Mercury's earliest exosphere, Europlanet Science Congress 2020, online, 21 Sep–9 Oct 2020, EPSC2020-571, https://doi.org/10.5194/epsc2020-571, 2020.
Mercury's sodium atmosphere has been the subject of many studies since it's discovery in 1985, with its extended corona and the tail-like structure probably forming its most famous attribute [5, 8, 10, 12]. In addition, the Na atmosphere is temporally and spatially variable, concentrated on the dayside, often enhanced close to the north and south poles (with a moderate north-south asymmetry), and correlates with in situ magnetic field observations. [3, 4, 6, 7, 9, 11]. MESSENGER observations, carried out between 2011 and 2015, show little or no year-to-year variation and a dawn-dusk asymmetry in Mercury's sodium atmosphere [2]. In this presentation we analyse different sodium surface release mechanisms and determine their contribution to the Hermean Na exosphere by comparing our model results to published MESSENGER measurements.
1. MESSENGER observations
The MESSENGER measurement we use as a baseline for this study was presented by [1] in their Figure 7. According to their observations, the sodium column density ranges from >1012 cm–2 at the surface to ~107 cm–2 at ~3500 km altitude, exhibits a steep fall-off close to the surface, and starts to flatten out at ~700 km.
2. Monte-Carlo Model
The Monte-Carlo model used herein was first presented in 2003 [13]. In this model, a large number of particles (typically on the order of 106) are traced individually ab initio. Source mechanisms relevant to Mercury's exosphere are (i) thermal desorption, (ii) photon-stimulated desorption, (iii) sputtering, and (iv) micro-meteorite impact vaporization. Figure 1 shows the energy distribution functions associated with these four release processes. For this specific analysis, the effect due to radiation pressure, and an improved energy distribution for photon-stimulated desorption was added [14]. Particles are removed from the calculation domain when they (i) are ionised, (ii) fall back and stick to the surface, or (iii) reach the Hill-sphere.

Figure 1: Normalized energy distribution functions for (i) thermal desorption, (ii) photon-stimulated desorption, (iii) sputtering, and (iv) micro-meteorite impact vaporization. The vertical line shows the escape energy.
3. Simulation Parameters & Geometry
Limb scan data from the MASCS/UVVS instrument on MESSENGER presented in [1] Figure 7 was taken on 16 June 2012 at a local time of ~12:00. On that date, Mercury was at a true anomaly angle of TAA = 99°, which means that the radiation pressure was almost at its maximum. The scan itself extends from just above the surface up to an altitude of several thousand km.
4. Results and Discussion
Our analysis shows that the measurement presented by [1] can be quantitatively reproduced by particles originating from two different source mechanisms. Close to the surface, thermal desorbed Na particles with a surface temperature of 594 K dominate the exosphere. At higher altitudes, Na particles released by micro-meteorite vaporization dominate. Both the shape and the absolute value of the modelled tangent column density agree well with the measurements.
5. References
How to cite: Wurz, P., Vorburger, A., and Gamborino, D.: Mercury's Sodium Exosphere: Interpretion of MESSENGER Observations, Europlanet Science Congress 2020, online, 21 Sep–9 Oct 2020, EPSC2020-178, https://doi.org/10.5194/epsc2020-178, 2020.
The interaction between the interplanetary medium and planetary environments gives rise to different phenomena according to the spatio-temporal scales. Here we apply for the first time a novel data analysis method, i.e., the Hilbert-Huang Transform, to discriminate both local and global properties of Venus’ and Mercury’s environments as seen during two MESSENGER flybys. Hence, we may infer that the near-Venus environment is similar in terms of local and global features to the ambient solar wind, possibly related to the induced nature of Venus’ magnetosphere. Conversely, the near-Mercury environment presents some different local features with respect to the ambient solar wind, due to both interaction processes and intrinsic structures of the Hermean environment. Our findings support the ion kinetic nature of the Hermean plasma structures, with the foreshock and the magnetosheath regions being characterized by inhomogeneous ion-kinetic intermittent fluctuations, together with MHD and large-scale fluctuations, the latter being representative of the main structure of the magnetosphere. We also show that the HHT analysis allow to capture and reproduce some interesting features of the Hermean environment as flux transfer events, Kelvin-Helmholtz vortex, and ULF wave activity, thus providing a suitable method for characterizing physical processes of different nature. Our approach demonstrate to be very promising for the characterization of the structure and dynamics of planetary magnetic field at different scales, for the identification of different planetary regions, and for the detection of the “effective” planetary magnetic field that can be used for modelling purposes.
How to cite: Alberti, T., Milillo, A., Laurenza, M., Massetti, S., Ivanovski, S., Ippolito, A., Plainaki, C., De Angelis, E., Mangano, V., Mura, A., Orsini, S., and Rispoli, R.: The Hilbert-Huang Transform (HHT) as a tool for characterizing dynamical features of Mercury’s and Venus’ magnetospheres, Europlanet Science Congress 2020, online, 21 Sep–9 Oct 2020, EPSC2020-89, https://doi.org/10.5194/epsc2020-89, 2020.
We examine the effects of the interplanetary magnetic field (IMF) orientation and solar wind dynamic pressure on the solar wind proton precipitation to the surface of Mercury. We use the Amitis model, a three-dimensional GPU-based hybrid model of plasma (particle ions and fluid electrons), and explain a method we found necessary to accurately calculate plasma precipitation to the surface of Mercury through the highly dynamic Hermean magnetosphere. We use our model to explain ground-based telescope observations of Mercury's neutral sodium exosphere, and compare our simulation results with MESSENGER observations. For the typical solar wind dynamic pressure near the orbit of Mercury (i.e., ~7-8 nPa) our model shows a high solar wind proton flux precipitates through the magnetospheric cusps to the high latitudes on both hemispheres on the dayside with a higher precipitation rate to the southern hemisphere compared to the north, which is associated with the northward displacement of Mercury's intrinsic magnetic dipole. We show that this two peak pattern, which is also a common feature observed for neutral sodium exosphere, is controlled by the radial component (Bx) of the IMF and not the Bz component. Our model also suggests that the southward IMF and its associated magnetic reconnection do not play a major role in controlling plasma precipitation to the surface of Mercury through the magnetospheric cusps, in agreement with MESSENGER observations that show that, unlike the Earth, there is almost no dependence between the IMF angle and magnetic reconnection rate at Mercury. For the typical solar wind dynamic pressure, our model suggests that the solar wind proton precipitation through the cusps is longitudinally centered near noon with ~11o latitudinal extent in the north and ~21o latitudinal extent in the south, which is consistent with MESSENGER observations. We found an anti-correlation in the incidence area on the surface and the incidence particle rate between the northern and southern cusp precipitation such that the total area and the total rate through both of the cusps remain constant and independent of the IMF orientation. We also show that the solar wind proton incidence rate to the entire surface of Mercury is higher when the IMF has a northward component and nearly half of the incidence flux impacts the low latitudes on the nightside. During extreme solar events (e.g., Coronal Mass Ejections) a large area on the dayside surface of Mercury is exposed to the solar wind plasma, especially in the southern hemisphere. Our model suggests that over 70 nPa solar wind dynamic pressure is required for the entire surface of Mercury to be exposed to the solar wind plasma.
How to cite: Fatemi, S., Poppe, A. R., and Barabash, S.: Solar wind proton precipitation to the surface of Mercury, Europlanet Science Congress 2020, online, 21 Sep–9 Oct 2020, EPSC2020-31, https://doi.org/10.5194/epsc2020-31, 2020.
Planet surfaces exposed to high energy plasma undergo surface alteration by sputtering (e.g., [1]). Impinging ions thereby eject particles from the uppermost layers of mineral grains. The effect that sputtering has on surface reflectivity in mid infrared (MIR) is relevant for the interpretation of surface-based spectra as well as future Bepi Colombo MIR spectra. Previous studies have shown that the IR spectrum of a given mixture varies with its porosity, grain size, temperature, emergence angle and mineral to glass ratio [2, 3, 4, 5, 6].
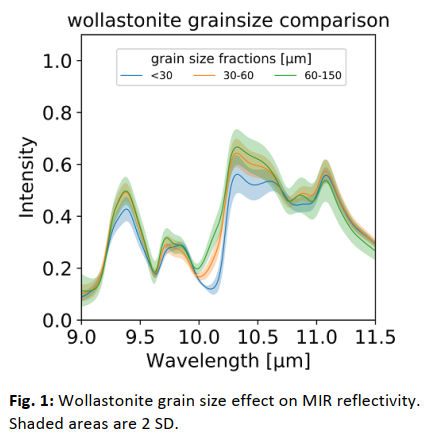
This study uses the mineral diopside (CaMgSi2O6), enstatite (Mg2Si2O6), wollastonite (Ca2Si2O6), and bytownite (Na0.2Ca0.8Al2Si2O8) as analogues for the surfaces of Moon and Mercury. The minerals were ground to flocculation resulting in mean grain sizes of 20-34 µm and then and pressed into pellets with porosities of about 20 %. In addition to bulk powder pellets, wollastonite powder fractions of <30, 30-60 and 60-150 µm were produced and analyzed. Mineral powder pellets were irradiated by He2+ with solar wind characteristic energies of 4 keV under an incident angle of 45°.
Before ion irradiation, MIR spectra show an expected, strong dependence on grain size (Figure 1, e.g., [3]). First results of irradiated wollastonite bulk powder pellets with mean grain sizes of 34 µm are presented in Figure 2. IR reflectivity after irradiation shows changes in relative peak intensities and the apparent loss of peaks. A similar effect was observed when lowering grain size in the non-irradiated samples. These results suggest that solar wind sputtering effects add to the ambiguity for interpreting MIR data of planetary surfaces.

List of References
[1] Pieters, C. M., Noble, S. K. (2016). J. Geophys. Res.-Planet, 121(10), 1865–1884.
[2] Salisbury, J. W., Eastes, J. W. (1985). Icarus, 64(3), 586–588.
[3] Mancarella, F., et al. (2015). Planet. Space Sci., 117, 96–105.
[4] Varatharajan, I., et al. (2019). Earth and Planetary Science Letters, 520, 127–140.
[5] Maturilli, A., et al. (2016). Earth Planets Space, 68(1), 84.
[6] Young, C. L., et al. (2019). Icarus, 321, 71–81.
How to cite: Jäggi, N., Szabo, P. S., Biber, H., Mezger, K., Aumayr, F., Wurz, P., and Galli, A.: Solar wind sputtering on Mercury and the Moon: effects on mid infrared spectra of mineral powder pellet analogues, Europlanet Science Congress 2020, online, 21 Sep–9 Oct 2020, EPSC2020-179, https://doi.org/10.5194/epsc2020-179, 2020.
Abstract
Planets and other objects in the solar system are exposed to a stream of ions originating from the sun, the solar wind. It has sufficient energy to alter the surface of airless bodies like Mercury via sputtering processes and may create a tenuous exosphere of ejected particles surrounding these objects. Knowing the material parameters relevant for sputtering processes is therefore crucial to understand planetary surfaces. Based on previous efforts with a quartz crystal micro balance as catcher, a more flexible system for evaluating sputtering yields of realistic mineral samples was developed. This allows for direct comparison between glassy thin films and mineral pellet samples with varying properties like grain size or porosity.
Introduction
Irradiating thin films of material deposited onto Quartz Crystal Microbalances (QCM) is a common technique for determining ion sputtering yields. It allows precise measurements of the samples mass change during irradiation with ion beams [1, 2, 3]. When Pulsed Laser Deposition (PLD) is used for the transfer of sample material onto a quartz, the original sample stoichiometry can often be reproduced [3]. Due to material constraints of the quartz crystals, the temperature during deposition may not exceed 846 K [4], resulting in glassy sample films.
It is however desired to irradiate mineral analogue samples, as the number and angular distribution of sputtered particles might be different for crystals and glassy films and depend on the grain size. One way of approaching this is by weighing a bulk sample before and after irradiation [5]. This technique lacks the high precision of QCMs, which allow determining changes of sample mass equal to less than a monolayer of material [1]. An alternative approach is the detection of ejecta, for example with a pressure gauge, or a QCM as catcher [6, 7].
At TU Wien, a technique using a QCM for catching sputtered material (C-QCM) was developed earlier, showing the ability to determine sputtering yields from bulk samples with such a method [7]. However, this previous setup was limited in its geometry, with the C-QCM placed on a linear manipulator. In this setup, determining the angular distribution of sputtered material required changing distance and tilt angle between sample and C-QCM.
New setup for angular resolved measurements
In the new setup, the sample is mounted on a rotatable holder, which allows for an angular resolved investigation of sputtering yields (angle α in Figure 1). The C-QCM is mounted on a second sample holder and the angle αC between both can be varied independently from α. Sample and C-QCM are placed coaxial, which guarantees a fixed distance and a variable tilt angle. This is of advantage, as the distance dependence of the C-QCM signal follows an inverse-square law and can therefore significantly increase the measurement uncertainty.

Figure 1: Principle of the Measurement using a QCM as a catcher. The distance can be kept constant while the angles sample/ions α and sample/C-QCM αC are varied.
For the irradiation experiments, ions with solar wind velocity of 440 km s-1 [8] are generated in an Electron Cyclotron Resonance ion source. They are then guided towards the sample holder using electromagnets and electrostatic lenses [9].
To avoid charging up of the insulating mineral pellets, the setup is also equipped with an electron flood gun. It delivers electrons with an energy of about 30 eV and is pointed towards the irradiated area, neutralizing the positive charge otherwise accumulating on the sample.
The sample holder is equipped with an ohmic heater and a K-type thermocouple. Combined with a Quadrupole Mass Spectrometer, not only irradiations at different sample temperatures, but also Thermal Desorption Spectroscopy (TDS) measurements after irradiations are possible. These can give important information about the implantation and diffusion of solar wind ions in minerals.
A QCM thin film sample and a pellet sample can be installed into the experimental chamber at the same time. Both mounts are placed in the same plane which is on the axis of rotation. By moving between both samples with the help of a linear feedthrough, C-QCM signals can be compared directly as the geometry stays the same. This has the additional benefit, that sputtering yields of the thin film sample can be directly evaluated and used for calibration.
This new setup allows investigation of sputtering yield and angular distribution for a wide variety of realistic samples. Effects of grain size, surface roughness and porosity on sputtering can be studied and compared with simulations [10] to get a more complete picture on sputtering processes on Mercury's surface.
References
[1] Hayderer G., et al.: A highly sensitive quartz-crystal microbalance for sputtering investigations in slow ion–surface collisions, Rev. Sci. Instrum., 70, 3696, 1999.
[2] Hijazi H., et al.: Kinetic and potential sputtering of an anorthite-like glassy thin film, J. Geophys. Res. Planets, 122, 1597, 2017.
[3] Szabo P. S., et al.: Solar wind sputtering of wollastonite as a lunar analogue material – Comparisons between experiments and simulations, Icarus, 314, 98, 2018.
[4] Cook R. K., et al.: Piezoelectric constants of alpha-and beta-quartz at various temperatures, Phys. Rev., 80, 712, 1950.
[5] Goschnick J., et al.: Sputter yields and erosion rates for low energy ion bombardment of multielemental powders, Nucl. Instrum. Methods Phys. Res. B, 83, 339, 1993.
[6] Galli A., et al.: Surface charging of thick porous water ice layers relevant for ion sputtering experiments, Planet. Space Sci., 126, 63, 2016.
[7] Berger B. M., et al.: Sputtering measurements using a quartz crystal microbalance as a catcher, Nucl. Instrum. Methods Phys. Res. B, 406, 533, 2017.
[8] Wurz P., et al.: Self-consistent modelling of Mercury’s exosphere by sputtering, micro-meteorite impact and photon-stimulated desorption, Planet. Space Sci., 58, 1599, 2010.
[9] Dobes K., et al.: Transient effects during sputtering of aC: H surfaces by nitrogen ions, Nucl. Instrum. Methods Phys. Res. B, 286, 20, 2012.
[10] Stadlmayr R., et al.: Sputtering of nanostructured tungsten and comparison to modelling with TRI3DYN, J. Nucl. Mater., 532, 152019, 2020.
How to cite: Biber, H., Szabo, P. S., Cupak, C., Jäggi, N., Galli, A., Wurz, P., and Aumayr, F.: A quartz crystal microbalance for investigating the angular distribution of particles sputtered from realistic mineral samples, Europlanet Science Congress 2020, online, 21 Sep–9 Oct 2020, EPSC2020-264, https://doi.org/10.5194/epsc2020-264, 2020.
Until almost a decade ago Mercury was considered by some scientists to be very similar to the Moon. Both are small rocky bodies in the inner solar system with thin exospheres and no large scale traces of recent geological activity. However Mercury’s surface reflects much less sunlight than the Moon, making it an extremely dark body. To explain the reasons for this difference, significant abundances of iron and titanium (and their oxides) were proposed for the Hermean surface after the first NASA MESSENGER flyby of Mercury. But once in orbit around the planet, the NASA MESSENGER GRS instruments found very small abundances of iron, confirming earlier ground-based spectroscopy observations, and virtually no titanium. Therefore neither of the elements can account for this diversity. Recent analysis of MESSENGER data acquired for the darkest regions of Mercury’s surface suggest that the unknown darkening material could be carbon, in particular as the mineral graphite [1] whose abundance in the darker regions is predicted to be 1 to 3 wt% higher than the surroundings.
Last year at the Planetary Spectroscopy Laboratory (PSL) of the Institute of Planetary Research (DLR, Berlin) we measured reflectance spectra of graphite from UV to TIR spectral range (0.2 to 20 µm) under several phase angles. Reflectance spectra of samples were measured fresh and after heating (100° to 400° C, step 100° C) in vacuum for 8 hours. Reflectance spectra of komatiite (chosen as Mercury surface simulant, after [2]) was measured alone and mixed with few % of graphite to reproduce the results from [1], following the same procedure as for graphite. [JH1]
Emissivity spectra for the same set of samples was measured in vacuum (< 0.8 mbar) for successive steps of surface temperatures from 100°C to 400°C in the TIR spectral range (1 to ~ 18 µm) in preparation for analysis of data collected by the Mercury Radiometer and Thermal Infrared Spectrometer (MERTIS), a spectrometer developed by DLR, jointly with the Wilhelms Universität in Münster, on board of the ESA BepiColombo Mercury Planetary Orbiter (MPO) on its way to Mercury since October 2018 [3].
Emissivity spectra of pure Komatiite, graphite, and their mixture (graphite is 5% in weight) were measured along 2 consecutive days to reproduce day and night insulation conditions on Mercury. Effects of graphite mixed to Komatiite could be seen in the Christiansen Feature (CF) and surrounding regions (Figure 1).

Figure 1. Emissivity spectra for the 3 Mercury analogues measured in vacuum at 100°, 200°, 300°, and 400° C over the MERTIS spectral range. Graphite spectral feature is highlighted in the region around 8 µm.
Following up on the study performed last year on the spectral effect of graphite mixed with a mercury simulant soil, we concentrated this year on the effect of graphite on reflectance and emissivity spectra of pure minerals (chosen among the list of mercury analogues) when mixed with 5% graphite. Minerals were selected following the list we already published in [5]: among them, we selected Inosilicates (enstatite and diopside), Plagioclase feldspars (albite, labradorite and bytownite), Alkali feldspars (microcline, orthoclase), and a forsterite Fo90.
The MESSENGER mission discovered that Mercury is richer in volatiles than previously expected. This is especially true for sulfur (S), with an average abundance of 4 wt%. It has been proposed that sulfur in the interior of Mercury is brought to the surface through volcanic activity in the form of sulfides as slag deposits in Mercury hollows and pyroclastic deposits. In the case of Mercury, the effect of thermal weathering affecting the spectral behavior of these sulfides must be studied carefully for their effective detection. To continue with our study, we selected some synthetic sulfides including MgS, FeS, CaS, CrS, TiS, NaS, and MnS [6]. For each sample pure and with 5% graphite mixed, we performed emissivity measurements in the thermal infrared range for sample temperatures from 100 °C to 400 °C (step 100° C), covering the daytime temperature cycle on Mercury's surface. In addition, we measured the spectral reflectance of fresh and thermally processed sulfides over a wide spectral range (0.2–20 μm) and under several phase angles [6].
This spectral library facilitates the detection of sulfides in the presence of graphite by past and future missions to Mercury by any optical. Emissivity measurements in this study will support the MERTIS instrument on the ESA/JAXA BepiColombo mission, while the reflectance of these samples in 0.2–20 μm at various phase angles will support the interpretation of measurements from past (MDIS, MASCS on MESSENGER) and future missions (SIMBIO-SYS on BepiColombo).
We plan to conclude this systematic study with a follow-up experiment, where it is planned to continue this study using different graphite samples and a finer graphite sample (g.s. < 10 µm) to better simulate the predicted very fine particles to be found on Mercury surface. We will monitor the influence of heating temperature on the spectral features of our samples to understand the effect of impact heating on the graphite layer beneath the Martian crust, as explained in [1].
References:
[1] Peplowski P.N., Klima R.L., Lawrence D.J., Ernst C.M., Denevi B.W., Frank E.A., Goldsten J.O., Murchie S.L., Nittler L.R., Solomon S.C. (2016) Nature Geoscience 9, 273–276, doi:10.1038/ngeo2669.
[2] Maturilli A., Helbert J., St. John J.M., Head III J.W., Vaughan W.M., D’Amore M., Gottschalk M. (2014), EPSL 398, 58–65.
[3] Maturilli A., Helbert J., and Varatharajan I. (2019), LPSC L, Abstract #1841.
[4] D’Amore M. et al. (2019) LPSC L, Abstract #1809.
[5] Helbert J., L.V. Moroz, A. Maturilli, A. Bischoff, J. Warell, A. Sprague, E. Palomba (2007) Advances in Space Research 40, 272–279.
[6] Varatharajan, I., A. Maturilli, J. Helbert, G. Alemanno, H. Hiesinger (2019) EPSL 520, 127–140.
How to cite: Maturilli, A., Helbert, J., Alemanno, G., D'Amore, M., Varatharajan, I., and Hiesinger, H.: Effect of grafite on emissivity and reflectance spectra for Mercury surface simulants, Europlanet Science Congress 2020, online, 21 Sep–9 Oct 2020, EPSC2020-275, https://doi.org/10.5194/epsc2020-275, 2020.
Mercury's tectonic history has been dominated by global contraction as the planet cools and shrinks. Previously, fault dips have been estimated by measuring offsets to the rims of craters displaced by fault movement. Here we present the first observations of a fault surface that has been exposed in three dimensions by a volcanic vent.
Contractional tectonism is manifested through features such as lobate scarps, wrinkle ridges, and high relief ridges 1,2. The stresses in Mercury's crust that generated this contractional tectonism have multiple possible origins. These include global contraction 3, tidal despinning 4, true polar wander 5, and mantle convection 6. A combination of factors probably generates many faults, but the dominant driver of contractional tectonics on Mercury is the global contraction of the planet 7. This shrinking may be up to 10 km radially. The estimates of the actual amount of reduction in global radius recorded by Mercury’s crust is 7.1 km if the average fault dip is 25o but as little as 4.7 km if the average fault dip is 35o11. An understanding of the dip of the faults on Mercury provides better input into these estimates and hence offers constraints on Mercury's thermal history.
In the past, only indirect means were available to calculate dips of thrust faults, by using the shortening and vertical offset of craters that straddle faults 10,12. These studies derived an average dip of 25o. Until now, no-fault dip on Mercury has been measured by direct means.
A crater located at 147.6oE, -65.6o N shows a small fault scarp that is visible on the side of a volcanic vent, and the trace is expressed also on the vent wall and floor. This is the first known fault surface on Mercury that is exposed in three dimensions.
While a dip determination on a single fault is not conclusive, this result suggests that the shallower dip estimates are likely more representative estimates for average fault dips on Mercury and so adds weight to the higher end of the estimates of global contraction. Unfortunately, the resolution is insufficient for us to measure displacement by means of off-set features. BepiColombo will provide further opportunities to identify and measure similar features elsewhere on Mercury, and so help constrain the planet’s tectonic processes.
References:
How to cite: Pegg, D. L., Rothery, D. A., Conway, S. J., and Balme, M. R.: A Fault on Mercury Revealed in 3-Dimensions, Europlanet Science Congress 2020, online, 21 Sep–9 Oct 2020, EPSC2020-81, https://doi.org/10.5194/epsc2020-81, 2020.
Introduction
The MErcury Surface, Space ENvironnement, GEochemistry and Ranging (MESSENGER) mission highlighted the explosive volatile-driven volcanism on the surface of Mercury (Head et al. 2008). Witnesses of this volcanic activity are irregularly shaped depressions surrounded by deposits that are spectrally bright and red relative to the average surface of Mercury (Head et al. 2008, Kerber et al. 2009). The characteristics of these deposits (association with volcanic vents, spectral anomaly and diffuse margins) and the lack of Hermean atmosphere suggest an emplacement by ejection of pyroclasts along ballistic trajectories. A catalogue of around 200 candidates for pyroclastic deposits was established (Kerber et al. 2011, Goudge et al. 2014, Thomas et al. 2014). Besse et al. (2020) studied 14 of these deposits using the Mercury Atmospheric and Surface Composition Spectrometer (MASCS) on board MESSENGER. In some cases, the size of the deposit estimated in the previous catalogues (Kerber et al. 2011, Goudge et al. 2014, Thomas et al. 2014) using multispectral images is found to be underestimated. The spatial extent of the pyroclastic deposits is crucial to estimate the total amount of lava and the quantity of volatile species needed to drive the volcanic eruption on Mercury. Here we present the preliminary results of a global survey of pyroclastic deposits on the surface of Mercury using a spectral database containing MASCS observations.
Goals and preliminary results
We base our analysis on the MASCS data sets available on the Planetary Data System (PDS), grouped in a spectral database containing observations, along with and metadata provided by the MESSENGER team. The Mercury Surface Spectroscopy (MeSS) project provides MASCS spectra corrected according to the method proposed by Besse et al. (2015). From these corrected spectra we have computed several spectral parameters available in the database such as the UV-Downturn (Goudge et al. 2014) describing the drop of the reflectance in the ultraviolet (UV), spectral slope in the visible domain and the reflectance at 750 nm. The two first spectral parameters were used in the study of Besse et al. (2020) to determine the extent of some pyroclastic deposits. Our main objective is to extend this analysis to all the pyroclastic deposits of Mercury’s surface.
Thanks to the database we confirm that 40% of pyroclastic deposit candidates show a spectral anomaly with MASCS. In fact, the value of the spectral parameters is higher in the deposit than in the surrounding terrain (example in Figure 1). Therefore, we normalized the spectral parameters by a local mean for each cases. These spectral parameters decrease from the vent up to a certain distance before stabilizing around the local mean which we interpret as the limit of the deposit. We have implemented a method that allows us to determine the extent of pyroclastic deposits in a systematic way and with a level of confidence. The first results are in agreement with the previous results obtained by Besse et al. (2020) and show the robustness of the method.
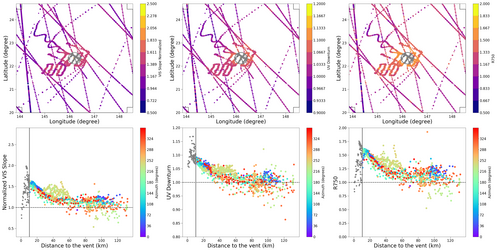
Figure 1: Spectral analysis of Agwo facula using The MeSS (Mercury Surface Spectroscopy) database. Top: Maps of the Agwo facula region, each dot corresponds to MASCS spectrum. The color code shows the value of the spectral parameters (visible slope, UV-Downturn, near-infrared slope). The grey circle represents the limit of the volcanic vent. The squares indicate the regions where the local mean is calculated. Bottom: Normalized spectral parameters versus the distance to the volcanic vent. The horizontal black lines indicate the value of the local mean. The color code represents the geographical azimuth of the observations.
Acknowledgments
The authors acknowledge the Centre National d'Etudes Spatiales (CNES) for support.
The European Space Agency supported the research of S. Besse and O. Barraud through the European Space Astronomy Centre (ESAC) Faculty council.
References
Head J.W, et al. (2008), Science, 321, 69-72
Kerber, L. et al., (2009), Earth Planet. Sci. Lett. 285
Kerber, L. et al., (2011), Planet. Space Sci., 59
Goudge, T. A. et al., (2014), J. Geophys. Res. Planets, 119
Thomas, R. et al., (2014), J. Geophys. Res. Planets 119
Besse, S. et al., (2020), J. Geophys. Res. Planets, 125
Besse, S. et al., (2015), J. Geophys. Res. Planets, 120
How to cite: Barraud, O., Doressoundiram, A., Besse, S., Cornet, T., and Munoz, C.: New approach for systemic analysis of Hermean pyroclastic deposits, Europlanet Science Congress 2020, online, 21 Sep–9 Oct 2020, EPSC2020-301, https://doi.org/10.5194/epsc2020-301, 2020.
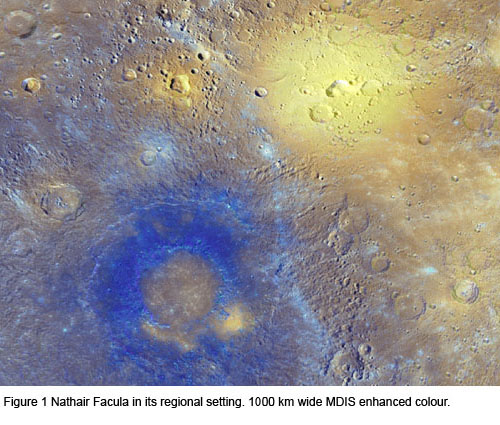
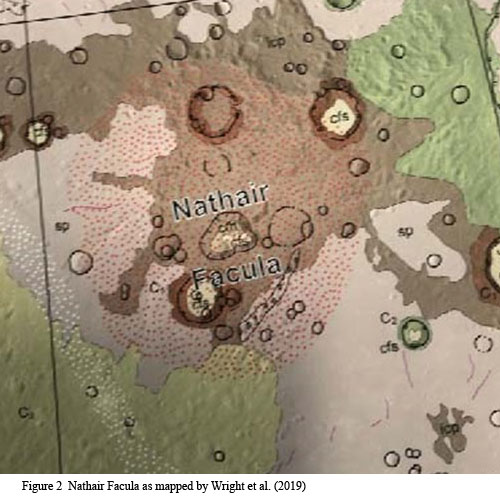
Nathair Facula (Figure 1) is the largest and most spectrally distinct of nearly 200 ‘bright red’ spots on Mercury’s surface. Most are accepted to be deposits from explosive volcanic eruptions. Nathair Facula hosts a central pit, but the mid-point of this facula is displaced about 20 km northwards from the middle of the pit. This poses unresolved questions about the eruption mechanism. The vent area is almost certainly a ‘compound vent’ where the eruption site migrated between eruptive episodes. It is unclear how a consistent asymmetry could be repeatedly engendered and reinforced by a series of eruptions rather than averaging out to a symmetrical distribution.
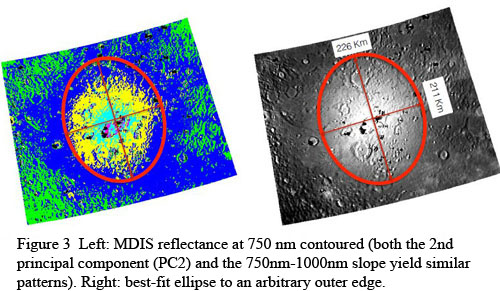
Nathair Facula’s radius was conservatively estimated at 71 km using MESSENGER fly-by images. However, orbital imagery reveals the radius to be double this. The vent was blasted through intercrater plains, but younger age constraints can be inferred because the facula overlies both smooth plains and ejecta from the c4 crater Rachmaninoff (Wright et al 2019), making it Mansurian or younger in age (younger than 1.7 Ga and possibly younger than 0.85 Ga).
When a facula results from explosive volcanism, the dispersal range can be used to estimate gas content at the seat of the eruption. Having been given their ejection velocity by gas expansion, the explosive ejecta particles would travel on ballistic trajectories in near-vacuum conditions. The large size of Mercury’s faculae supports the consensus that Mercury (or at least its crust) is rich in volatiles. These arguments remain broadly valid even for faculae that may be the cumulative product of a series of eruptions, which is particularly likely in the case of faculae whose central vent is a compound structure comprising multiple overlapping vents. Pegg et al. (2020) have shown that about 70% of vent sites on Mercury fall into this category.
Nathair Facula’s vent structure is a pit measuring 39 km on its long axis and 30 km on its short axis. As shown by Thomas et al. (2014) the brink of this pit is scarcely raised above the level of the surrounding terrain, but inside it plummets steeply (at about 30°) to an uneven floor more than 2 km below, with a greatest depth of about 3 km. In map view the brink is non-elliptical, having some sectors whose curvature is convex inwards, alternating with more strongly curved convex-outward sectors. Unlike many compound vents, this example lacks clear septa forming internal divisions between individual vents, although the floor has changes in texture and level that may reflect migration of the locus of explosive activity over time (Pegg et al., 2020).
The size and shape and asymmetry of Nathair Facula
A facula is a thin surficial deposit. It is visible because its spectral properties contrast with the underlying unit, possibly because of loss of carbon or sulfur from the ejected material. The original visible outer edge of the facula would have been radially gradational, where the cover by volcanic ejecta particles fell from 100% to zero. The spectral distinctiveness of a facula, particularly its thinner distal region, is likely to further blur over time because of impact gardening and general space weathering.
Thomas et al. (2014) and Wright et al. (2019) identified the radius of Nathair Facula visually, on enhanced MESSENGER MDIS images, as 130 km and 120 km respectively. Rather than fitting a notional circle to it, they attempted to show its true shape by drawing a slightly irregular boundary defining a roughly equidimensional deposit. The exact position of this boundary is subjective and depends on the whether it is drawn on the basis of a monochrome or colour image, and the contrast stretching used for display.
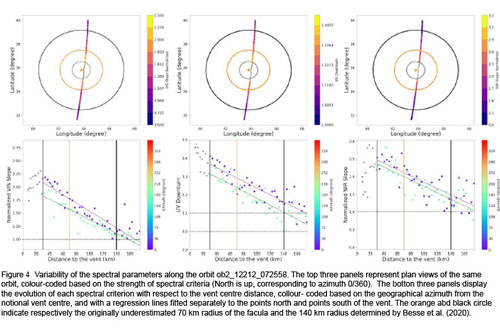
Besse et al. (2020) took a more objective approach to defining the edge of this facula (and several others) using spectroscopic data from MESSENGER’s MASCS (Mercury Atmospheric and Surface Composition Spectrometer) instrument, a non-imaging instrument that recorded UV-visible-near IR spectral along the spacecraft ground-tracks. They defined spectral parameters that are extreme in the inner part of faculae and decline to the planetary background value at the edge of the facula: the UV downturn, the VIS slope and the NIR slope. Along a nearly north-south line across Nathair Facula they used these data from one track to determine a radius of 140 km.
Careful inspection of enhanced MESSENGER colour images, such as Figure 1, and the map of Wright et al. (2019; Figure 2) shows that the facula is not actually centred on the vent, but is displaced northwards by about 20 km. Spectral analysis of MDIS data suggests the midpoint of the facula is in the NE of the vent, and reveals a slightly elliptical shape to the faculae edge (Figure 3). We interrogated data from five north-south MASCS crossings of Nathair Facula, distinguishing between data points north and south of the vent. One of these is illustrated in Figure 4, showing that each spectral parameter falls to the background level at a greater distance north than south of the notional vent centre. Table 1 gathers data from a total of five tracks. While each spectral parameter records a slightly different radius, in all cases where a radius can be determined it is greater in the north than in the south. In the case of the UV downturn, the mean and median agree on an approximately 21 km discrepancy between the north and south radii. This would be eliminated if the notional centre were shifted north by 10 km, but that would lie about 4 km north of the midpoint of even the northern part of the vent structure.
Future work will consider other spectral parameters.
Acknowledgements: Mapping and MDIS spectral studies have received funding from the EU Horizon 2020 research and innovation programme under grant agreement No. 776276, Planmap.
References
Besse, S. et al. 2020, J. Geophys. Res. Planets, 125(5)
Pegg, D. et al., 2020, British Planetary Science Conference
Thomas, R. et al., 2014, J. Geophys. Res. Planets 119, 2239
Wright, J. et al. 2019, J. Maps, 15, 509

How to cite: Rothery, D., Barraud, O., Besse, S., Carli, C., Pegg, D., Wright, J., and Zambon, F.: On the asymmetry of Nathair Facula, Europlanet Science Congress 2020, online, 21 Sep–9 Oct 2020, EPSC2020-782, https://doi.org/10.5194/epsc2020-782, 2020.
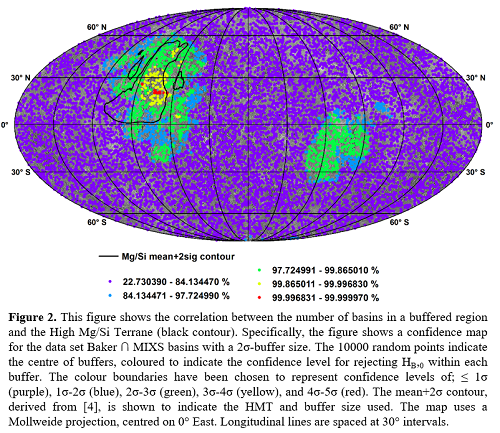
Introduction: As part of the target prioritisation for the Mercury Imaging X-ray Spectrometer (MIXS), we began by cataloguing all craters that still retain a central peak (or peak-ring) structure. We report on a correlation between Mercury’s peak-ring basins and a region with high Mg/Si values determined by MESSENGER XRS [1]. We explore impact as a mechanism for the elevated Mg/Si values.
Complex craters and basins uplift material from deep crustal and upper mantle levels (e.g. [2]). Recent work on Lunar peaked craters confirm that the central peaks act as ‘drill cores’ into the lower strata revealing compositions different from the surrounding terrain [3].
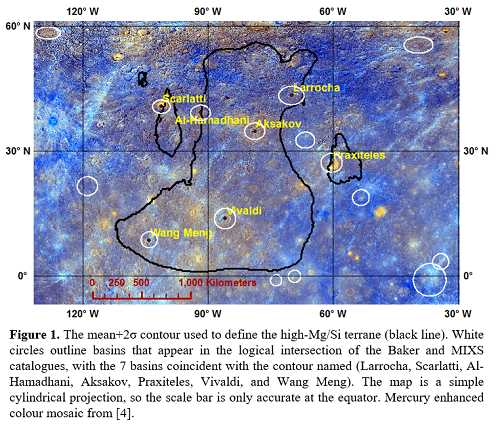
The High-Mg/Si Terrane (HMT) on Mercury exhibits the highest Mg/Si ratios identified on Mercury as well as low Al/Si ratios. It covers an area from approximately 120° W to 45° W and 10° S to 50° N, with an area >5,000,000km2 [1], (Fig. 1).
Methods: Three catalogues have been used: A catalogue of all Mercurian craters that retain a central peak structure, created by the authors using [4], for target prioritization for MIXS – the ‘MIXS’ catalogue. Key features were visually categorised as MIXS-T can likely resolve them in the future; Baker et al. [6], which morphometrically catalogues peak-ring basins, protobasins, and ring-cluster basins; Fassett et al. [7], which catalogues all of the craters on Mercury with diameter ≥20km.
Excavation depth was calculated from [8] and stratigraphic uplift was calculated for key basins using methods in [9]. Stratigraphic uplift equations are assumed to only hold for material that has not been excavated and are used with caution at Mercury [9]. Crustal thickness data was taken from [10] and combined with estimated basin depths to estimate the depth to the crust-mantle boundary.
We use a one-tail test to define precise confidence contours of the HMT (originally identified by [1]) using the mean and error values from [5]. This gives the hypotheses, HC,0: Mg/Si=0.436, HC,1: Mg/Si>0.436. Using the error, σ=0.106, we determine the confidence contours for the HMT (Fig. 1).
To assess basin statistics across the planet. 10,000 random points were selected on Mercury. The points acted as the centres for circular buffers for basin-counts, with an area equal to that enclosed by the specific Mg/Si confidence contour. Another one-tailed hypothesis test was then carried out. Let µ be the mean number of basins within the buffer radius and C be the actual number of basins within the specific confidence contour, then we have the general hypotheses, HB,0: C=µ, HB,1: C>µ. The global mean and standard deviation for basin counts were calculated for each crater set, then the hypotheses were tested for each buffer to determine if a greater-than-mean basin-count is present.
Results: The greatest overall confidence level (97.7%) is for the logical intersection (∩) of the Baker and MIXS sets, within the 2σ-contour. Figure 2 shows a confidence map for this data set. A high confidence level is also observed for the Baker and MIXS sets independently (>96.7% when using a 2σ-contour), with slightly lower (~1%) confidences when protobasins and ring-cluster basins are also included. The Fassett sets exhibited confidence distributions which do not coincide with the HMT.
Uplift and excavation calculations (above) suggest that the 7 basins coincident with the contour (Figure 1) were unlikely to have brought mantle material to the surface, although all but 1 (Praxiteles) uplifted mantle material to within ~10km of the basin floor. Calculations suggest that the impacts excavated material from crustal depths of ~13km to ~20km.
Discussion: The probability of a chance correlation between high densities of basins and the HMT is low, therefore, three possible hypotheses are suggested for the observed correlation: high-Mg mantle material has been excavated and/or uplifted to the surface; high-Mg deep crustal material has been excavated and/or uplifted to the surface; impacts caused fracturing in the underlying crust, which facilitated the subsequent extrusion of high-Mg magmas.
Excavation and uplift calculations indicate mantle was unlikely to be excavated, or uplifted to the surface. Deep crustal material was almost certainly excavated, although, assuming a ubiquitous deep crustal layer of high-Mg material around Mercury, similar size craters over regions of similar thickness crust would be expected to reveal a high Mg/Si signature. Analysis of the Fassett data did not support this correlation. From the available data, it cannot be ruled out that the giant impactors have fractured the underlying crust and allowed extrusion of basaltic magmas [11]. Given the high-Mg/Si of the HMT, it is expected that these magmas might have compositions similar to magnesian basalts or basaltic komatiites [12].
Conclusion: There is a strong statistical correspondence between peak-ring basins and the HMT. There is insufficient available evidence to assign any definite causal relationship, but it is considered likely that the basin impacts have revealed primitive igneous material with high Mg/Si, which is present at crustal depths not normally revealed by other basin-sized impacts. The material may have been directly revealed or the impact may have facilitated the subsequent extrusion of high-Mg magmas. BepiColombo’s improved geographic coverage, coupled with MIXS’s higher resolution and sensitivity will hopefully answer these questions definitively.
References:[1]-Weider, S.Z. et al. (2015) Earth Planet Sc Lett, 416, 109-120. [2]-Melosh, H.J. (1989) Impact cratering: a geologic process, Oxford University Press. [3]-Moriarty, D.P. et al. (2013) J Geophy Res-Planets, 118, 2310-2322. [4]-Denevi, B. W. et al. (2017) Space Sci Rev, 214:2. [5]-Nittler, L.R. et al. in Mercury: The View After MESSENGER, C. Solomon S.R., Nittler L. and Anderson B.J., Editors. Cambridge University Press. [6]-Baker, D.M.H., et al. (2011) Planet Space Sci, 59, 1932-1948. [7]-Fassett, C.I., et al. (2011) Geophys Res Lett, 38, L10202. [8]-Potter, R.W.K. and Head, J.W. (2016) 47th LPSC, Abstract #1117. [9]-Potter, R.W.K. et al. (2013) Geophys Res Lett, 40, 5615-5620. [10]-Smith, D. E., et al. (2012), Science, 316, 214-217. [11]-Frank, E. A., et al. (2017), J Geophy Res-Planets, 122, 614-632. [12]-Phillips, R. J. et al. (2018) in Mercury: The View After MESSENGER, C. Solomon S.R., Nittler L. and Anderson B.J., Editors. Cambridge University Press. [13]-Benkhoff, J., et al. (2010), Planet Space Sci, 58, 2-20.
How to cite: Hall, G., Martindale, A., Bridges, J., and Bunce, E.: The Distribution of Peak-Ring Basins on Mercury and their Correlation with the High-Mg/Si Terrane, Europlanet Science Congress 2020, online, 21 Sep–9 Oct 2020, EPSC2020-1103, https://doi.org/10.5194/epsc2020-1103, 2020.
Mercury’s polar regions host deposits of radar-bright material in regions of permanent shadow, commonly the interior of impact craters, and the deposits are hypothesised to be water ice (i.e., Chabot et al., 2018). Thermal modelling, prior to the arrival of the MESSENGER mission, found that water ice is not thermally stable in craters smaller than 10 km, assuming the craters had a depth-to-diameter ratio of 0.2 (Vasavada et al., 1999). Studies of the distribution of radar-bright deposits have identified deposits in craters under 10 km (Deutsch, et al., 2016). In this study, we used the high-resolution north polar topography from the MESSENGER mission to evaluate the morphometry and temperatures of craters with diameters of 5-10 km to explore if these craters could host stable water ice on geologic timescales.
We measured the depth and diameter of 201 5-10 km in diameter craters between 75-85° N. MLA tracks that bisected the crater were used to measure the depth and diameter of 99 craters, spanning all longitudes of this north polar region. Thermal models for the north polar region of Mercury use the gridded MLA topography sampled at 1 km resolution (Paige et al., 2013; Chabot et al., 2018), so it was important to ensure the gridded topography accurately captured the craters’ shapes before using the results of these thermal models for these small craters, Comparisons between the MLA track profiles and the profiles taken through the gridded MLA product showed consistent depth to diameter profiles in both datasets, substantiating the use of the gridded MLA product to be used to determine depth and diameter values for these craters and the thermal models for these craters to be used to explore the stability of water ice in these craters.
The average depth-to-diameter ratio of the 201 craters is 0.15, 25% lower than the estimate used in pre-MESSENGER thermal study (Vasavada et al., 1999). Thermal measurements of the 156 craters show that many of them have average temperatures below 110 K, meaning that they have thermal conditions that would allow water ice to be stable on geologic timescales under a thin layer of insulating material. Only three craters had small, single-pixel regions with maximum temperatures under 110 K, suggesting that water ice is not stable on the surface in the majority of small craters, except for isolated regions or below the 1-km scale of the thermal model. These results show that water ice would be stable in simple, sub-10 km diameter craters on Mercury and that the presence of radar-bright deposits in these craters is not a constraint on the age of radar-bright deposits.
However, our mapping results do show a clear correlation with radar-bright signatures and longitude. In particular, around 60°E longitude, we observe a higher percentage of radar-bright craters. One of Mercury’s two cold poles is nearby at 90°E, but a large complex crater, Prokofiev-112 km in diameter, is also located at 64°E and many of the craters that are radar-bright appear to be secondaries of Prokofiev. Possible explanations for this longitude distribution are being actively investigated, including association with Prokofiev, cold-pole thermal conditions, effects of radar visibility, and the potential for uneven water ice distribution in the small craters near Mercury’s north pole.
How to cite: Susorney, H., Ernst, C., and Chabot, N.: Morphometry and temperature of small sub-10 km craters at Mercury’s northern pole: Implications for source and stability of water ice, Europlanet Science Congress 2020, online, 21 Sep–9 Oct 2020, EPSC2020-96, https://doi.org/10.5194/epsc2020-96, 2020.
Introduction: The purpose of the IRIS (Infrared and Raman for Interplanetary Spectroscopy) laboratory is to produce laboratory spectra for the mid-infrared spectrometer MERTIS (Mercury Radiometer and Thermal Infrared Spectrometer) on the ESA/JAXA BepiColombo mission to Mercury. This device will map the mineralogy of the hermean surface spectral features in the 7-14 µm range, with a spatial resolution of ~ 500 meters [1,2].
For the interpretation the data from MERTIS, we need laboratory spectra for comparison. A wide range of natural mineral and rock samples such as terrestrial impact rocks and meteorites [e.g., 3-5] was studied for this purpose. Since we do not have natural samples from surface of Mercury, we produced synthetic analogs based on MESSENGER data and laboratory experiments [6-9]. A central component for such mixtures will be glass to replicate material formed by impact events and lava extrusion and explosive volcanism (i.e., pyroclastic debris) [e.g. 10]. We present results of our ongoing study of synthetic glasses. These synthetic glasses will be studied in the mid-infrared to obtain spectra for the IRIS database, the material will also used for future mixtures and experiments.
Samples and Techniques:
Sample Production: In order to simulate the petrologic evolution of magmas on early Mercury, we synthesized analog material under controlled temperature, pressure and oxidation state [7-9]. The glass was produced following a procedure described in [11] with the oxidation state controlled by exposing the sample to a CO-CO2 gas-mixture equivalent to four orders of magnitude below the iron-wüstite buffer (IW-4). For in-situ studies we selected run products from earlier, similar laboratory experiments [9].
Infrared Spectroscopy: For the bulk powder FTIR diffuse reflectance analyses, powder size fractions 0-25 µm, 25-63 µm, 63-125 µm, and 125-250 µm were measured, in addition to a polished sample. We used a Bruker Vertex 70 v infrared system with a MCT detector at the IRIS laboratories at the Institut für Planetologie in Münster. Analyses were conducted under low pressure to reduce atmospheric bands, analyses were made in reflectance from 2-20 µm.
FTIR microscope analyses for in-situ studies in polished blocks and thin sections were conducted using a Bruker Hyperion 1000/2000 System at the Hochschule Emden/Leer. We used a 250×250 µm sized aperture. In addition, a Perkin-Elmer Spotlight-400 FTIR spectrometer at the University of Manchester was used to map samples using an adjoining Focal Plane Array (FPA) mapping unit with a resolution of 6.25 µm × 6.25 µm.
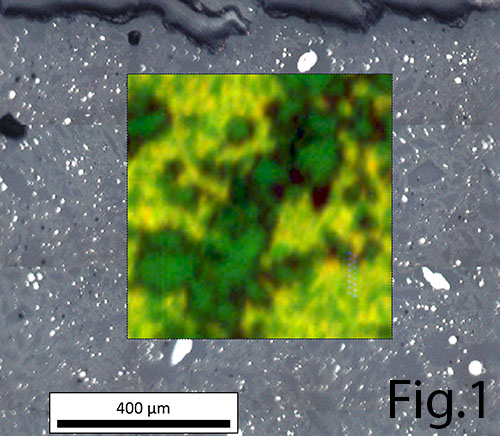
Results: Figure 1 gives an example of an area mapped using micro-FTIR. Sample 131_1 is based on the MESSENGER derived composition of the Mercurian High Magnesium Regions (HMg) [9]. Spectra in Fig.2 are of the Mg-poor (5.2 wt%) glassy component in this sample. Compared with spectra of glasses based on the Inter Crater Planes (ICP) (21.5 wt% MgO), 123_3 (17.7 wt% MgO) and 126_3 (12.2 wt% MgO), we see generally spectra typical for glassy materials. The single Reststrahlenband (RB) shifts with increasing MgO from 9.3 µm to 9.9 µm, and the CF from 7.9 µm to 8.2 µm.

The two examples for bulk powders (Fig.3) have low MgO contents: 1.6 wt% (Low Mg C) and 4.7 wt % (Low Mg B) [9]. Different grain size fractions show intensity correlated with increasing grain size (Fig. 3). The RB and CF features are basically similar for all size fractions, but an characteristical Transparency Feature (TF) appears in the finest fraction (0-25 µm). The Low Mg B sample has the TF at 11.7 µm, the CF at 7.8 µm and the RB at 9.4 µm. Low-Mg C shows the CF from 7.6 µm to 7.7 µm, the RB at 9.2 µm – 9.3 µm and a TF at 11.6 µm.

Summary & Conclusions: The sieved size fractions of the bulk glass material show typical features for highly crystalline materials. They follow a trend of band shifts for CF and RB towards longer wavelengths with increasing MgO contents [3,4]. We will present further glasses cover higher MgO contents (>6 wt%) to provide material for the whole range of expected Mercurian regolith glass compositions [7-9].
However, for a complete picture of the hermean surface, we expect mixtures of glassy and crystalline material. This will be the next step in our study, where we will obtain spectra of mixtures representing various regions on Mercury [e.g.7,8]. Furthermore, the impact of space weathering, which changes the structural and thus spectroscopic properties of grain surfaces will be taken into account [12,13,14].
References: [1] Rothery D.A. et al. (2020) Space Space Rev. 216, 66 [2] Hiesinger H. et al. (2020) in prep. [3] Morlok et al. (2020) Icarus 335, 113410 [4] Morlok et al. (2019) Icarus 324, 86-103 [5] Weber et al. (2020) Earth and Planetary Science Letters 530, 115884 [6] Weider S.Z. et al. (2015) Earth and Planetary Science Letters 416, 109-120 [7] Namur and Charlier (2017) Nature Geoscience 10, 9-15 [8] Namur O. et al. (2016) Earth and Planetary Science Letters 448, 102-114 [9] Namur O. et al. (2016) Earth and Planetary Science Letters 439, 117-128 [10] Fasset C.I. (2016) Journal of Geophysical Research: Planets 121, 1900-1926 [11] Renggli C. and King P. (2018) Rev.Min.Geochem 84, 229-255 [12] Weber I. et al. (2020) Earth & Planetary Science Letters 530, 115884 [13] Stojic et al. (2020) Icarus (submitted) [14] Stojic et al. (2020) LPSC 51, 1875
How to cite: Morlok, A., Charlier, B., Renggli, C., Klemme, S., Namur, O., Sohn, M., Martin, D., Weber, I., Stojic, A. N., Joy, K. H., Wogelius, R., Carli, C., Reitze, M. P., Bauch, K. E., Hiesinger, H., and Helbert, J.: Mid-Infrared Reflectance Spectroscopy of Analogs for the BepiColombo Mission, Europlanet Science Congress 2020, online, 21 Sep–9 Oct 2020, EPSC2020-327, https://doi.org/10.5194/epsc2020-327, 2020.
Introduction: ESA/JAXA’s BepiColombo mission was launched to Mercury on October 20, 2018. MERTIS (Mercury Radiometer and Thermal Imaging Spectrometer) onboard BepiColombo will be the first thermal infrared (TIR) hyperspectral imager (7–14μm) and radiometer (7–40μm) to orbit Mercury mapping global spectral emissivity and surface temperature of Mercury at a spatial resolution of ~500 m/pixel and ~2 km/pixel respectively [1]. This spectral region is especially sensitive to the abundance of Si-O, unlike the visible-near infrared (VNIR) spectral region which is sensitive to the presence of transition metals such as Fe and Ti in the crystal structure. Due to Fe2+-poor nature of the Mercury surface, MASCS spectrometer onboard MESSENGER which mapped Mercury in the VNIR spectral region (0.3-1.45μm) could not reveal the planet’s silicate mineralogy.
MERTIS will therefore provide spatially resolved surface mineralogy of Mercury including its hollows and pyroclastic deposits along with the rock abundance, grain size, thermal inertia, and surface temperature [2]. In this study, we built a specialized spectral library of 10 silicate analogues and emissivity spectral behavior as a function of temperature (100°C-500°C) under vacuum. Furthermore, the spectral parameters have been derived to understand their change in emissivity spectral behavior under Mercury daytime surface conditions to effectively characterize them in MERTIS data.
Sample selection and preparation: Over a decade, the Planetary Spectroscopy Laboratory (PSL) at DLR, Berlin has been undertaking huge efforts in collecting natural silicate endmembers from various sources in preparation to MERTIS data science [4]. These silicates are suggested by ground-based observations of Mercury and indirect mineralogy derived from NASA MESSENGER geochemistry suite [e.g.,3,5].
The studied silicates include; a) olivine: forsterite (Mg1.76Fe0.22SiO4), b) pyroxenes: enstatite ((Ca0.01Mg1.73Fe0.25)Si2O6), diopside ((Ca1Mg0.9Fe0.1)Si2O6), c) plagioclase feldspar: hypersthene ((Mg0.7Fe0.2 Ca0.1)2Si2O6), anorthite (An95.5Ab4.5), labradorite (An51.2Ab46.5Or2.3), andesine (An47.4Ab50Or2.6), oligoclase (An19.3Ab76Or4.7), d) K-feldspar: orthoclase (An0.5Ab31.9Or67.6), and d) feldspathoid: nepheline (Na3K0.7(Al3.8Si4O16)). The samples composition were characterized by electron microprobe analysis (EMPA).
Facility and Methods: A Bruker Vertex 80V instrument with MCT HgCdTe detector (cooled by liquid nitrogen) and KBr beamsplitter is used at PSL to measure the TIR emission spectra. This spectrometer is attached to an external chamber where the samples are placed in steel cups which are heated up to Mercury’s peak daytime temperatures via induction technique under vacuum. Each sample is heated from 100°C to 500°C (step 100°C) at medium vacuum (0.7hPa) and then cooled down in vacuum. Radiance from the heated samples is collected by a gold (Au) coated 90° off-axis parabolic mirror and reflected into the spectrometer which records the TIR spectra of the silicates at wavelength intervals of 7-14μm at spectral resolution of 4cm-1.
These spectra are then calibrated against blackbody spectrum at the same geometry and temperature as the samples. Fig. 1 shows the resulting emissivity measurements at temperatures of 100°C, 200°C, 300°C, 400°C, and 500°C.
Results: Christiansen feature (CF) and Reststrahlen bands (RBs) in the TIR spectra are widely used for remote identification and characterization of silicates. CF is emissivity maximum which is used as the indicative of silica polymerization where the CF position shifts to shorter wavelengths for highly polymerized silicates [6,7]. However, some silicates have overlapping CF positions which makes it difficult for their unique identification. RBs relate to fundamental vibration bonds due to stretching and bending of Si-O and various cations. Therefore, RB positions are used to identify the nature of the minerals such as olivines, pyroxenes, and feldspars [e.g.,8,9,10].
In order to remotely characterize these silicate groups, we introduce CF vs RB1 plot where CF position (emissivity maxima) is plotted against RB1 position (Fig. 2). RB1 position is the first RB minimum longward of CF position occurs for all temperatures as marked in Fig. 1.
CF vs RB1 plot shows that CF position of plagioclase feldspars (Group A) and forsterite (olivine) is least affected with increase in temperature; however, the RB1 position increases to longer wavelengths with increase in temperature. On the other hand, pyroxene group and nepheline show that with increase in temperature CF position shifts shortwards and RB1 position only slightly shifts longward. The significant result from the CF vs RB1 plot is that the olivine, pyroxenes (and nepheline) (Group B) and plagioclase (Group A) classes of silicates can be unambiguously identified when comparing both spectral parameters instead of one (CF position).
CF vs RB1 plot will therefore enable first-hand surface mineral identification of Mercury in MERTIS and ground-based telescope observations of Mercury in the TIR spectral region.
Conclusions: The new emissivity measurements in this study will directly support MERTIS data analysis. CF vs RB1 plot introduced in this study can be widely used for detection of surface mineralogy of planets studied in the TIR spectral region.
References: [1] Hiesinger, H. and J. Helbert (2010) PSS,58(1-2): pp.144-165. [2] Helbert J. et al. (2013) SPIE, 8867, 886705. [3] Vander Kaaden, K et al. (2017) Icarus, 285,155-168. [4] Helbert J. et al (2007) Adv.Space.Res., 40, 272-279. [5] Namur and Charlier (2017) Nat. Geosci., 10,9-13. [6] Conel J.E. (1969) JGR, 1896-1977,74,1614-1634. [7] Logan L.M. et al. (1973) JGR, 1896-1977,78, 4983-5003. [8] Donaldson Hanna K.L. et al. (2012) JGR Planets, 117. [9] Hamilton V. (2000) JGR Planets, 105, 9701-9716. [10] Lyon R.J.P (1965) Econ. Geol. 60, 715-736.
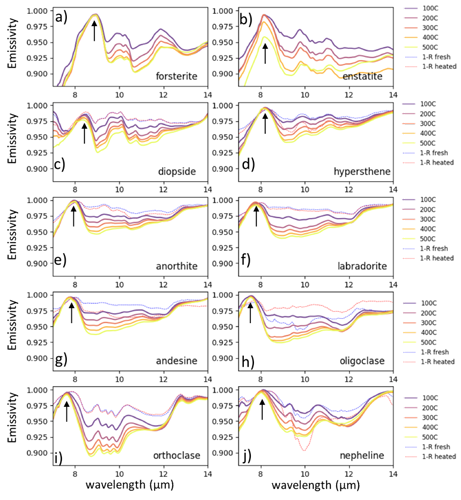
Figure 1. (a-j) Emissivity spectra (solid lines) of silicates as a function of temperature studied. Black arrow marks the position of CF position for all silicates. Dotted spectra indicate the 1-R fresh (blue-dotted) and heated (red-dotted) spectra is the inverted reflectance spectra of the fresh and thermally weathered silicates at room temperature under vacuum measured at phase angle of 26°.
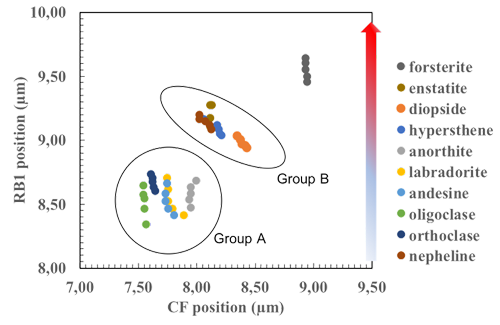
Figure 2. CF vs RB1 plot which shows that forsterite (olivine), pyroxenes including nepheline (silica undersaturated group belonging to feldspathoid), and plagioclase feldspars are grouped under separate classes. RB1 position shifts longwards for all silicates with increase in temperature. The increase in temperature and is denoted by blue-red color scale indicating the low (100°C) to high (500°C) temperature measurements respectively.
How to cite: Varatharajan, I., Stangarone, C., Wilke, F. D. H., Maturilli, A., Helbert, J., and Hiesinger, H.: Emissivity Spectroscopy (7-14 μm) of Powdered Silicates under Simulated Mercury Daytime Surface Conditions: Supporting MERTIS Payload onboard ESA/JAXA Bepicolombo Mission, Europlanet Science Congress 2020, online, 21 Sep–9 Oct 2020, EPSC2020-631, https://doi.org/10.5194/epsc2020-631, 2020.
Abstract. We analyze spectrophotometric observations of Mercury acquired from the Mercury Dual Imaging System (MDIS) on board NASA’s MErcury Surface, Space Environment, Geochemistry and Ranging mission’s spacecraft (MESSENGER). The spectrophotometric properties provide insight into regolith composition and structure, which in turn provide insight into surface processing. Using the Lommel-Seeliger reflection coefficient, we derive first estimates for the single-scattering phase function and the disk-integrated phase curve in eight colors. The results help us prepare for the interpretation of the Mercury observations by the ESA/JAXA BepiColombo mission.
1. Introduction
Planet Mercury continues to challenge scientific interpretation. Mercury’s principal rotational characteristics were unveiled only in 1960’s and its surface composition remains largely open. The elemental chemistry instruments on board the MESSENGER spacecraft provided constraints on many elements [1-6], however the surface mineral composition remains a mystery [7]. Mercury will soon be scrutinized by the BepiColombo mission that will examine the surface over a broader range of wavelengths, promising to identify the mineral composition.
Spectrophotometry provides constraints on the physical and chemical properties of the regolith (e.g., [8]). We analyze MDIS eight-color disk-resolved photometry with the Lommel-Seeliger reflection coefficient (LS), the simplest model valid for regoliths with dark constituent materials. The LS coefficient has been recently utilized in, e.g., asteroid lightcurve inversion using disk-integrated photometry from the ESA Gaia mission [9]. The Gaia photometry unveils asteroid phase curve slopes in the phase-angle range of 15-35o. Examination of the Mercury photometry using the LS coefficient allows for the determination of the single-scattering phase function over MDIS’ wavelength range, paving the way for the assessment of BepiColombo Mercury data [10,11].
2. Modeling, results, and discussion
We make use of the LS reflection coefficient with the single-scattering phase function as in [9]. The disk-integrated phase function is introduced as part of the single-scattering phase function using a divisor that corresponds to the disk-integrated phase function for isotropic scattering. It follows that the data points themselves suggest the shape of the phase functions.
Figure 1 shows the single-scattering phase functions as point clouds when reduced from the full MDIS data set (e.g., [8]). The filter wavelengths are as follows (in nm): λ(F)=433.2, λ(C)=479.9, λ(D)=558.9, λ(E)=628.8, λ(G)=748.7, λ(L)=828.4, λ(J)=898.8, λ(I)=996.2. In order to minimize surface roughness effects, we have required that the incidence angle is less than 40o.

Figure 1: Single-scattering phase functions as indicated by the processed data points.
In Figure 2, we show the disk-integrated phase curves. The phase curves look realistic for phase angles <60o, whereas, for phase angles >60o, there is a bump that can be due to the simplicity of the LS coefficient.

Figure 2: Disk-integrated phase curve as indicated by the processed data points.
Figure 3 shows linear magnitude-scale fits to the data, with normalization to zero magnitude at 30o phase angle, when both incidence and emergence angles are required to be less than 40o. Color dependence is evident and there are indications of reddening as a function of phase angle. Although exceptions are present, the slopes tend to become shallower with increasing wavelength, in agreement with the increasing reflectance of Mercury with wavelength [12].

Figure 3: Linear fits to the single-scattering phase function data for incidence and emergence angles <40o.
3. Conclusion
We have carried out a preliminary analysis of the MESSENGER observations. By concentrating on data at small incidence and emergence angles, we obtain realistic first estimates for the single-scattering phase function. This, in turn, allows us to estimate the disk-integrated phase curve of Mercury. We detect reddening with the phase angle and flattening with increasing spectral reflectance. The features relate to the properties of regolith particles. We will continue the analysis by accounting for surface roughness and porosity (e.g., [13]) and recent advances in space weathering modeling [14,15].
Acknowledgments. Research by KM, VB, and AP supported, in part, by the Academy of Finland (grant 325805). DD is supported by NASA's Solar System Working program (grant 80NSSC18K0521).
References
[1] Nittler, L. R., et al.: The major-element composition of Mercury’s surface from MESSENGER X-ray spectrometry, Science, Vol. 333, pp. 1847–1850, 2011.
[2] Peplowski, P. N., et al.: Enhanced sodium abundance in Mercury's north polar region revealed by the MESSENGER Gamma-Ray Spectrometer, Icarus, Vol. 228, pp. 86-95, 2014.
[3] Peplowski, P. N., et al.: Radioactive elements on Mercury’s surface from MESSENGER: Implications for the planet’s formation and evolution, Science, Vol. 333, pp. 1850–1852, 2011.
[4] Peplowski, P. N., et al.: Variations in the abundances of potassium and thorium on the surface of Mercury: Results from the MESSENGER Gamma-Ray Spectrometer, J. Geophys. Res., Vol. 117, E00L04, 2012.
[5] Weider, S. Z., et al.: Chemical heterogeneity on Mercury’s surface revealed by the MESSENGER X-Ray Spectrometer, J. Geophys. Res., Vol. 117, E00L05, 2012.
[6] Evans, L. G., et al.: Major-element abundances on the surface of Mercury: Results from the MESSENGER Gamma-Ray Spectrometer, J. Geophys. Res., Vol. 117, E00L07, 2012.
[7] Izenberg, N. R., et al.: The low-iron, reduced surface of Mercury as seen in spectral reflectance by MESSENGER, Icarus, Vol 228, pp. 364–374, 2014.
[8] Domingue, D. L., et al.: Application of multiple photometric models to disk-resolved measurements of Mercury’s surface: Insights into Mercury’s regolith characteristics, Icarus, Vol. 268, pp. 172-203, 2016.
[9] Muinonen, K., et al.: Asteroid lightcurve inversion with Bayesian inference, Astronomy & Astrophysics, in revision, 18 p., 2020.
[10] Cremonese, G., et al.: SIMBIO-SYS: Scientific cameas and spectrometer for the BepiColombo mission, Vol. 216, 75, pp. 1-78, 2020.
[11] Rothery, D., et al.: Rationale for BepiColombo studies of Mercury’s surface and composition, Space Science Reviews, Vol. 216, 66, pp. 1-46, 2020.
[12] McClintock, W. E., et al.: Spectroscopic observations of Mercury’s surface reflectance during MESSENGER’s first Mercury flyby, Science, Vol. 321, pp. 62-65, 2008.
[13] Wilkman, O., et al.: Photometry of dark atmosphereless planetary bodies: an efficient numerical model, Planetary and Space Science, Vol. 118, pp. 250-255, 2015.
[14] Penttilä, A., et al.: Rigorous light-scattering simulations of space-weathering effects on reflectance spectra. Icarus, Vol. 345, 113727, pp. 1-8, 2019.
[15] Muinonen, K., et al.: Scattering and absorption of light in planetary regoliths. J. Visual. Exper., Vol 149, e59607, doi:10.3791/59607, 2019.
How to cite: Muinonen, K., Domingue, D. L., Björn, V., and Penttilä, A.: Mercury phase functions from MESSENGER/MDIS spectrophotometry: First results, Europlanet Science Congress 2020, online, 21 Sep–9 Oct 2020, EPSC2020-704, https://doi.org/10.5194/epsc2020-704, 2020.
Of all the terrestrial planets in the Solar System Mercury stands out with a remarkably high core-mantle ratio, with its core occupying about 85% of the planetary radius. Several different theories tried to explain its high Fe/Si-ratio; the giant impact theory (e.g. [1]) for instance argues that one or more giant impacts stripped away most of the Hermean mantle, while the core remained and formed the smallest of the terrestrial planets. Another theory explains the high density of Mercury through a partial volatilization during the time of the solar nebula (e.g. [2]). Here, proto-Mercury is assumed to be substantially more massive than at present-day with a composition close to those of the other terrestrial planets. When the planet was surrounded by the hot solar nebula, however, most of the mantle evaporated, ending up with present-day Mercury. Other theories argue with the particular primordial conditions of its orbital location that might have favored the accretion of dense and volatile poor building-blocks such as enstatite chondrites (e.g. [3,4]). Messenger, however, revealed a surface composition that is surprisingly rich in volatile and moderately volatile elements [4]. This is hardly compatible with the giant impact and vaporization theory but supports hypothesis that connect Mercury’s high core-mantle ratio to the particular conditions of its orbital location.
Within this talk, we will for the first time present a new model that connects these conditions with accretion and partial planetary evaporation. We will argue that Mercury (in contrast to old evaporation theories) was released out of the nebula as a small planetary embryo, comparable in size to the moon, that was covered with a global magma ocean. While the embryo proceeds to grow through frequent impactors, (moderately) volatile elements evaporate from the magma ocean and are lost into space due to the high surface temperature, the low gravity of the body and the high XUV flux from the young Sun. Here, lighter and more volatile elements are preferentially lost from the embryo, while the heavier and less volatile elements escape less efficient. Due to the continuous growth of proto-Mercury, however, the gravitational energy will start to dominate over the thermal energy of the evaporated particles, making them harder and harder to escape, which ultimately halts the loss of moderately volatile elements. Mercury subsequently finalizes its accretion with relatively volatile rich material and evolves to the body we can observe at present-day. We simulated the escape of (moderately) volatile elements with an adopted version of a 1D hydrodynamic upper atmosphere model (e.g. [5]) and will present our results here for the first time.
References: [1] Benz, W. et al., Space Sciences Series of ISSI, Volume 26, p. 7., 2008. [2] Cameron, A.G.W., Icarus, Volume 64, Issue 2, p. 285-294., 1985. [3] Charlier, B. and Namur, O., Elements, Volume 15, p. 9-14, 2019. [4] Nittler, Larry R. et al., Science, Volume 333, Issue 6051, pp. 1847, 2011. []5 Erkaev, et al., MNRAS, Volume 460, Issue 2, p.1300-1309, 2016.
How to cite: Scherf, M., Erkaev, N., and Lammer, H.: A new theory on Mercury's origin, Europlanet Science Congress 2020, online, 21 Sep–9 Oct 2020, EPSC2020-194, https://doi.org/10.5194/epsc2020-194, 2020.
BepiColombo was launched on 20 October 2018 the BepiColombo from the European spaceport in French Guyana and is now on route to Mercury to unveil Mercury’s secrets. BepiColombo with its state of the art and very comprehensive payload will perform measurements to increase our knowledge on the fundamental questions about Mercury’s evolution, composition, interior, magnetosphere, and exosphere. BepiColombo is a joint project between the European Space Agency (ESA) and the Japanese Aerospace Exploration Agency (JAXA) and consists of two orbiters, the Mercury Planetary Orbiter (MPO) and the Mercury Magnetospheric Orbiter (Mio).
The BepiColombo spacecraft is during its 7-year long journey to the innermost terrestrial planet in a so-called ‘stacked’ configuration: The Mio and the MPO are connected to each other, and stacked on-top of the Mercury Transfer Module (MTM). Only in late 2025, the ‘stack’ configuration is abandoned and the individual elements spacecraft are brought in to their final Mercury orbit: 480x1500km for MPO, and 590x11640km for Mio. The foreseen orbits of the MPO and Mio will allow close encounters of the two spacecraft throughout the mission. The mission has been named in honor of Giuseppe (Bepi) Colombo (1920–1984), who was a brilliant Italian mathematician, who made many significant contributions to planetary research and celestial mechanics.
On its way BepiColombo has several opportunities for scientific observations - during the cruise into the inner solar system and during nine flybys (one at Earth, two at Venus and six at Mercury). However, since the spacecraft is in a stacked configuration during the flybys only some of the instruments on both spacecraft will perform scientific observations. In April 2020 BepiColombo has passed Earth. The next planetary flyby will be on 15th October 2020 at Venus.
A status of the mission and instruments and a summary of first results from measurements taken during the Earth flyby and during the first two years in cruise will be given.
How to cite: Benkhoff, J., Murakami, G., and Zender, J.: BepiColombo – Status and first Results from Activities during Cruise , Europlanet Science Congress 2020, online, 21 Sep–9 Oct 2020, EPSC2020-8, https://doi.org/10.5194/epsc2020-8, 2020.
Introduction: The MErcury Radiometer and Thermal Infrared Spectrometer (MERTIS) is an instrument to study the mineralogy and temperature distribution of Mercury’s surface in unprecedented detail [1]. During the nominal mission, MERTIS will map the whole surface at 500 m scale, combining a push-broom IR grating spectrometer (TIS) with a radiometer (TIR) sharing the same optics, instrument electronics, and in-flight calibration components for the whole wavelength range of 7-14µm (TIS) and 7-40µm (TIR) [1]. MERTIS successfully completed its planned tests of the Near-Earth Commissioning Phase (NECP) in November 2018 and several checkouts, collecting thousands of measurements of its internal calibration bodies and deep space. Those data show a performance comparable with ground-based measurements. Scientific data will arrive well before the 2025 arrival at Mercury. MERTIS observed the Moon on in April 2020 producing ~12k TIS observation with ~3k measurements of the Moon at various angles. Even if the Moon is 7000 farther away and half maximum temperature than Mercury during nominal operation, the signal is clearly visible and shows the excellent MERTIS TIS sensor. MERTIS archival data are stored in Planetary Data System v4 format (PDS4) [2] format, that actually describe 2 physical formats for each MERTIS channel. Each channel will be stored in Flexible Image Transport System (FITS) [3] and in pure ASCII.
The Mission and the Instrument: BepiColombo [2] is a dual spacecraft mission to Mercury that has been launched in October 2018 and is jointly carried out by the European Space Agency (ESA) and the Japanese Aerospace Exploration Agency (JAXA). The spacecraft comprises two separate orbiters: the Mercury Planetary Orbiter (MPO), focused on observations of the surface and internal composition, and the Mercury Magnetospheric Orbiter (MMO), which will study the particle science in the extreme thermal environment. In addition to a suite of instruments complementary to the NASA MESSENGER mission, BepiColombo will be able to observe both the northern and southern hemispheres at high spatial resolution. BepiColombo uses an innovative solar electric propulsion system and its trajectory toward Mercury is a combination of low-thrust arcs and flybys at Earth, Venus, and Mercury. This will allow us to reach Mercury with low relative velocity. The spacecraft was successfully launched on the 20th of October 2018, 01:45 UTC, from the ESA Guiana Space Centre using an Ariane 5 rocket and will reach its mappings orbit at Mercury in 2026. The MERTIS instrument was proposed in 2003 as payload of the Mercury Planetary Orbiter spacecraft of the ESA-JAXA BepiColombo mission and the final Flight Model (FM) was delivered in 2013. MERTIS is an innovative and compact spectrometer, that combines a push-broom IR grating spectrometer (TIS) with a radiometer (TIR) with only 3kg of mass and an average 10 W power consumption [1,4]. TIS operates between 7 and 14 μm and will record the day-side emissivity spectra from Mercury, whereas TIR is going to measure the surface temperature at the day- and night side in the spectral range from 7-40 μm corresponding to temperatures from 80- 700 K. TIR is implemented by an in-plane separation arrangement, while TIS is an imaging spectrometer with an uncooled micro-bolometer array. The optical design of MERTIS combines a three-mirror anastigmatic lens (TMA) with a modified Offner grating spectrometer. A pointing device allows viewing the planet (through the planet-baffle), deep space (through the space-baffle), and two internal black bodies at 300 K and 700 K temperature, respectively. MERTIS was developed at DLR in collaboration with the Westfälische Wilhel-Universität Münster and industry partners. The MPO operational plan foreseen a 2.3 hour low eccentricity orbit that allows MERTIS to achieve its 500 meters global mapping scientific goal. As confirmed by the NASA MESSENGER mission, due to the iron-poor nature of the surface the thermal infrared is the most useful wavelength range to study Mercury’s surface composition. Silicates as well as sulfides have characteristic spectral features in this range that MERTIS can map with high signal-to-noise ratio. The MERTIS spectrometer aims to capture data on the mineralogy whereas the radiometer surveys the thermal inertia of the planet.
Flyby Results: MERTIS nominal nadir viewing port (Planet View) is obstructed by the MTM (Mercury Transfer Module) during the whole cruise to Mercury, while the Space View port is unobstructed and normally used for calibration purpose. We trick MERTIS nominal observation cycle (Internal reference Blackbodies, Space, multiple Space) to acquire only from the Space port. We collect ~12k TIS observation, with more than 3000 spectra from the Moon. The acquisition campaign was split in 8 “observation”, that describe different modes of the instrument. During the Flyby the only TIS sensor binning was change to test different acquisition modes. A typical observation crossing the Moon is in Fig.1. The spectra radiance values are sharply decaying towards the Moon edges. The Moon is a much colder target than Mercury (around 400K max vs. 700K) and is it farther than the planned target distance during the nominal mission at Mercury (700.000 km vs ~1000 km ). The signal from the Moon is nevertheless clearly discernible from the background. The PI Team at DLR and Münster University is currently testing the calibration procedures and geometrical registration and on the verge to deliver the first calibrated data acquired in space to the CoI team. The final data format is still to be defined, but the data container will be the same as in the RAW level data [6] available on ESA PSA website[7].
References: [1] Hiesinger, H. and Helbert, J., Planet. Space Sci. 58, (2010). [2] NASA Planetary Data System, pds.nasa.gov [3] FITS Support Office, fits.gsfc.nasa.gov [4] Instrument User Manual (FM), MER-DLR-MA-001 (2017). [5] Python PDS4 Tools, SBN sbndev.astro.umd.edu/wiki [6] D’Amore et al, LPSC 2020, 2020LPI....51.1438D [7] European Space Agency's Planetary Science Archive (PSA) archives.esac.esa.int/psa

Fig.1 left: Calibrated spectra radiance in W/(m² µm sr). right: Same spectra as in the first panel, as produced from TIS sensor (y is spatial direction , x is reversed spectral direction).
How to cite: D'Amore, M., Helbert, J., Maturilli, A., Knollenberg, J., Berlin, R., Peter, G., Säuberlich, T., and Hiesinger, H.: The Mercury Radiometer and Thermal Infrared imaging Spectrometer (mertis) onboard Bepi Colombo: 2020 Moon flybys data results., Europlanet Science Congress 2020, online, 21 Sep–9 Oct 2020, EPSC2020-240, https://doi.org/10.5194/epsc2020-240, 2020.
Introduction: In its investigations of the planet Mercury, NASA’s MESSENGER returned an immense amount of data detailing the dynamic surface of our solar system’s innermost planet. As the European and Japanese space agencies prepared for the launch of BepiColombo, the next mission to explore Mercury, BepiColombo’s project science team asked NASA to produce a new portal within the Solar System Treks suite (https://trek.nasa.gov) featuring data returned by MESSENGER from Mercury. This new portal would be used both for mission planning and for public outreach by the BepiColombo mission. While initially populated with Messenger data, the portal is also being designed to facilitate visualization, analysis, and dissemination of data from BepiColombo after it commences science operations in orbit around Mercury. The initial release of the Mercury Trek in 2019 shortly followed the launch of BepiColombo on its journey to Mercury.
The Mercury Trek Portal: The initial release of Mercury Trek in July 2019 featured data products from the Mercury Dual Imaging System (MDIS) instrument that operated aboard NASA’s MErcury Surface, Space ENvironment, GEochemistry and Ranging (MESSENGER) mission while in orbit around Mercury from 2011 to 2015. These products include the MDIS Global Mosaic, MDIS BDR Global Mosaic, MDIS Color Global Mosaic, MDIS MD3 Color Global Mosaic, MDIS Enhanced Color Global Mosaic, MDIS LOI (low-incidence angle) Global Mosaic, MDIS Global Digital Elevation Model (DEM), and MDIS Color Hillshade Global map derived from the DEM. An updated release in June 2020 featured enhanced search capabilities, an updated user interface, the option to have user interface control labels in either English or Japanese, and the addition of numerous new data products. These include high resolution MDIS mosaics, DEMs, and slope data for selected regions, and gravimetric maps including crustal thickness, gravity anomaly, gravity degree strength, and gravity disturbance. Also included are 1:5M geologic maps for the Beethoven, Discovery, Kuiper, Michaelangelo, Shakespeare, Tolstoj, and Victoria regions.
Mercury Trek’s data visualization capabilities make it easy to stack and blend different data layers in order to optimize depictions of a wide variety of surface features. Data products can be viewed in equatorial, or polar projected views, or on an interactive 3D globe. The Trek interface allows the user to maneuver a first-person visualization of “flying” across the surface of the Mercury.
Analysis tools make it easy to measure distances (either straight-line or along a user-defined path) and to create elevation profiles for surface features. Users can draw user-defined bounding boxes across Vesta’s terrain to generate STL or OBJ files for 3D printing. They can also draw a freehand path anywhere across the surface and have Vesta Trek return a QR code that can be scanned into a smartphone (Android or iOS). The smartphone can then be placed into a pair of inexpensive cardboard-compatible goggles. The user will then be able to fly their defined path in virtual reality.
We intend to continue working with the BepiColombo mission and the greater planetary science community to enhance the new Mercury Trek portal with additional data products, and solicit suggestions from the community.
One Component in an Integrated Suite: Mercury Trek is one of a growing number of portals in NASA’s Solar System Treks Project, available at https://trek.nasa.gov. NASA's Solar System Trek online portals for lunar and planetary mapping and modeling provide web-based suites of interactive data visualization and analysis tools to enable mission planners, planetary scientists, students, and the general public to access mapped data products from past and current missions for Mercury, the Moon, Mars, Vesta, Ceres, Titan, seven of Saturn’s smaller icy moons (Dione, Enceladus, Iapetus Mimas, Phoebe, Rhea, and Tethys), Ryugu, and Bennu. As web-based toolsets, the portals do not require users to purchase or install any software beyond current web browsers. These portals are being used for site selection and analysis by NASA and a number of its international partners, supporting upcoming missions.
Acknowledgements: The authors would like to thank the Planetary Science Division of NASA’s Science Mission Directorate, the Science Engagement and Partnerships Division of NASA’s Science Mission Directorate, and the Advanced Explorations Systems Program of NASA’s Human Exploration and Operations Mission Directorate for their support and guidance in the development of the Solar System Treks.
How to cite: Day, B. and Law, E. and the Solar System Treks Development Team: Data Visualization and Analysis with NASA's Mercury Trek Online Portal, Europlanet Science Congress 2020, online, 21 Sep–9 Oct 2020, EPSC2020-162, https://doi.org/10.5194/epsc2020-162, 2020.
Please decide on your access
Please use the buttons below to download the presentation materials or to visit the external website where the presentation is linked. Regarding the external link, please note that Copernicus Meetings cannot accept any liability for the content and the website you will visit.
Forward to presentation link
You are going to open an external link to the presentation as indicated by the authors. Copernicus Meetings cannot accept any liability for the content and the website you will visit.
We are sorry, but presentations are only available for users who registered for the conference. Thank you.