SB9
Session assets
Please decide on your access
Please use the buttons below to download the presentation materials or to visit the external website where the presentation is linked. Regarding the external link, please note that Copernicus Meetings cannot accept any liability for the content and the website you will visit.
Forward to presentation link
You are going to open an external link to the presentation as indicated by the authors. Copernicus Meetings cannot accept any liability for the content and the website you will visit.
We are sorry, but presentations are only available for users who registered for the conference. Thank you.
Oral and Poster presentations and abstracts
The problem of the delivery of water to the terrestrial planets was studied by several scientists (see references e.g. in [1]). Below I present the results of migration of planetesimals under the gravitational influence of 7 planets (from Venus to Neptune). In each variant of the calculations, the initial values of semi-major axes of orbits of 250 planetesimals varied from amin to amin+da with da=0.1 AU, their initial eccentricities equaled to eo, and the initial inclinations equaled to eo/2 rad. amin varied from 3 to 4.9 AU with a step of 0.1 AU, eo=0.02 or eo=0.15. The calculations of the probability pE of a collision of a planetesimal with the Earth were made similar to those in [1-3]. In [1-3], it was concluded that the total mass of water delivered to the Earth from outside Jupiter’s orbit could be about the mass of Earth’s oceans for the total mass of planetesimals beyond that orbit about 200 Earth’s masses.
In Figs. 1-2 the values of 106pE are presented for several calculations at amin from 3 to 4.9 AU, eo=0.02 or eo=0.15, and for time interval T equal to 1, 10, 100, 200, 500, and 1000 Myr. Results of calculations with T>1000 Myr (up to 5000 Myr) are presented as “end” runs in the figures. Similar plots were presented in [4] for calculations at amin from 5 to 40 AU and da=2.5 AU.
For some values of amin and eo, the values of pE calculated for 250 planetesimals can differ by a factor up to several hundreds for different calculations with almost the same initial orbits. This difference can be caused by that one of thousands of planetesimals could move in an Earth-crossing orbit for millions of years. Such difference was also noted earlier in [2-3] for initially Jupiter-crossing objects. The mean time of motion of a former Jupiter-crossing object in Earth-crossing orbit was about 30 Kyr.
For some calculations at amin from 3 to 3.8 AU, there was a considerable growth of pE after 10 Myr. At T=100 Myr and 3≤amin≤4.9 AU, the values of pE vary from values less than 10-6 to values of the order of 10-3 (and of 0.01 at T=1000 Myr), but they are often between 10-6 and 10-5, as for many our previous calculations with amin≥5 AU. There were more runs with pE>2×10⁻⁵ for 3.2≤amin≤3.3 AU, amin=3.5 AU and 3.7≤amin≤4.1 AU than for other values of amin, including the values of amin≥5 AU. The delivery of water and volatiles from such distances from the Sun was more effective (up to hundreds of times for some initial data) than from other distances. It is not clear how much material was at distances from 3 to 4 AU from the Sun, compared to that in the zone of the giant planets. If we suppose that the density of a protoplanetary disk is proportional to R-0.5, then the ratio of the mass of material with a distance R from the Sun between 4 and 15 AU is greater by a factor of 209/7≈30 than that with R between 3 and 4 AU. For such a model, the amount of material delivered to the Earth from the outer asteroid belt can be comparable with the amount of material delivered from the zone of Jupiter and Saturn.
For T=100 Myr, at 3.0≤amin≤3.6 AU or amin=4.2 AU and eo=0.02, and also at 3.0≤amin≤3.1 AU and eo=0.15, more than a half of planetesimals were left in elliptical orbits. At amin=4.2 AU planetesimals were close to the Hilda family asteroids. Planetesimals that originally crossed the orbit of Jupiter may have come to the Earth's orbit mostly within the first million years. Most of collisions with the Earth of bodies, originally located at a distance of 4 to 5 AU from the Sun, occurred during the first 10 million years. The times elapsed before the collisions of some bodies from the Uranus and Neptune zones with the Earth could exceed 20 million years. For 3≤amin≤3.5 AU and eo≤0.15, individual bodies could fall onto the Earth and the Moon in a few billion years. For example, pE=4×10⁻⁵ for amin=3.3 AU, eo=0.02 at 0.5≤t≤0.8 Myr (the time of the late-heavy bombardment) and pE=6×10⁻⁶ at 2≤t≤2.5 Myr. For amin=3.2 AU and eo=0.15, pE=0.015 at 0.5≤t≤1 Myr, and pE=6×10⁻⁴ at 1≤t≤2 Myr. The zone of the outer asteroid belt can be one of the sources of the late heavy bombardment.
The ratio of the number of bodies colliding with the Earth to that with the Moon varied mainly from 20 to 40 for planetesimals from the feeding zone of the terrestrial planets [5]. For bodies arriving from distances from the Sun greater than 3 AU, this ratio was mainly in the interval from 16.4 to 17.4. So more planetesimals per mass of a celestial body collided with the Moon than with the Earth. However, at collisions of planetesimals with the Moon the fraction of ejected material was greater than that for the Earth.
The characteristic velocities of collisions with the Moon and the Earth of bodies in calculations with amin from 3 to 15 AU were mainly from 20 to 23 km/s and from 23 to 26 km/s, respectively. The characteristic velocities of collisions of planetesimals from the feeding zone of the terrestrial planets with the Moon varied from 8 to 16 km/s depending on initial semi-major axes and eccentricities of planetesimals.
Studies of collisions of bodies with the Earth were carried out within the framework of the state assignment of the GEOKHI RAS No. 0137-2021-0004. Studies of collisions of bodies with the Moon were carried out with the support of the Russian Science Foundation grant No. 21-17-00120, https://rscf.ru/project/21-17-00120/.
[1] Marov M.Ya., Ipatov S.I. Solar System Research, 2018, 52, 392-400. https://arxiv.org/ftp/arxiv/papers/2003/2003.09982.pdf
[2] Ipatov S.I., Mather J.C. Annals of the NYAS, 2004, 1017, 46-65. http://arXiv.org/format/astro-ph/0308448
[3] Ipatov S.I., Mather J.C. Advances in Space Research, 2004, 33, 1524-1533. http://arXiv.org/format/astro-ph/0212177
[4] Ipatov S.I. EPSC2020-71, 2020. https://meetingorganizer.copernicus.org/EPSC2020/EPSC2020-71.html.
[5] Ipatov S.I. Solar System Research, 2019, 53, 332-361. http://arxiv.org/abs/2003.11301
How to cite: Ipatov, S.: Migration of planetesimals to the Earth and the Moon from the region of the outer asteroid belt, Europlanet Science Congress 2021, online, 13–24 Sep 2021, EPSC2021-100, https://doi.org/10.5194/epsc2021-100, 2021.
We present a semianalytical model that describes the resonance strength, width in au, location and stability of fixed points, and periods of small-amplitude librations [1]. The model is valid for any two gravitationally interacting massive bodies, and is thus applicable to planets around single or binary stars with arbitrary eccentricities and inclinations. The model assumes some simplifications that limit its validity in some specific cases, mainly for first order resonances at very small eccentricities. In spite of these simplifications the model shows as very helpful to understand the properties of the planetary resonances and its potential is revealed at high eccentricities and/or high inclinations. In particular, it is very simple to generate atlas of resonances for a given planetary system, that means, the domains of the resonances in the plane (a,e) or (a,i). In Fig. 1 we show an example for the system HD31527, where the atlas calculated with the model predicts that the two outher planets are in the resonance 16/3. When one of the bodies has negligible mass, the model reproduces the results of the restricted, asteroidal, case [2]. In this talk we also show how to apply the model and the use of the codes which are available at http://www.fisica.edu.uy/~gallardo/atlas/plares.html.
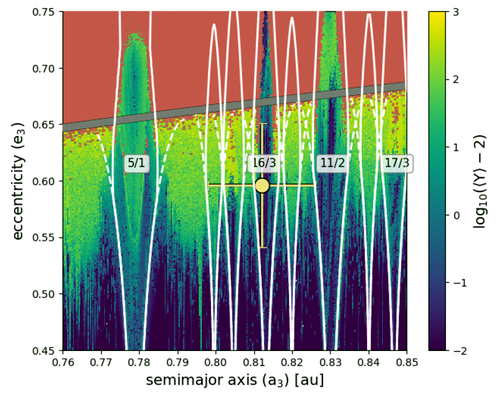
Fig. 1. Atlas of resonances (white lines) near the outher planet of the system HD31527 and corresponding MEGNO map of the region (colored background). Dark blue corresponds to more regular orbits, and lighter tones of green indicate increasingly chaotic motion. The location of the outer planet is shown with a filled yellow circle. The libration widths of the most relevant MMRs determined with the model are plotted as white lines showing that the outher planet is well placed inside the resonance 16/3 with the middle planet [1].
References
[1] Gallardo, T. et al. “Semianalytical model for planetary resonances: Application to planets around single and binary stars", Astronomy and Astrophysics, 646, A148 (2021).
[2] Gallardo, T. “Three dimensional structure of mean motion resonances beyond Neptune", CMDA 132:9 (2020).
How to cite: Gallardo, T., Beauge, C., and Giuppone, C.: Semianalytical model for planetary resonances, Europlanet Science Congress 2021, online, 13–24 Sep 2021, EPSC2021-147, https://doi.org/10.5194/epsc2021-147, 2021.
1. Introduction
We are interested in systems where two phases coexist: a solid phase with a high effective viscosity, and a low-viscosity liquid phase which fills the porosity of the solid phase. Two-phase systems, or "mush", are common in planetary sciences: magma extraction, Earth's inner core, icy moons... On terrestrial or icy bodies, such biphasic layers can compact under their own weight, which leads to the extraction of the liquid phase from the solid phase, and compaction of this solid phase. We present here a new model of two-phase flows with phase change (melting or freezing), and focus on 2 applications:
-
Earth's inner core compaction: Whether the inner core crystallises dendritically or by sedimentation, it is likely that some liquid iron is trapped within the inner core, which may explain its low rigidity [1]. We extend here the studies of Sumita et al., 1996 [2] and Lasbleis et al., 2019 [3] by taking into account phase change within the inner core.
-
Transneptunian objects (TNOs): Ices may contain antifreezes like ammonia or methanol which could depress the melting point by up to 155 K [4]. Due to their presence, the melting temperature depends on their concentration. Then it is very likely that there would not be any clear border between solid and liquid if the melting point was reached, but rather a mushy layer. Several authors have studied the thermal evolution of TNOs without these considerations (for instance [5], [6], [7]).
2. Two-phase flow model
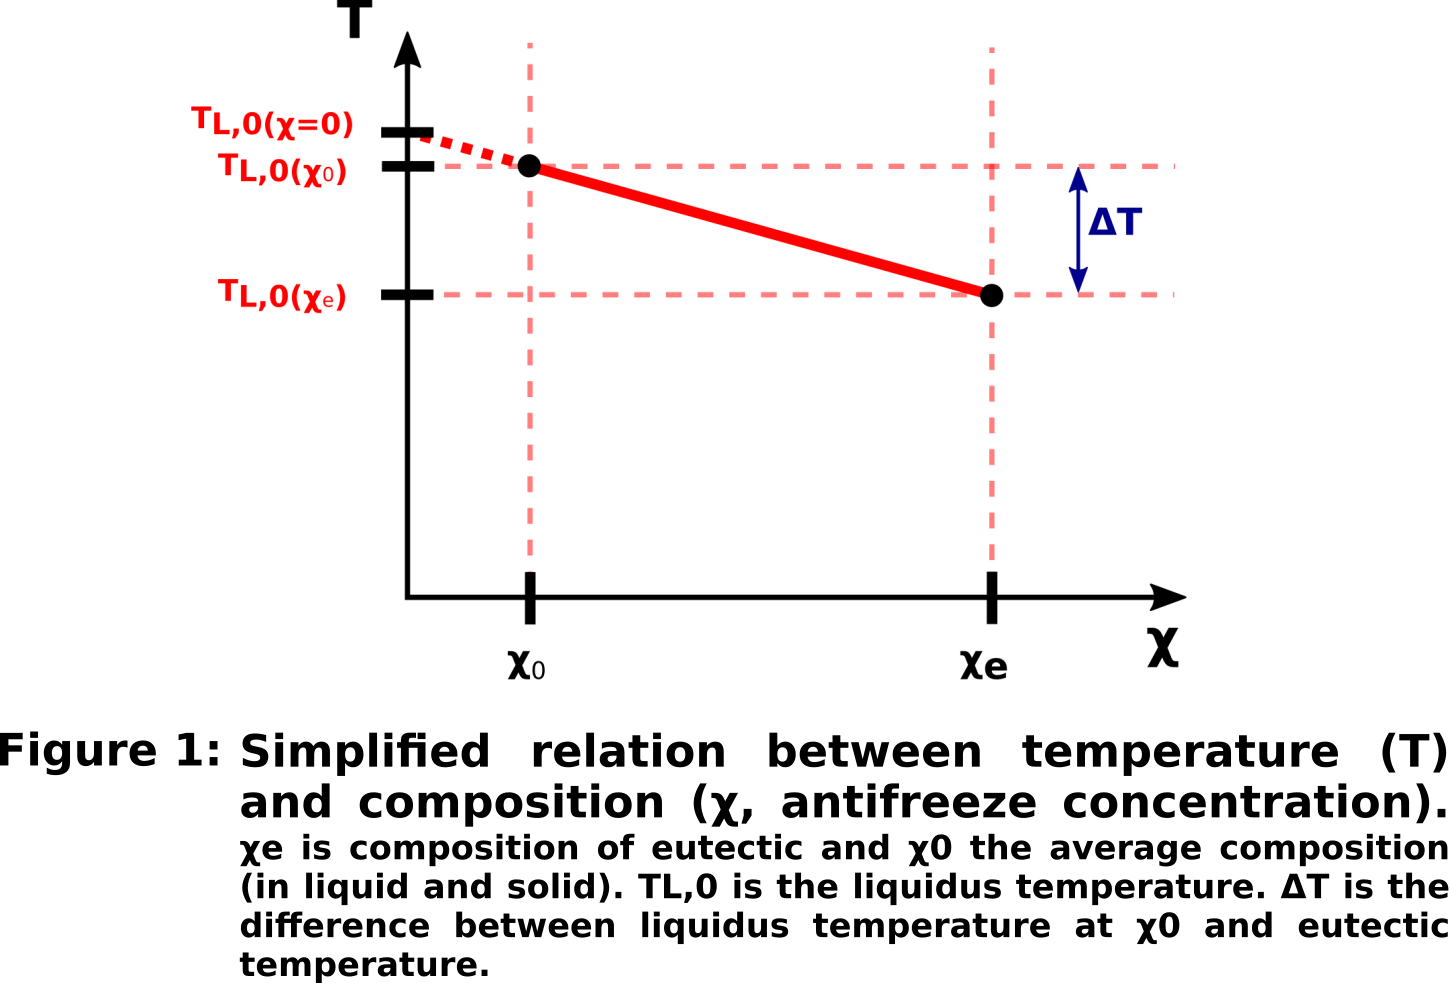
The model is based on the two-phase formalism developed by Bercovici et al., 2001 [8] for a non-reacting two-phase medium, which we generalise to allow for non-congruent phase change. This requires solving equations of conservation of mass and momentum for each phases, energy, and solute, with appropriate boundary conditions. In our model, the solid and liquid phases are assumed to be in thermodynamic equilibrium, which allows to link temperature and composition through the phase diagram. To simplify the problem, the liquidus temperature is taken to be linear (Fig. 1), which implies that the temperature in the two-phase region is a linear function of solute concentration. We further assume that the solute is considered to be totally contained in the melt (solid/liquid partition coefficient equal to 0). The set of equations is written in 1D spherical geometry. These assumptions allow us to reduce the system of equations to a system of only three equations (conservation of momentum, energy, and solute), which we solve to obtain the temperature (directly connected to composition), radial velocity of liquid (linked to velocity of solid) and porosity (the proportion of liquid).
The code solves equations in a 1D sphere, which size can evolve with time, either due to accretion (TNOs during their formation), or solidification (inner core). This is taken into account thanks to an adaptive grid. The code has been developed from the code written by Lasbleis et al., 2019 [3].
3. Preliminary results
Application to Earth's inner core
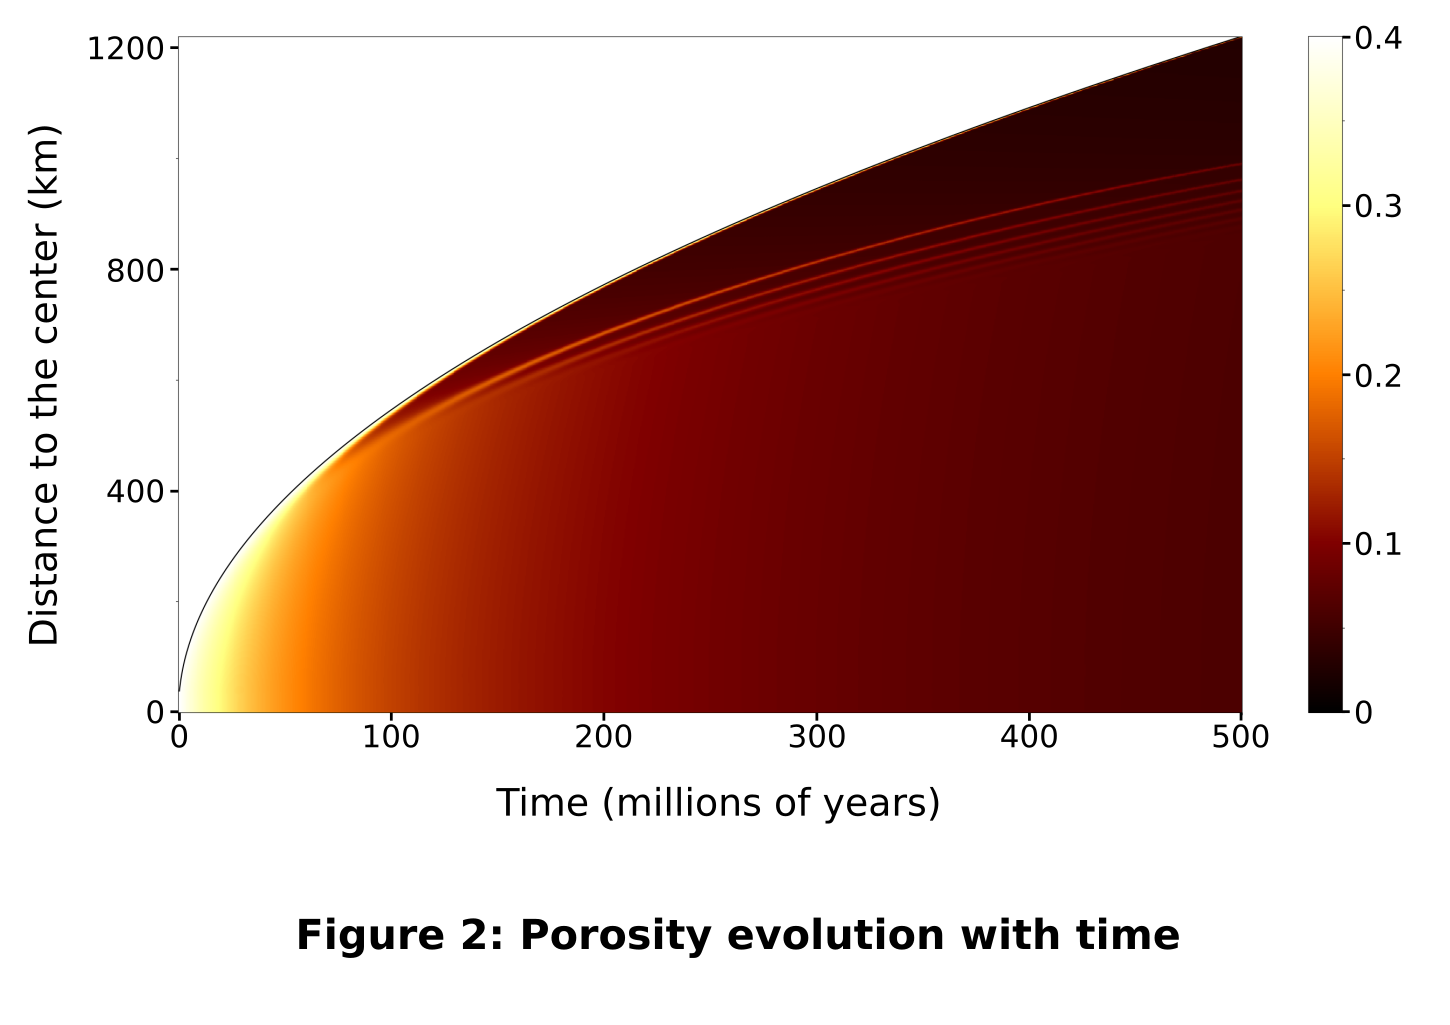
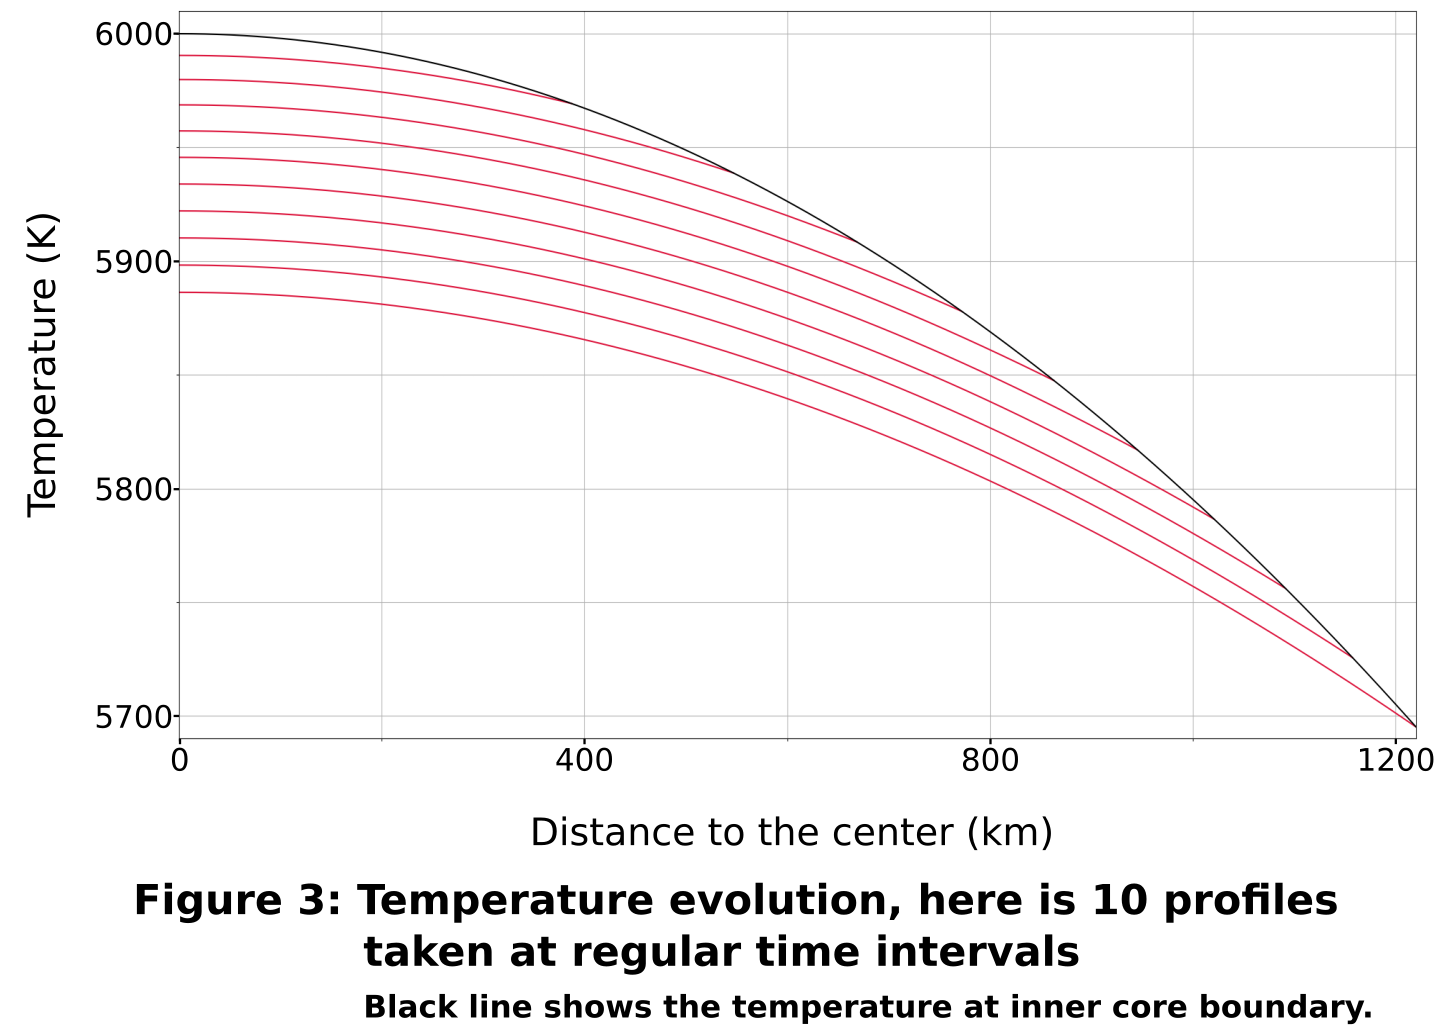
In the inner core, 'light elements', and in particular oxygen, act as antifreezes [9]. Within the inner core, the effect of pressure on the liquidus temperature cannot be neglected, and we thus take this factor into account in the model. The temperature-composition relation thus depends on pressure, or radius; the slope of the liquidus with respect to solute concentration is take to be constant but TL decreases with decreasing pressure and increasing radius. At the inner core boundary, the temperature is set to TL(χ0, r). Fig. 2 and Fig. 3 show the evolution of porosity and temperature in the inner core as functions of time and radius.
Application to TNOs
When modeling the thermal evolution and differentiation of TNOs, our code has to be associated with an external icy diffusive spherical shell. If in addition we consider the formation of a rocky core, the mush (modeled by our code) is a spherical shell around a spherical rocky core. Our model takes into account the variations with temperature of ice thermal conductivity and heat capacity, which are far better known than for iron Earth's inner conditions [10] [11]. However, the pressure effect on TL is negligible.
Acknowledgements
This project has received funding from the European Research Council (ERC) under the European Unions Horizon 2020 research and innovation programme (grant agreements 802699 and 716429).
References
[1] Deguen, R. (2012). Earth and Planetary Science Letters, 333, 211-225.
[2] Sumita, I., Yoshida, S., Kumazawa, M., & Hamano, Y. (1996). Geophysical Journal International, 124(2), 502-524.
[3] Lasbleis, M., Kervazo, M., & Choblet, G. (2020). Geophysical Research Letters, 47(2), e2019GL085654.
[4] McKinnon, W. B., Prialnik, D., Stern, S. A., & Coradini, A. (2008). The solar system beyond Neptune, 1, 213-241.
[5] Bierson, C. J., Nimmo, F., & McKinnon, W. B. (2018). Icarus, 309, 207-219.
[6] Desch, S. J., & Neveu, M. (2017). Icarus, 287, 175-186.
[7] Malamud, U., & Prialnik, D. (2015). Icarus, 246, 21-36.
[8] Bercovici, D., Ricard, Y., & Schubert, G. (2001). Journal of Geophysical Research: Solid Earth, 106(B5), 8887-8906.
[9] Alfè, D., Gillan, M. J., & Price, G. D. (2002). Earth and Planetary Science Letters, 195(1-2), 91-98.
[10] Klinger, J. (1980). Science, 209(4453), 271-272.
[11] McCord, T. B., & Sotin, C. (2005). Journal of Geophysical Research: Planets, 110(E5).
How to cite: Métayer, R., Deguen, R., Guilbert-Lepoutre, A., Lasbleis, M., and Wong, J.: Modeling of a two-phase system with phase change, applications in planetology: Earth's inner core and Transneptunian objects, Europlanet Science Congress 2021, online, 13–24 Sep 2021, EPSC2021-519, https://doi.org/10.5194/epsc2021-519, 2021.
Contemporary missions to comets allow reconstruction of the nucleus shape in a very high resolution. The real surface of cometary nucleus has complex topography and morphology which results in highly nonuniform gas emission even on a small spatial scale. Numerical simulation from the real surface considering all details is either impossible or excessively computationally expensive. In practice, the real surface is substituted by some ``effective" shape model suitable for numerical simulations but with less number of surface facets (i.e. with less resolution). Each of the surface facets, constituting the shape model separately is assumed to be homogeneous and having the averaged properties of the real surface, which it covers. The correctness of such representation (degradation) of the real surface was studied previously in [1] for the case of active spots on an inactive surface. The present study considers the active spots on the less active background surface.
In the present work we consider a pedagogic case – a spherical surface with surface gas production formed by (1) the gas emission qi from a set of closely located (with interval L) spots (see Fig.1) with sizes li much smaller than the radius of the sphere Rn, and (2) the gas emission qb from the surface outside the spots (i.e. the background).
Conventionally the flow from an inhomogeneous surface can be divided into two regions: (1) a mixing region; and (2) a uniform flow. The flow in the mixing region is multidimensional i.e. with variation of parameters not only along the radial direction. The uniform flow is a result of viscous dissipation of the flow in the mixing region and it is one dimensional with variation of parameters along the radial direction only (as it would be in the case for the expansion from a homogeneous sphere). We study the structure of the flow in the mixing region for different combinations of li, L, qi, qb and define parameters of the resulting uniform flow. Due to a large number of spots it is possible with sufficient precision to restrict the computational domain as shown in Fig.2.
In the present study the postulated production rates and relative activity of the background are 1021<qi <1.5·1022 [m-2s-1] and 0.01<qb/qi<0.3 respectively. A specific model of gas production is not critical in this study since it serves only to determine realistic values of qi and qb.
Results of the simulation show that for the production rates qi under consideration have the flow rarefaction in the vicinity to the spots corresponds to KnL=0.03-0.0002. The flow in the vicinity of the surface has complex spatial structure -- it contains multiple shocks leading to the non-monotonous and periodic variation of flow parameters (see example in Fig.3). The dispersion of the flow parameters in cross-sections perpendicular to the radial direction is evaluated to define the distance when the flow from an inhomogeneous surface can be considered homogeneous.
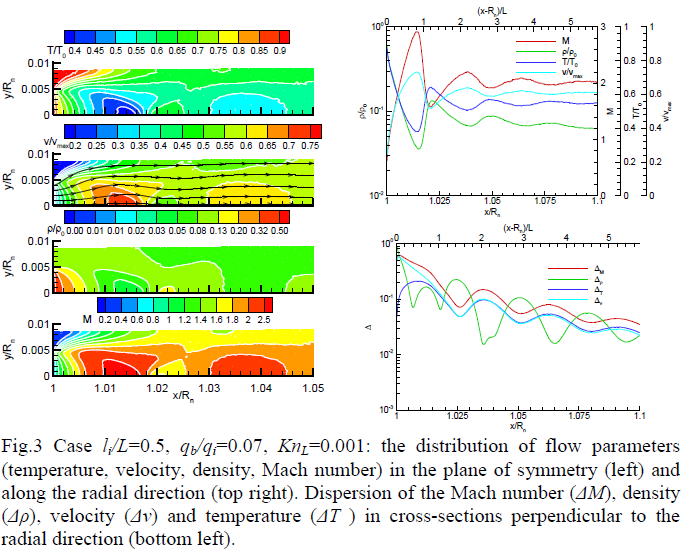
In comparison with previously studied cases with a completely inactive background (see [1]), the presence of the background gas production prevents free expansion of the flow from the spot and decreases the rarefaction of the flow.
Conclusions:
Introducing the background gas production does not change significantly the scales and conditions when the flow from an inhomogeneous surface becomes effectively homogeneous found for the case with an inactive background.
The altitude above the surface h, where the flow becomes practically uniform (dispersion <5%), is between 1 and 10·L (depending on the rarefaction). This puts a limit on the spatial resolution of the effective surface.
The flows from inhomogeneous and homogeneous surfaces with the same surface temperature and total gas production rates are not equivalent (i.e. parameters of the resulting uniform flow are not the same as parameters in the flow from homogeneous surface at the same distance). This non-equivalence is more pronounced for the less rarefied flows.
For the substitution of the flow from an inhomogeneous surface by the flow from effective surface we provide the position of the sonic surface and the distribution of parameters on it for a broad range of conditions.
In the mixing region, the gas flux from active spots accelerates very fast to the velocities significantly higher than in the flow from a homogeneous surface. In the range of the background relative activity 0.01<qb/qi<0.3 the flow has a strong lateral component of the velocity in the vicinity to the surface. This has an important impact on the dust velocity (radial and transverse), systematically larger than usually computed, due to a ``kick’’ (i.e. intensive acceleration on a short scale) in the mixing region.
Acknowledgments
This research was supported by the Italian Space Agency (ASI) within the ASI-INAF agreements I/032/05/0, I/024/12/0 and 2020-4-HH.0.
References
Zakharov, V., Bykov, N., Rodionov, A., Ivanovski, S., Della Corte, V., Rotundi, A., Fulle, M., Marschall, R., Mixing region over a surface of cometary nucleus with small-scale inhomogeneities, EPSC Abstracts Vol., EPSC2020-219, 2020
How to cite: Zakharov, V., Bykov, N., Rodionov, A., Ivanovski, S., Della Corte, V., Rotundi, A., Fulle, M., and Marschall, R.: Mixing region over a surface of cometary nucleus with small-scale inhomogeneities. II Active spots on a less active background surface., Europlanet Science Congress 2021, online, 13–24 Sep 2021, EPSC2021-403, https://doi.org/10.5194/epsc2021-403, 2021.
The first stages of solids aggregation in the proto–solar nebula start with hit–and–stick collisions of sub–micrometer sized grains which form porous fractal aggregates with low fractal mass dimension Df < 2. Subsequent stages lead to aggregates compaction in non–fractal structures and to the appearance of the so–called bouncing barrier, increasing the impact energy between solid particles and the degree of decoupling with the surrounding gas (Blum & Wurm 2008). The outcome of dynamical simulations points to the concentration of solid material through streaming instability of the gas as the major agent followed by gravitational collapse to overcome the bouncing barrier (Goodman & Pindor 2000). Nevertheless, some of the primitive formed fractals, characterized by fractal dimension slightly lower than 2, survived the subsequent planetesimal formation and were recently found in comet 67P/Churyumov–Gerasimenko after their release from the nucleus due to cometary activity (Mannel et al. 2016; Fulle & Blum 2017).
The dynamics of fractal solids and their interaction with a surrounding gaseous medium is therefore of major interest in studying the first phases of solid aggregation in the solar system and the nature of the pristine material released by comets in space.
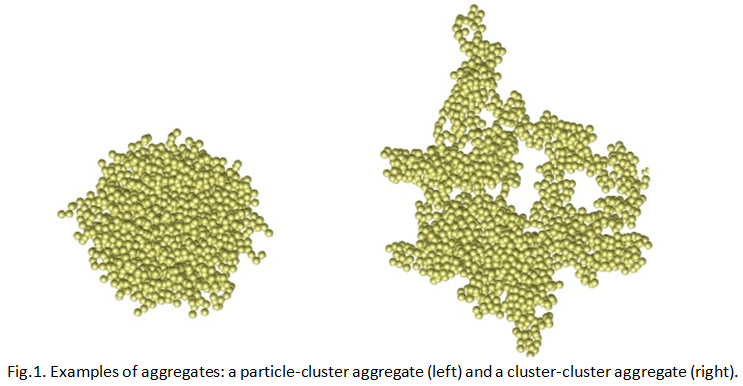
In the present work we study fractal clusters of monodisperse spherical monomers having two different morphologies, one extremely compact and one extremely loose. They are produced through statistical aggregation methods called particle-cluster aggregation and cluster-cluster aggregation, respectively. In the particle-cluster aggregation method a monomer, represented by a single spherical object, is used as a projectile and shot towards the center of mass of a cluster made by identical monomers (the target), sticking with it at the first contact point. No restructuring of the aggregate after the collision is taken into account. The target is therefore growing in mass at every hit and the final result is a porous object characterized by a compact overall shape. In the cluster-cluster aggregation identical cluster of monomers are colliding along a line connecting the two centers of mass, sticking at the contact point without restructuring. The final result is a porous object with a fluffy open appearance. The two processes are iterated until the desired mass is reached. The porosity and fractal mass dimension of the two kinds of aggregates increase with the number of constituent monomers and reach asymptotic values for large aggregates. Cluster-cluster aggregates (CCAs) and particle-cluster aggregates (PCAs) are characterized by porosity p~97% and p~75%, and fractal mass dimension Df~2.0 and Df~3.0 respectively, in the limit of large aggregates (Bertini et al. 2009). PCAs and CCAs resemble morphologically the classical ballistic particle-cluster aggregates (BPCAs) and ballistic cluster-cluster aggregates (BCCAs) used in dust studies in astrophysical environments (Mukai et al. 1992), respectively. Examples of the PCA and CCA structures are shown in Fig.1 with a number of monomers N = 2048, corresponding to the largest size used in our study.
Due to a probabilistic nature of the fractal aggregate model, the generated fractal objects are not identical (even constructed with the same number of monomers). We derive statistics on the geometrical (e.g. cross-sections) and dynamical properties (e.g. moments of inertia) of the fractal objects.
Assuming the dust particles are submitted in a gas flow of a simplified model of a cometary coma (Ivanovski et al. 2017), we derive asymptotic mean and dispersion in the translational and rotational motion of dust.
References:
Bertini, I., Gutierrez, P. J., & Sabolo, W. 2009, A&A, 504, 625
Blum, J. & Wurm, G. 2008, ARA&A, 46, 21
Fulle, M. & Blum, J. 2017, MNRAS, 469, S39
Goodman, J. & Pindor, B. 2000, Icarus, 148, 537
Ivanovski, S.L., Zakharov, V.V., Della Corte, V., Crifo, J-F., Rotundi, A., Fulle, M. 2017, Icarus 282, 333-350
Mannel, T., Bentley, M. S., Schmied, R., et al. 2016, MNRAS, 462, S304
Mukai, T., Ishimoto, H., Kozasa, T., Blum, J., & Greenberg, J. M. 1992, A&A, 262, 315
How to cite: Bertini, I., Zakharov, V., Ivanovski, S., Petropoulou, V., Della Corte, V., and Rotundi, A.: Dynamical properties of a fractal dust, Europlanet Science Congress 2021, online, 13–24 Sep 2021, EPSC2021-633, https://doi.org/10.5194/epsc2021-633, 2021.
Models of the thermal emission of the zodiacal cloud and sporadic meteoroids suggest that the dominant source of interplanetary dust is Jupiter-family comets (JFCs). However, comet sublimation is insufficient to sustain the quantity of dust presently in the inner solar system. It has therefore been suggested that spontaneous disruptions of JFCs may supply the zodiacal cloud.
We present a model for the dust produced in comet fragmentations and its evolution, comparing with the present day zodiacal cloud. Using results from dynamical simulations we follow individual JFCs as they evolve and undergo recurrent splitting events. The dust produced by these events is followed with a kinetic model which takes into account the effects of collisional evolution, Poynting-Robertson drag, and radiation pressure. This allows us to model both the size distribution and radial profile of dust resulting from comet fragmentation. Our model suggests that JFC fragmentations can produce enough dust to sustain the zodiacal cloud. We also discuss the feasibility of comet fragmentation producing the spatial and size distribution of dust seen in the zodiacal cloud.
By modelling individual comets we are also able to explore the variability of cometary input to the zodiacal cloud. Comets are drawn from a size distribution based on the Kuiper belt and fragment randomly. We show that large comets should be scattered into the inner solar system stochastically, leading to large variations in the historical brightness of the zodiacal light.
How to cite: Rigley, J. and Wyatt, M.: Comet fragmentation as a source of the zodiacal cloud, Europlanet Science Congress 2021, online, 13–24 Sep 2021, EPSC2021-574, https://doi.org/10.5194/epsc2021-574, 2021.
Introduction
Recent high-resolution ALMA observations of protoplanetary disks have raised interest in the study of solid bodies in disks at different scales, from sub-micrometric grains up to solid bodies hundreds of meters in size, for which dynamic evolution is governed by the interaction between the gas and the dust in the disk.
We propose a novel research in the field of dust evolution and dynamics in protoplanetary disks. One of the main goals of this research is to address the dust dynamics evolution, the dynamical interaction between proto-planetary bodies, preparing the path for the SKA Key Programmes. We aim at contributing to this field twofold: (i) modeling of non-spherical dust dynamics in rarefied gas field present in the disk gaps and (ii) to interpret and reconstruct protoplanetary disk observations through numerical simulations, extending the PHANTOM code [1] to non-spherical dust setup, i. e. a particular focus is how the dynamics is influenced by dust dimension and shape. One of the main objectives is to reproduce the image of ALMA data and understand how different disk initial dust parameters and dust characteristics may influence the disk evolution and face-on or edge-on appearance.
Using the state-of-the-art non-spherical dust dynamical model [2], developed for analysis of the ESA comet mission ROSETTA data, we determine the region in the gaps where the settling could occur as a function of the grain non-sphericity (shape, elongation), size, density etc. We investigate the terminal velocities and rotational frequencies of the non-spherical particles using different physical particle parameters, to show that the dust accommodation in the ring structures can be at distances different than what predicted by spherical dust models. The second focus of this work is to study the vertical settling with the SPH approach taking into account the dusty-gas interaction through the whole disk including possible planet-formation gaps.
Dust dynamics models
We use two models to simulate dust dynamics in protoplanetary disks: 1) a non-spherical dust dynamical model to simulate dust settling in Epstein regime and 2) the-state-of-the-art SPH code PHANTOM to simulate dust motion in both the Epstein and Stokes regimes.
The first code is a 3D+t non-spherical dust model that solves the Euler dynamical and kinetic equations. Considering free-collisional dust regime we study the effects on the particle dynamics provided with different particle shapes, initial orientation and velocities, as well as torque. Torque is computed from the law of variation of the angular momentum by using the Euler dynamic equations. The particles are assumed to be homogeneous, isothermal convex bodies. The dust motion is governed by the gas drag and gravity of the host star and/or a planet in the gaps.
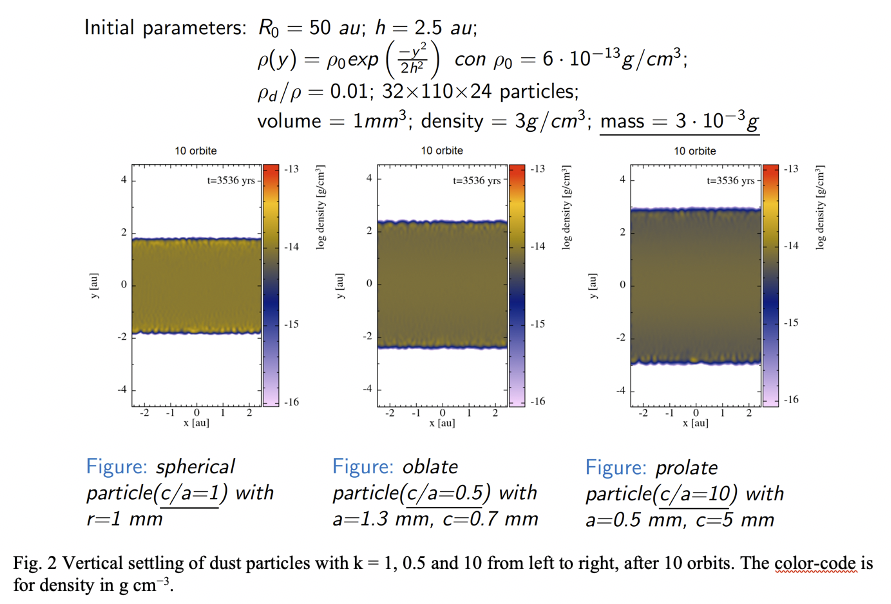
The second model is a modified version of the PHANTOM code. We introduced non-spherical ellipsoidal particles and averaged drag coefficients for those non-spherical shapes. The code is a 3D+t SPH and MHD code and includes modules for self-gravity, dust-gas mixtures, viscosity, photo-evaporation, etc. A description of the parameters set used in these simulations with the results of simulations of dust settling are reported in Fig. 2. The plot is an example of dust settling in dusty disks, each of them having only one of three selected types of particles that are of the same mass and density, but of different shape.
Dust settling with non-spherical particles
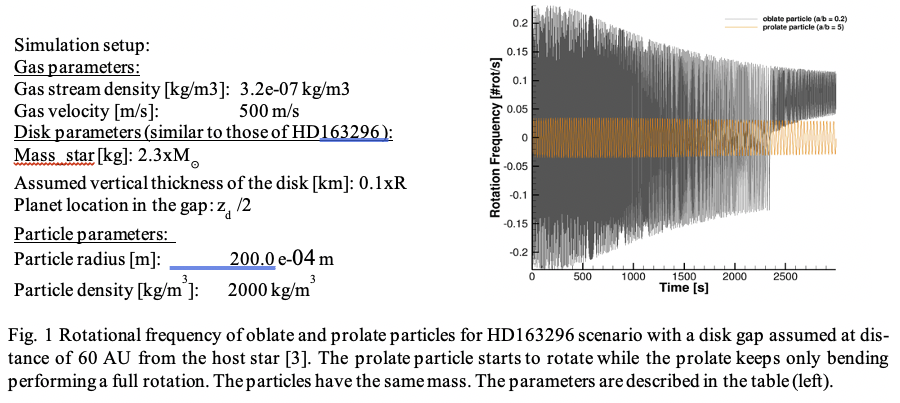
Here we discuss two example cases produced by the two codes. Fig.1 shows rotational frequency (number of rotation per second) of two spheroids of different aspect ratio calculated with our non-spherical dust model in the Epstein regime. We simulate the dynamical properties and evolution of μm to mm sized particles in the case study with a planet in a disk gap at 60 AU, as observed in the HD163296 data [3, 4]. We assess the structure of the hypothesized vertically-extended dust layer. We investigated the influence of different dust sizes and initial dust speeds. Different spheroids of the same mass lead to different dynamics (e.g. velocity, angular velocity, etc) in the vertical settling phenomena.
In the second group of simulations our non-spherical dust setup of the PHANTOM code has been used. By utilizing the pre-calculated averaged drag coefficients of spheroid particles in Epstein regime we simulated dust vertical settling in a disk using the SPH approach. The non-spherical dust particles in Epstein regime settle down slower than their spherical equivalent particles (see Fig 2). Moreover, the settling of larger non-spherical dust particles in Stokes regime shows a stratified structure: a denser sub-disk near the mid-plane for dust in Stokes regime and suspended particles in Epstein regime.
Conclusions and future work
We used two different models to simulate non-spherical dust settling in protoplanetary disks. The first one computes dusty-gas motion in Epstein regime using free molecular expression for rarefied field [1]. The second one uses a newly implemented feature of the state-of-the-art PHANTOM code, namely non-spherical dust shapes. Both models reveal that the interpretation of the ALMA observations can be biased by the spherical particle approximation. In our future work we will describe what we found applying the two dust models with non-spherical particles to study the dust evolution of edge-on disks. Usually the mm-sized particles settling in protoplanetary disks are aggregates of fractals formed from the dusty-gas interactions during the protostellar nebula phase. Such aggregates could be approximated with compact porous particles if dynamical (e.g. drag coefficients) and physical (e.g. porosity, density, fractal dimension) parameters are taken into account.
Acknowledgments
This research was supported by the National Institute for Astrophysics, Italy (INAF) within the Mainstream project “Non-spherical dust dynamics in protoplanetary disks - how realistic dust particle shapes change the dust evolution timescales”.
References
[1] Price D. J. et al. (2018), PASA 35, E031
[2] Ivanovski S. et al. (2017), Icarus 282, p. 333 - 350.
[3] Isella et al. 2016, PRL, 117;
[4] ALMA Partnership et al. 2015, ApJ Lett. 808:L3,10pp;
How to cite: Ivanovski, S. L., Gerosa, F. A., Turrini, D., Capria, M. T., Alcala, J. M., Della Corte, V., Covino, E., Fulle, M., Vladilo, G., Silva, L., and Perna, D.: Modelling Dust Dynamics in Protoplanetary Disks, Europlanet Science Congress 2021, online, 13–24 Sep 2021, EPSC2021-809, https://doi.org/10.5194/epsc2021-809, 2021.
Introduction
The internal structure of asteroids and comets is fundamentally unknown due to difficulties in sounding their interiors. The measurements carried on by space probes and the observations of binary asteroids (optical and radar) have allowed acceptable estimates of the masses of a few asteroids. Estimates of their bulk densities are derived from their size and shape models. Such bulk densities are usually smaller than the values corresponding to typical densities of meteorites with compositions matching spectroscopical observations of the surfaces of those asteroids [1]. The interpretation of such low bulk densities is that part of the volume inside those objects is occupied by voids. Global structures with void space between coherent components qualify as gravitational aggregates (also, “rubble-piles”).
The origin of such bodies is clearly related to former catastrophic or gradual [2] disruption. Moreover, numerical simulations of the collisional evolution of the asteroid belt predict that most of the bodies between some hundreds of meters and about 100 km should be gravitational aggregates [3]. The situation is a little fuzzier in the case of comets.
The study of the interior structure of small bodies is gaining importance in planetary science as it may reveal relevant information about formation processes of both single and binary bodies. Also, in the frame of planetary defence strategy, the knowledge of internal structure of potentially hazardous asteroids turns out to be crucial to plan space missions to deflect them.
The DART (NASA) and Hera (ESA) space missions to binary Near Earth Asteroid (65803) Didymos are planned to check the capability of current technology to achieve such goal. Instrumentation aboard Hera and its cubesats shall reveal the actual structure of the target bodies, expected to be gravitational aggregates of about 780 m and 160 m respectively.
Many researchers have modelled gravitational aggregates in the past as collections of self-gravitating spheres and as components with ellipsoidal [4,5] or polyhedric shapes [6], in an attempt to have realistic description. Nevertheless, more realistic detail is needed if we wish to predict radar measurements by spacecraft and to calibrate specific instrumentation to perform the needed measurements. This problem is one of the tasks of the H2020 NEOMAPP project that is focusing on the internal structure of reference bodies like the Didymos system and Apophis.
Methodology.
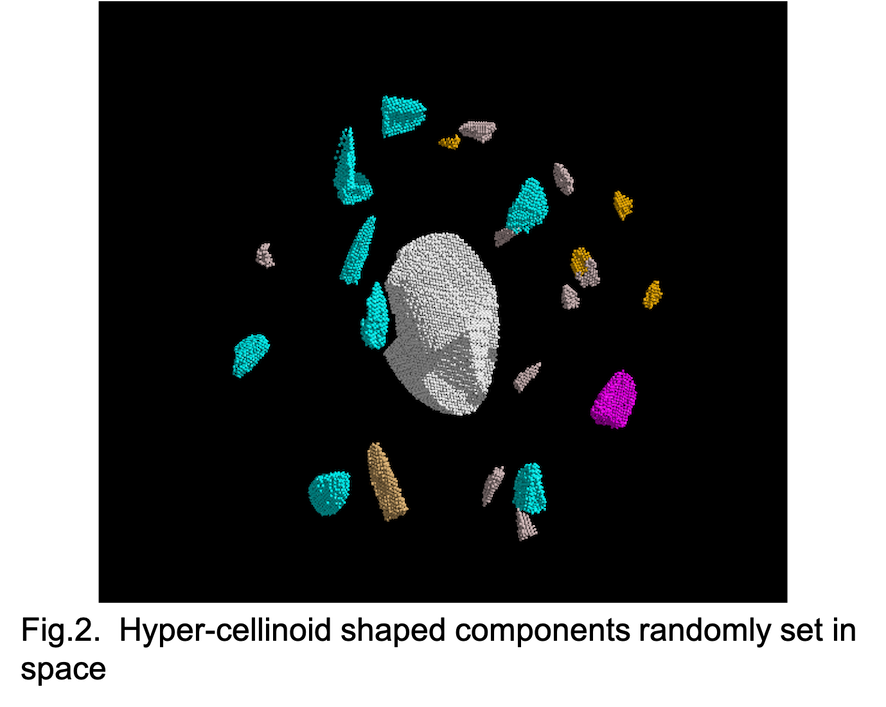
In this work we go one step beyond the ellipsoidal or polyhedric improvement introduced in the last few years to the standard spherical approximation for the shapes of single components of gravitational aggregates. We make arbitrarily complex component shapes in two ways:
(a) By forming rigid solids with concave or convex surfaces utilizing up to 8 different geometrical shapes for each of the faces of irregular octahedra. We introduce increasing level of complexity by extending the concept of (1) super-ellipsoids [7] to (2) cellinoids [8], producing (3) super-cellinoids and to (4) each face of super-cellinoids (hyper-cellinoids).
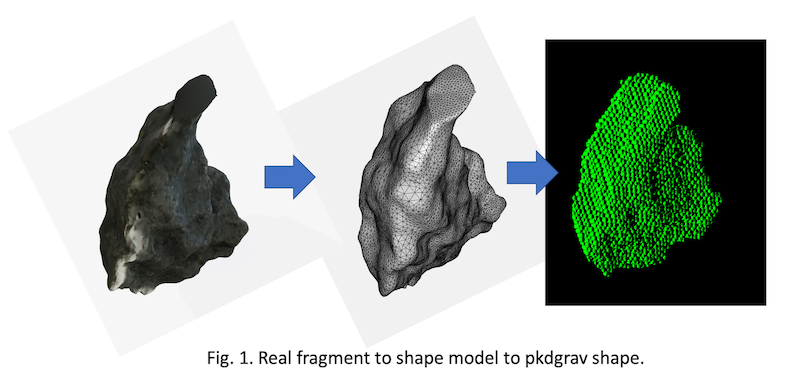
(b) By using real fragments resulting from a set of laboratory shattering experiments performed at NASA-Ames facilities (Mountain Valley, CA, U.S.A.) in July 2013 [9]. We use photogrammetry technique to obtain shape models of tens of such fragments that will be utilized to create synthetic components of each gravitational aggregate.
In any of cases (a) and (b), we use the SSDEM PKDGRAV [10] code to make our aggregate components. (The process is summarized in Fig. 1.) For each randomly selected shape we make a group of spherical particles –the basic element of PKDGRAV- that are clumped together and forced to keep their mutual distance constant so they can be handled and behave like rigid bodies. Each such group has the desired shape with arbitrary resolution. We also draw at random the mass of each component from the experimental mass distributions.
Considering an arbitrary number (hundreds) of such irregular components and different mass spectra, we allow for their self-collapse by mutual gravitational interactions. Stochastic aggregate structures are formed and used as proxy to potential internal structures of real asteroids (e.g. Didymos/Dimorphos and Apophis).
References
[1] Carry, B. (2012) Plan. & Space Sci. 3, 98-118.
[2] Housen, K. (2009) P&SS, 57, 142-152.
[3] Campo Bagatin, A. et al. (2001) Icarus 149, 198-209
[4] Campo Bagatin, A. et al. (2018) Icarus 302, 343-359
[5] Campo Bagatin, A. et al. (2020) Icarus 339, 133603
[6] Ferrari, F. and tanga, P. (2020) Icarus 350, 113871
[7] Delaney, G.W. and Cleary, P.W (2010) EPL 89, 34002
[8] Lu, X. (2014) Earth, Moon & Pl. 112, 73-87
[9] Durda, D.D. et al. (2015) P&SS 107, 77-83
[10] Schwartz, S. et al. (2012) 14, 360-373
How to cite: Campo Bagatin, A., Liu, P.-Y., Parro, L., and Benavidez, P.: Modelling small body gravitational aggregates by components with realistic shapes in the frame of the NEOMAPP project, Europlanet Science Congress 2021, online, 13–24 Sep 2021, EPSC2021-663, https://doi.org/10.5194/epsc2021-663, 2021.
Introduction
Determining the detailed gravitational field of a body is a way to get information about the internal structure of irregular shaped and non-homogenous small solar system objects, like asteroids. In the frame of the H2020 NEO-MAPP project, we are studying a solution to this problem so that suitable instrumentation can be designed onboard spacecraft visiting small bodies. Our reference asteroid is the Near-Earth Asteroid (65803) Didymos binary system, the target of the Hera mission by the European Space Agency [1] to be launched in late 2024.
The method proposed here is an extremely fast way to find the gravitational field in all regions of space about any body with particular attention on Didymos. This has the advantage of calculating -in a reasonable time- the gravitational fields corresponding to a large number of extremely different internal structures. Therefore, on the one hand we will be able to test the suitable resolution needed for accelerometers onboard Hera’s Juventas cubesat [2]. On the other hand, once the Hera spacecraft will be at Didymos, measurements may be compared with a comprehensive library of potential gravitational fields. In that way, we may find what synthetic internal structure best matches spacecraft measurements.
Methodology
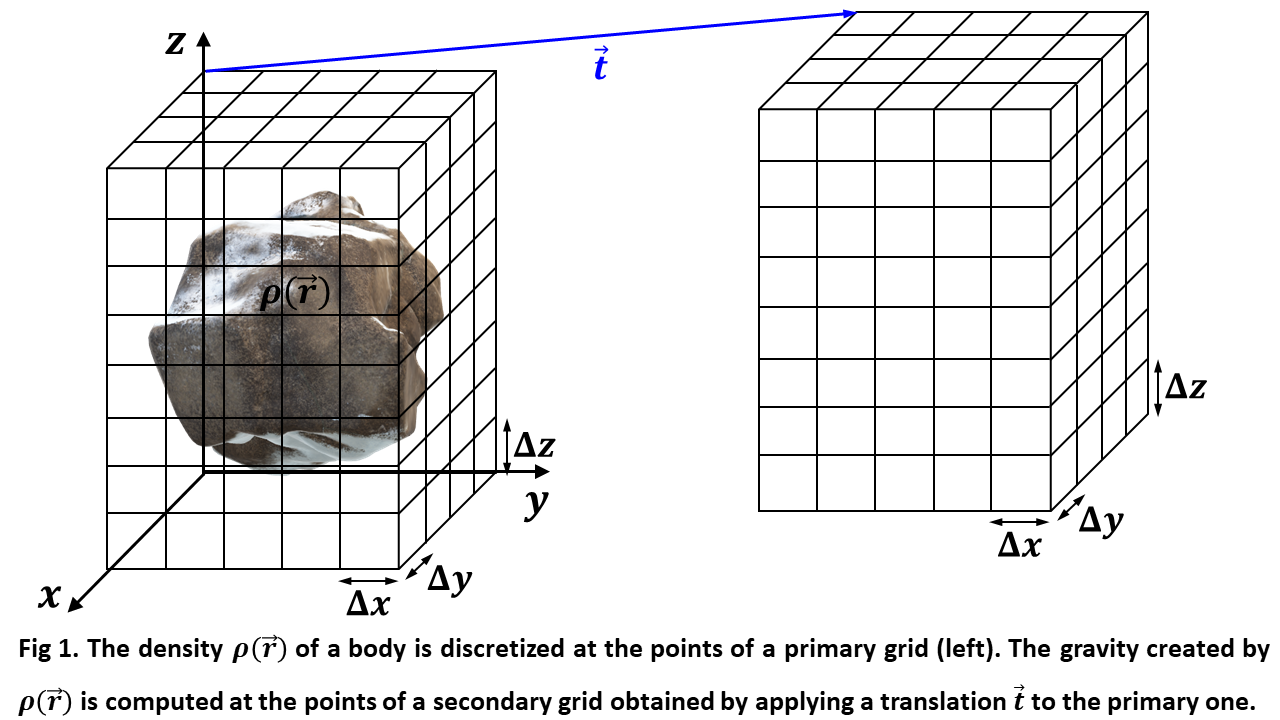
We propose a Fast Fourier Transform (FFT) [3] based algorithm for efficient computation of the gravity field created by a body with any arbitrary mass distribution defined by a mass density ρ(r) discretized with a suitable resolution. Our algorithm starts by considering a primary three-dimensional cartesian grid that contains the considered mass distribution and has uniform point spacing Δx, Δy and Δz in the directions parallel to the x, y and z axes, as shown in Figure 1. The density ρ(r) is then discretized at each primary grid points, thus characterizing the mass distribution of the body, which creates the gravity field. Next, our algorithm considers a secondary three-dimensional cartesian grid that applies an arbitrary translation to the primary one and represents the space region where the gravity field will be computed. Once the primary and secondary grids have been defined, our algorithm computes efficiently the components of the gravity vector created by the body within the primary grid at all the secondary grid points. From the computed gravity values at such points, a suitable interpolation allows extending the calculations to any point inside the region within the secondary grid.
Our algorithm has been applied to bodies having regular and irregular shapes as well as uniform and non-uniform densities, and its high accuracy has been tested by comparison with other exact analytical or numerical solutions. This method is accurate for any relative position of the secondary grid concerning the primary one, including the case in which both grids coincide. Nonetheless, exceptionally high accuracy is observed when the regions within the primary and secondary grids do not overlap. Using 16 GB of RAM memory in different PCs, we achieve primary and secondary grids of up to 241 points at each axis and computation times that do not exceed one minute for each secondary grid.
Results
To test the accuracy of our method, we first compare its outcome with the analytical gravity fields of a 6371 km radius sphere in two cases: a uniform density of 5513 kg/m3 and a density that increases linearly with distance to the center up to 5513 kg/m3. Figures 2 (a) and (b) depict the density distributions of the considered spheres at their equatorial plane.
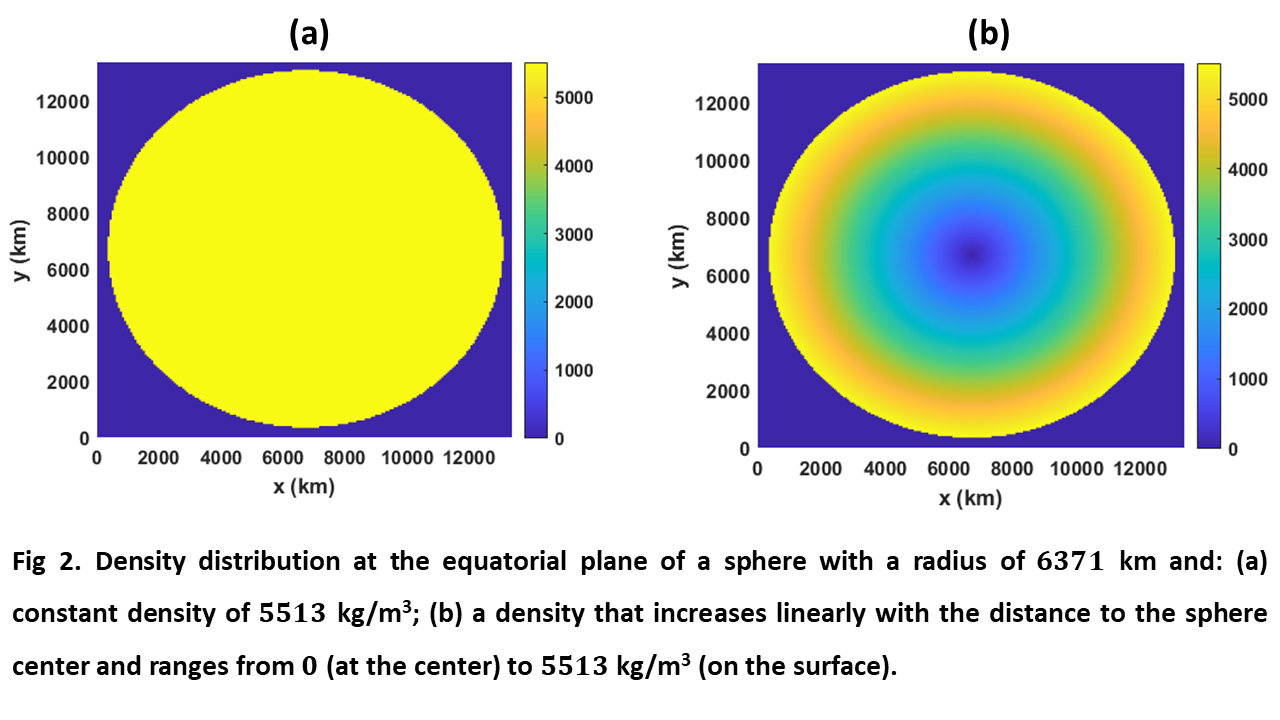
Figure 3 (a) shows the gravity field modulus g computed with our method at the equatorial plane of the sphere considered in figure 2 (a) considering overlapped primary and secondary grids with 201 points in each axis. The results were obtained in 40 seconds and the deviation between the computed and exact values normalized to the maximum exact value were below 6.72·10-3. Figure 3 (b) shows the plot of such normalized deviation at the equatorial plane.
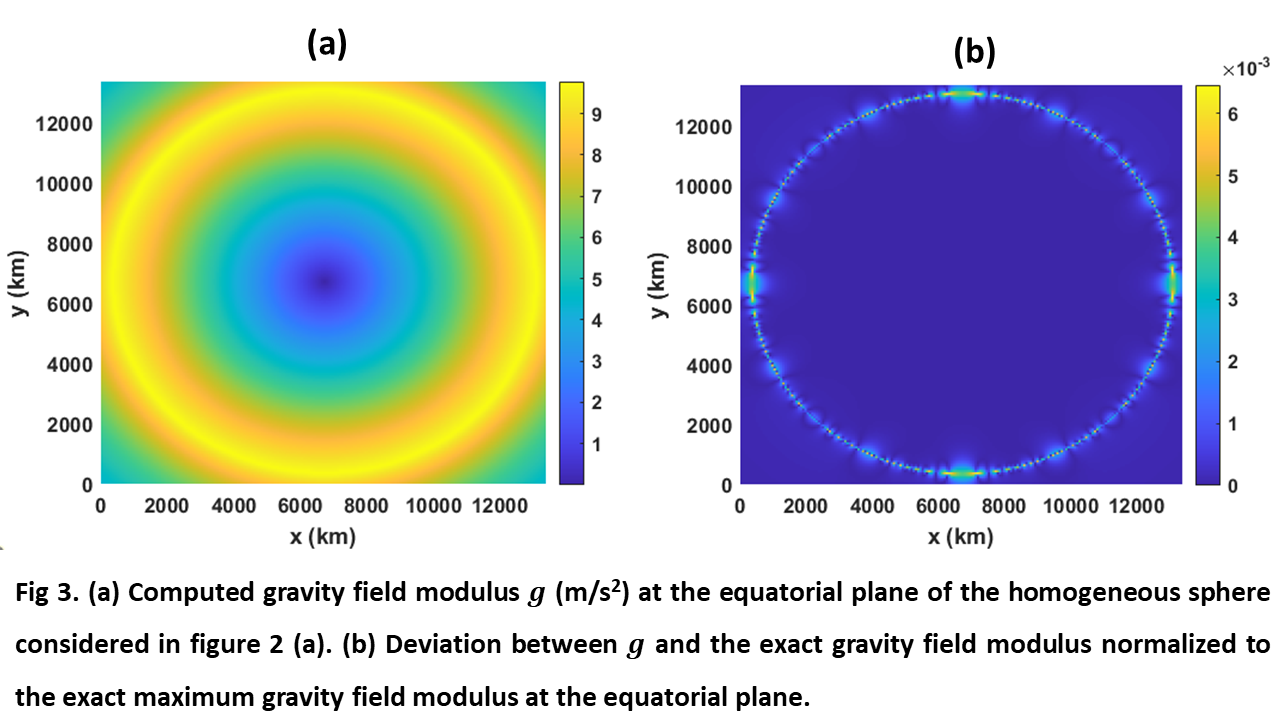
Figure 4 shows the same representations as in figure 3 but applies a translation of 13379 km to the secondary grid, which no longer overlaps the primary one. In this case, the computation time was also of 40 s and the maximum normalized deviation was below 1.8·10-3.
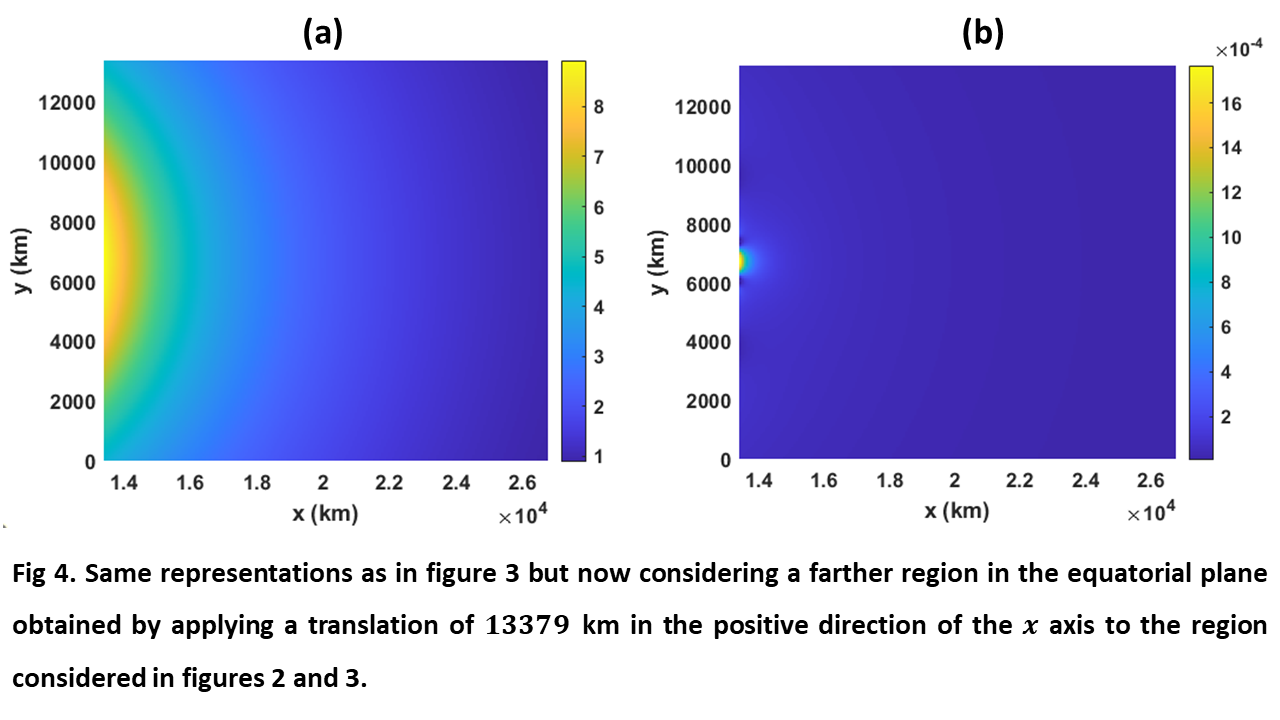
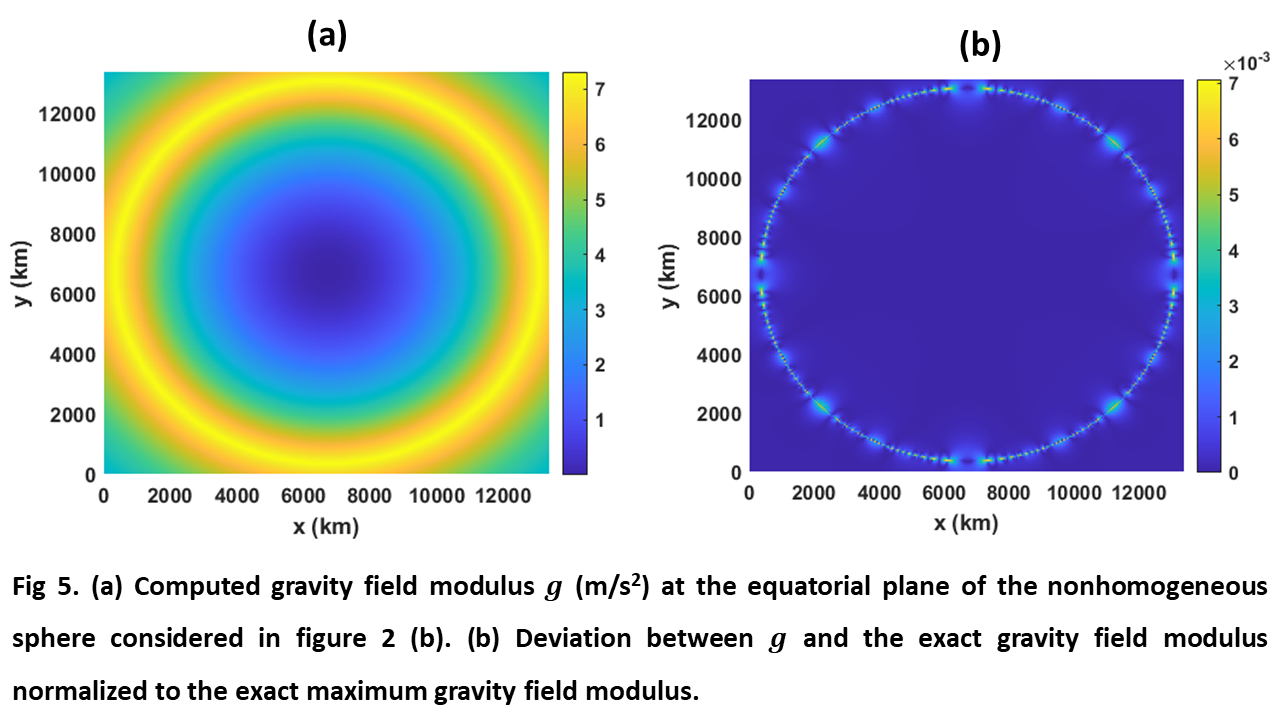
Figure 5 shows the same representations as in figure 3 but considering the nonhomogeneous sphere of figure 2 (b) and 231 points in each grid axis. In this case, the computation time was of 57 seconds, and the maximum normalized deviation was below 7.5·10-3.
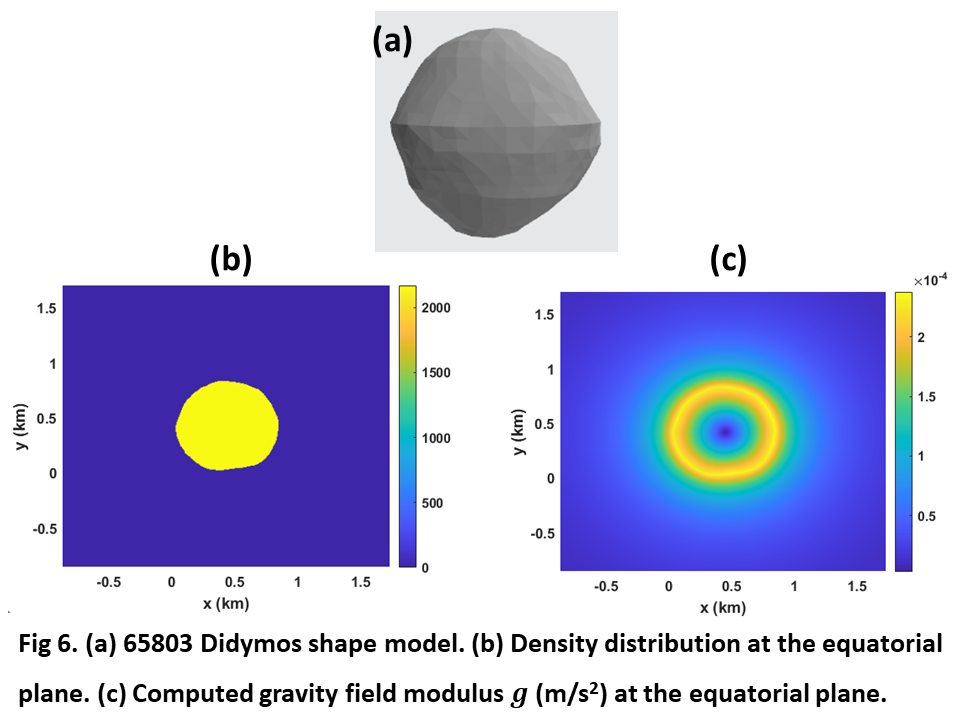
Our method was also applied to compute the gravity field of 65803 Didymos by considering the shape model depicted in figure 6 (a) and a uniform density of 2170 kg/m3. In this case, we considered several adjacent secondary grids with 241 points in each axis, which allowed us to consider a region of the equatorial plane covering points from its mass center up to at least 850 m above the surface. Figure 6 (b) shows the density distribution in such a region, for which the calculated gravity field modulus is shown in figure 6 (c). It should be finally noted that the computed gravity field modulus one the shape model surface was tested to be in very good agreement with the method reported in [4] for the gravity field of polyhedrons.
References
[1] Michel, P. et al. (2018) Adv. in Space Res. 62, 2261-2272
[2] Goldberg, H., Karatekin, O. (2019) 21st EGU General Assembly, EGU2019. id.16735
[3] Cooley, J. W., Tukey, J. W. (1965) Math Comp. 19, 297-301.
[4] Werner, R. A. (1994) Celest. Mech. Dyn. Astron. 59, 253-278
How to cite: Perez-Molina, M., Campo-Bagatin, A., Liu, P.-Y., Parro, L., and Trógolo, N.: FFT based algorithm for efficient gravity field computations in the frame of the NEO-MAPP project, Europlanet Science Congress 2021, online, 13–24 Sep 2021, EPSC2021-674, https://doi.org/10.5194/epsc2021-674, 2021.
The surfaces of rubble-pile asteroids are covered in regolith of a variety of sizes. In some cases like for the asteroid Itokawa, the size distribution of regolith is not uniform across the surface [1]. Some areas are dominated by finer grains, while other areas are covered by larger rocks. There are a number of competing explanations for this observed size segregation [2–4]. One approach is the so called ballistic-sorting-effect [2], where impacting particles sort themselves through different rebound behavior.
In our work we want to set practical limits on the role ballistic sorting can play in shaping an asteroids surface. To this end we conduct a series of drop tower experiments examining the impact kinetics of slow (cm/s) 3 mm sized projectiles into a regolith surface under conditions realistic for asteroid surfaces, i.e. vacuum and low gravity. We track the impactor with high-speed cameras and determine its velocity in 3 dimensions before and after the impact. From these velocities, we can then compute a coefficient of restitution (COR). We then repeat the experiment for surfaces composed of differently sized material. We find that for a regolith bed made from particles of similar size as the impactor we get a lower COR (0,1) than for beds made up of significantly larger (0,5) or smaller particles (0,8). The more elastic collisions for larger sized targets follows from conservation of momentum. For the finer material we suggest that the higher COR is a function of interparticle adhesion.
[1] A. Fujiwara, J. Kawaguchi, D.K. Yeomans, M. Abe, T. Mukai, T. Okada, J. Saito, H. Yano, M. Yoshikawa, D.J. Scheeres et al., Science 312, 1330 (2006)
[2] T. Shinbrot, T. Sabuwala, T. Siu, M.V. Lazo, P. Chakraborty, Phys. Rev. Lett. 118, 111101 (2017)
[3] S. Matsumura, D.C. Richardson, P. Michel, S.R. Schwartz, R.L. Ballouz, Mon. Not. the R. Astron. Soc. 443, 3368 (2014)
[4] A.J. Dombard, O.S. Barnouin, L.M. Prockter, P.C. Thomas, Icarus 210, 713 (2010)
How to cite: Joeris, K., Schönau, L., Keulen, M., Born, P., and Kollmer, J. E.: Experiments on rebounding slow impacts under asteroid conditions, Europlanet Science Congress 2021, online, 13–24 Sep 2021, EPSC2021-577, https://doi.org/10.5194/epsc2021-577, 2021.
INTRODUCTION
The NASA Double Asteroid Redirection Test (DART) mission is set to impact an asteroid of approximately 160 m in size, named Dimorphos (the secondary of the binary Near-Earth Asteroid (65803) Didymos) in September 2022. Little is known about the shape of the satellite, except available ground-based observations are compatible with a spherical to moderately elongated (b / a < 1.2) shape. Also, one primary goal of this mission is to improve our understanding of the impact momentum multiplication factor (‘β’). By checking the potentially antipodal escaping mass, it is possible to refine the estimation of the β factor.
In this work we investigate the possible reaction of Dimorphos to the DART collision, under the assumption that it is a spherical gravitational aggregate produced in the formation of the binary system [1][2]. The very structure of the target is unknown; therefore, we model it by (a) 100,550 mono-dispersed spherical particles in a close hexagonal packing (CHP) configuration; (b) multi-dispersed distribution of 100,000 spherical particles; (c) multi-dispersed distribution of only 13,600 particles.
METHODOLOGY
We perform numerical simulations of the collision event on a stand-alone Dimorphos by using a discrete-element N-body numerical code (PKDGRAV-SSDEM [3]). We do not perform simulations of the shattering phase, we instead concentrate on the effect of the collision on the target, once the shattering phase implying material damage (melting, vaporization, heating, and deformation) is over. Therefore, our synthetic projectile carries the same nominal momentum as the DART spacecraft does, but it delivers to the target only a small fraction of kinetic energy expected to survive once the shattering (non-elastic) phase has dissipated most of the impact kinetic energy [4]. We account for different center and off-center possible impact geometry compatible with DART nominal impact angle (20º) with respect to the target orbital plane (Fig.1).
RESULTS
Here we report on results obtained so far on the effects of the DART impact on Dimorphos in the mono- and multi-dispersed distributions. In particular, we focussed on: a) Changes in spin period and direction of the spin axis, and tracking of their evolution in time. b) Energy distribution of surface particles capable to lift/move over the surface.
Our model of the DART impact in the case of mono- and multi-dispersed distribution of spherical particles shows that:
- Spin period may be changed (decreased) by up to about -30 min in all impact configurations, except for the impact geometry R5 carrying in negative angular momentum. In this case to the system slows down its spin period to +10 min, depending on structure.
- The angular momentum vector may be tilted up to 3 deg with respect to initial direction.
- Spin vector is tilted with respect to angular momentum vector by about 0.1 deg with a precession motion about the latter.
- Negligible mass escaping from antipodal impact region does not substantially affect beta estimation.
- The energy and momentum wave reach the surface away from the impact area so that mass lift and displacement of sizeable particles over the surface are possible.
Such predictions may be of interest in the study of the post-impact dynamics of the system– that will be determined by the Hera mission measurements. Finally, the results may contribute to the interpretation of (lack of) motion of boulders on the surface of Dimorphos away from the impact point. In fact, a comparison of DART- LICIACube and Hera images may show displacement of boulders. This in turn may give information on the internal structure of the body itself.
We are currently modeling non-spherical shape for Dimorphos and the presence of the mass of Didymos primary in the system. On the other hand, instead of using spherical particles as the basic components (or ‘fragments’) of Dimorphos, we plan to apply irregular shapes and the corresponding mass distribution for the fragments. This refinement is expected to better reproduce the actual shear forces between the fragments.
REFERENCES:
[1] A. Campo Bagatin et al. (2001) Icarus, 149-1, 198.
[2] A. Campo Bagatin et al. (2018) Icarus, Volume 302, 343.
[3] Stephen R. Schwartz et al. (2012) Granular Matter 14, 263.
[4] D. W. Walker (2013) Int. J. of Impact Engin. 56, 12.
How to cite: Liu, P.-Y., Benavidez, P. G., Campo Bagatin, A., Richardson, D. C., and Parro, L.: Effects of DART impact on Dimorphos’ spin state and surface motion away from the impact point, Europlanet Science Congress 2021, online, 13–24 Sep 2021, EPSC2021-691, https://doi.org/10.5194/epsc2021-691, 2021.
Abstract
To validate the physical model used to describe gas flow through porous, granular media in recent experiments [1], we conducted a finite element analysis (FEA). The main parameters of a sample, such as gas permeability, Knudsen diffusion coefficient and porosity were determined from the experiment and used as an input for the simulations, with the aim of replicating the pressure evolution (measured quantity) depending on external gas flow. While the results matched well for samples with large and spherical grains, the deviations were significant for materials with small and irregularly shaped grains. An improvement of the model could be achieved with complementary simulation methods and a more detailed analysis of the samples.
1. Introduction
In the past decades, multiple cometary space missions (e.g. Deep Impact and Rosetta) have provided us with better data and understanding of the solar system’s primordial objects. The most recent project is a cooperation of six European institutions, called “Cometary Physics Laboratory (CoPhyLab)” and has already produced a plethora of results (see webpage https://cophylab.space/index.php?id=27). In this work we investigated gas flow through porous media with a simulation approach, in order to compare it with the experiment and validate its physical model.
2. Experiment
The basis and motivation of this work was the experiment performed by [1] (see Figure 1), where the gas flux through a set of artificial and natural porous materials was analysed. To describe the flux J [mol∙m-2∙s-1] of dry air in the given pressure range, a combination of viscous flow and free molecular diffusion was chosen as the physical model:
The gas permeability B0 (viscous flow) and Knudsen diffusion coefficient DK (molecular diffusion) are the main parameters which describe a sample’s ability to allow gas to flow through it. They were determined by measuring the steady state pressure difference across the inlet and outlet of the sample for different gas flux levels. The porosity of the materials was measured through packing experiments.
3. Simulation
Since the physical model describes the gas flow on a macroscopic level, with the main parameters being determined as average values across the whole sample, a FEA is the ideal method. The simulations were computed with the software “COMSOL Multiphysics®”, in which the sample was modelled as a cylinder (see Figure 2). The built-in physics module “Darcy’s Law” was selected to provide the governing equations and all input parameters were taken from the measurements (sample dimensions, B0, DK, porosity, viscosity etc.). In stationary studies, the pressure at the sample outlet and the inward mass flux of the measurements were defined as boundary conditions for the simulation, with the pressure in the rest of the sample being the free variable. For transient studies, the empty volumes of the vacuum chamber, as well as the pressure dependent performance characteristic of the pump were taken into consideration to be able to compare the dynamic process. Furthermore, variation studies of the main parameters were carried out to investigate their individual influence on the pressure evolution. Boundary effects such as the facilitation of gas flow due to lower porosity at the container wall or opening of channels in the sample, or impediment due to the holding sieve, were also analysed by adapting the material parameters for the respective boundary layers.
4. Results
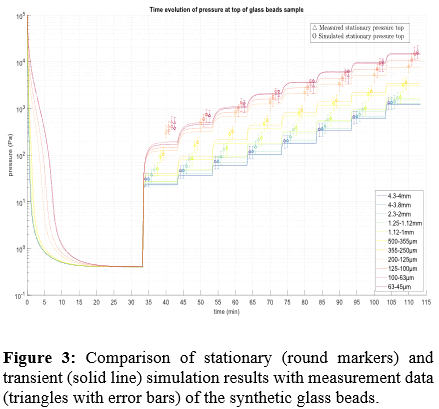
For the comparison of stationary simulation results with those of the experiment, the measured pressure at the inlet face of the sample was taken as a boundary condition and for transient simulations also the outlet face pressure (see Figure 3 for an exemplary comparison of results). The deviations were relatively small for synthetic material with large grain sizes (i.e. glass beads with a diameter above 200 µm). However, for smaller grain sizes and natural materials the discrepancies were quite large (up to 35%) and featured no apparent correlation regarding the amount of gas flow.
Regarding parameter variation studies, it is important to note that the creation of physical samples where only one parameter varies is very difficult, because many of the parameters are directly or indirectly coupled with each other. Nevertheless, the results indicated that in regimes of low B0 and DK, as is the case for small grain size samples, a variation of either parameter has a large influence on the pressure evolution. This is particularly important when considering measurement and regression errors.
When boundary layers were added for the analysis of boundary effects (higher permeability and diffusion at the cylinder wall or in a channel), most of the gas flowed through it and the pressure difference across the sample was minimal. Deviations between simulations with and without the holding sieve, manifested themselves as temporary spikes when the gas flow was increased, with steady state differences below 2%.
5. Summary and Outlook
The results indicate that the applied model is well consistent with the measurements of homogenous samples (e.g. synthetic materials with large, spherical grains). However, in the case of small and irregularly shaped grains, the material’s anisotropy could explain the discrepancies. To improve the existing model, it is necessary to analyse the physical samples on a smaller scale and better understand the interdependencies of the governing parameters. This can be achieved by creating virtual samples and using alternative simulation methods (i.e. Monte Carlo), which work on a microscopic scale.
6. Acknowledgements
This work was carried out in the framework of the CoPhyLab project funded by the D-A-CH programme (GU 1620/3-1 and BL298/26-1/SNF 200021E 177964/FWF I 3730-N36).
References
[1] M. Schweighart, W. Macher, G. Kargl, B. Gundlach, H. L. Capelo, Viscous and Knudsen gas flow through dry porous cometary analogue material, Monthly Notices of the Royal Astronomical Society, 2021;, stab934, https://doi.org/10.1093/mnras/stab934
How to cite: Laddha, S., Kargl, G., and Macher, W.: Modelling of gas flow through porous granular media, Europlanet Science Congress 2021, online, 13–24 Sep 2021, EPSC2021-42, https://doi.org/10.5194/epsc2021-42, 2021.
Motivation
Every astronomical survey contains observational biases. However, by taking into account the pointing history of the survey, and taking into account its intrinsic properties, it is possible to successfully compare synthetic model populations with actual observations. This approach has proven its success in modelling the outer Solar System population in the Outer Solar System Origin Survey (OSSOS; Bannister et al., 2016, Lawler et al., 2018). At the other end of the Solar System, debiasing has been essential to construct a comprehensive population model of near-Earth asteroids (Granvik et al., 2018).
The anticipated amount of data expected with the upcoming commissioning of Vera C. Rubin Observatory's Legacy Survey of Space and Time (LSST; Ivezić et al., 2019) will provide a plethora of opportunities to probe various populations within the Solar System with unprecedented precision. However, the yet undecided cadence of LSST will be complicated, rendering debiasing of small solar system object populations difficult.
Up to date, several survey simulators for solar system objects have emerged as integral parts or preparations of extensive Solar System survey work (e.g., Petit et al, 2010, Delgado et al., 2014, Jones et al., 2014). The strive of the current work is, while learning on the best practices of the existing tools, to construct a tool in principle agnostic with regards to the input survey suitable for exploring a wide selection of scientific questions. For that purpose, we will provide a computational layer that can take into account a wide selection of physical parameters of small Solar System bodies for accurate simulations. The current setup of the simulator is optimised for LSST.
Design
The framework of the open-source post-processing tool is the python programming language and the versatile pandas data processing library. The post-processing tool is designed to work independently from any survey. To provide the pointing simulation, we use the Asteroid Survey Simulator (Naidu et al., 2018). The design of the post-processing tool is modular and customisable, allowing the user to specify a trade-off between precision and computational speed required for a task at hand. For instance, an outer Solar System researcher would be interested in the precise location of chip gaps on the camera whereas the inner Solar System researcher would rather require precise modelling of trailing losses. In addition, the architecture of the software enables the users to easily include their own functionality to the processing.
The input of the post-processing tool consists of the pointing simulation, the collection of orbits, colours and phase angle parameters, and, for comets, the simple cometary activity model parameters per A'Hearn et al. (1984). The workflow includes a series of consequent filters, where observations are dropped either due to simulated intrinsic properties (e.g., too bright, too faint) or due to the simulations of the software behaviour (e.g. automatic Solar System object processing, Eggl et al., 2020). The tool is designed to be able to perform both at a regular desktop and supercomputer environments.
Anticipated usage and summary
At first, we expect the survey simulator and the post-processing tool to be used to model different solar system sub-populations observed by LSST as described in the LSST Solar System Science Collaboration Roadmap (Schwamb et al. 2018).
We will describe the architecture and workflow of the post-processing tool for the survey simulator. We will also present preliminary results from using the survey simulator by validating the post-processing results using a concise, yet well-defined sub-population, such as Earth's temporary satellites (Fedorets et al., 2020).
References:
A'Hearn, M. et al. (1984) AJ 89 579.
Bannister, M. et al. (2016). AJ 152 70.
Delgado, F. et al. (2014) The LSST operations simulator
Eggl, S. et al. (2020) LSST Solar System Processing Pipeline. Presented at LSST SSSC Virtual Sprint on June 16th 2020.
Fedorets, G. et al. (2020) Icarus 338 113517.
Granvik, M. et al. (2018) Icarus 312 181.
Ivezić, Ž. et al. (2019) AJ 873 111.
Jones, R. L. et al. (2014) The LSST metrics analysis framework (MAF).
Lawler, S. et al. (2018) FraSS 5 14.
Naidu, S. P., Farnocchia, D., Chesley, S. R. (2018) Asteroid Survey Simulator.
Petit, J.-M. et al. (2011), AJ, 142 131.
Schwamb, M. E. et al. (2018) Large Synoptic Survey Telescope Solar System Science Roadmap. arXiv 1802.01783.
How to cite: Fedorets, G., Eggl, S., Naidu, S. P., Cornwall, S., Berres, A., Schwamb, M. E., and Jurić, M.: Post-processing layer of the survey simulator for LSST Solar System observations, Europlanet Science Congress 2021, online, 13–24 Sep 2021, EPSC2021-662, https://doi.org/10.5194/epsc2021-662, 2021.
In our solar system, terrestrial planets and meteoritical matter exhibit various bulk compositions. To understand this variety of compositions, formation mechanisms of meteorites are usually investigated via a thermodynamic approach that neglects the processes of transport throughout the protosolar nebula. Here, we investigate the role played by rocklines (condensation/sublimation lines of refractory materials) in the innermost regions of the protosolar nebula (PSN) to compute the composition of particles migrating inward as a function of time. To do so, we utilize a one-dimensional accretion disk model with a prescription for dust and vapor transport, sublimation, and recondensation of refractory materials [1]. Figure 1 shows the computed composition of the PSN in the Mg-Fe-Si ternary diagram, and Figure 2 shows the same profiles but where we represent the Fe wt% as a function of heliocentric distance. We find that the diversity of the bulk composition of cosmic spherules, chondrules, and chondrites can be explained by their formation close to rocklines. This suggests that solid matter is concentrated in the vicinity of these sublimation/condensation fronts. Although our model only focuses on the most abundant refractory species (ferrosilite, enstatite, fayalite, forsterite, iron sulfide, kamacite, nickel) and relevant thermodynamic data, it suggests that rocklines played a major role in the formation of small and large bodies in the innermost regions of the protosolar nebula. The increase in iron abundance close to iron alloys rocklines gives some hints on the origin of dust particles that formed Mercury’s large core.
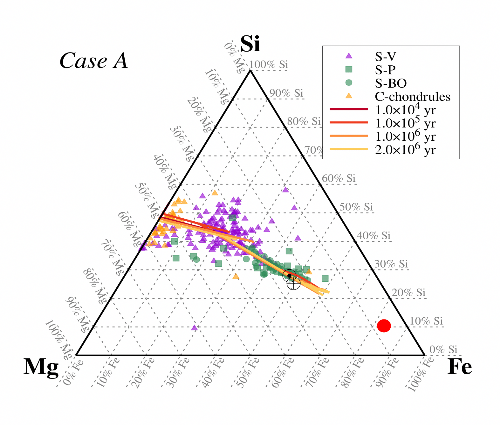
Figure 1. Composition profiles of the PSN in a Mg-Fe-Si ternary diagram (expressed in mass fraction) at different times, with composition of glass cosmic spherules (S–V type), barred olivine spherules (S-BO type), porphyritic spherules (S-P type) and C-chondrules. Protosolar and Earth’s compositions are represented by Sun’s and Earth’s symbols, respectively, and Mercury’s composition is represented by a red circle.
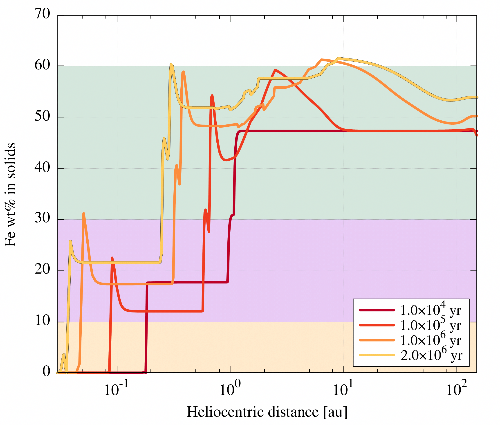
Figure 2. Same as Figure 1, but here the Fe wt% is represented as a function of heliocentric distance. Color boxes correspond to typical compositions of chondrules (0%–10%), glass cosmic spherules (10%–30%), and porphyritic and barred olivine cosmic spherules (30%–60%).
[1] Aguichine, A., Mousis, O., Devouard, B., and Ronnet, T. 2020, ApJ, 901, 97.
How to cite: Aguichine, A., Mousis, O., Devouard, B., and Ronnet, T.: Thermal and dynamical effects around rocklines in the innermost regions of the protosolar nebula, Europlanet Science Congress 2021, online, 13–24 Sep 2021, EPSC2021-26, https://doi.org/10.5194/epsc2021-26, 2021.
Abstract
Stars passing close by the Sun experience a change of their trajectory due to gravitational interaction -- which also changes the trajectory of the Sun around the galactic center. In this study we show possible changes for the outer Solar system caused by the future flyby of Gliese 710 considering various inclinations of the passing star.
Introduction
Most stars are born in clusters. Gravitational interactions between the cluster members can have significant influence on the planet formation process and small body distributions [2]. Even after having left the cluster flybys with other stars can happen. The Sun will experience such a flyby in about 1.36 Myr. Gliese 710 (a K-type star) will probably pass inside of the Oort cloud [1]. This motivated us to investigate the influence of passing stars on the trajectory of the Sun as well as on the orbits of the gas planets [3,5] and Oort cloud objects. The stellar flyby has been carried out for different stellar types (M -- G-type stars) with different encounter velocities [4] as well as different impact parameters and different inclinations of the passing star.
Setup and Method
The setup uses the outer Solar system including the Sun, the 4 giant planets (Jupiter, Saturn, Uranus, and Neptune), Oort cloud comets, and a passing star. The passing star initially moves on a straight line passing the Sun at a certain distance (i.e., impact parameter d). The ranges for the parameters are summed up as follows:
- Mass of passing star: 0.21 MSun, 0.6 MSun (i.e., Gliese710), and 1 MSun
- Impact parameter: d between 4000 and 12000 au (estimated area of Gliese 710 flyby [1] -- see figure 1) and for closer flybys (e.g., 400 to 600 au -- see figure 2)
- Velocity of the passing star: taken from [4]: v - σv , v , v + σv -- see figure 1
The numerical simulations were carried out using the newly developed N-body package [6], i.e., a parallelized GPU-N-body code designed to handle the gravitational interaction of up to 10000 massive particles. Each stellar flyby was integrated for about 30000 yrs where both the initial and the final position of the passing star were 100000 au away from the Sun.
Results
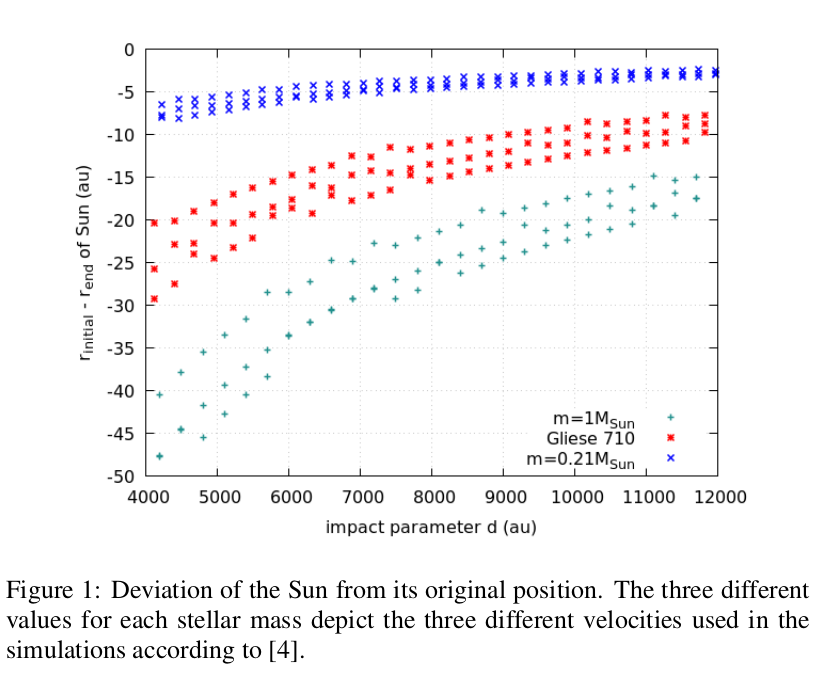
The results show a distinct bend in the trajectory of the passing stars at the point of closest approach to the Sun. Vice versa the Sun is diverted from its original trajectory, too. Figure 1 shows how much a passing star influences the Sun's path. The Sun might be diverted by up to 30 au by a K-type star. For impact parameters larger than 12000au the diversion is smaller than 20au even for a passing G-type star.
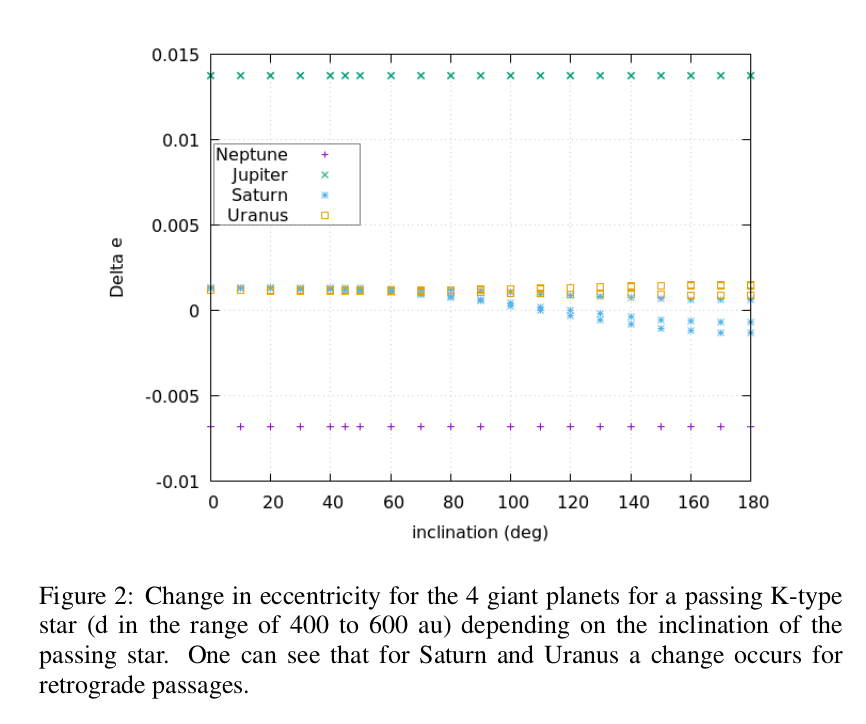
An analysis of the orbits of the 4 giant planets after an inclined flyby shows that for retrograde passages of a K-type star the eccentricity for Saturn is decreased. For Uranus the eccentricity increases for inclinations bigger than 80° -- see figure 2.
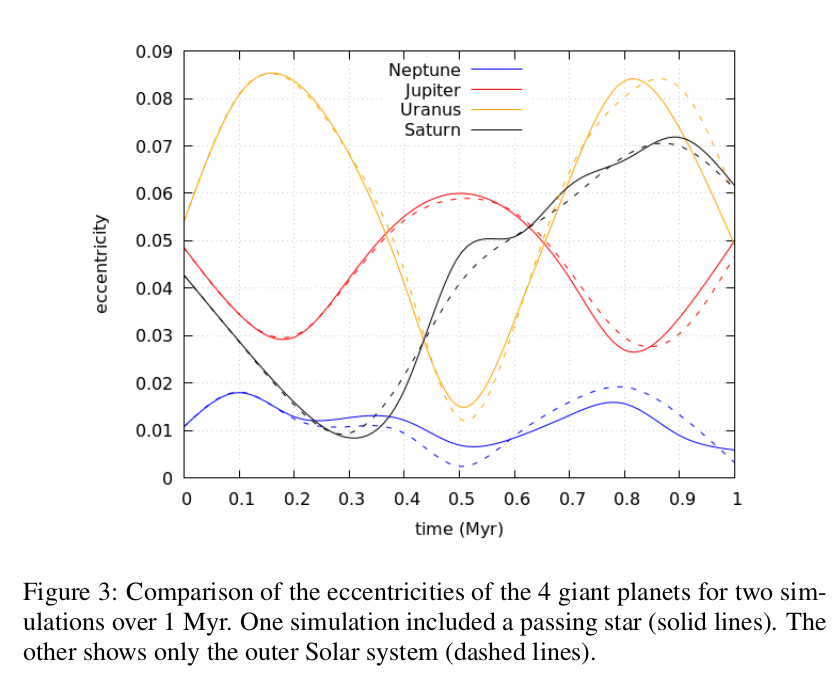
For a passing G-type star at d = 600 au with 0° inclination the long term changes in the eccentricities of the 4 giant planets are depicted in figure 3.
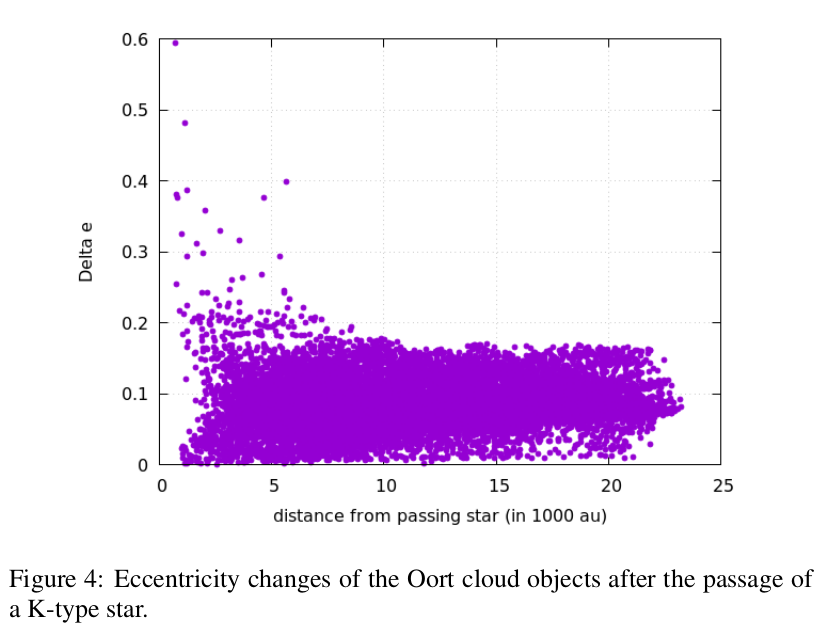
The scattering of Oort cloud objects by a passing star with d=12000au, M=0.6MSun (Gliese 710), and inclination of 0° is depicted in figure 4. Objects in the vicinity of the passage (up to 4000 au distance from the passing star) get scattered the strongest. A change in eccentricty is possible up to 0.6. If Gliese 710 passes at 4000 au, we assume that also Kuiper belt objects can be perturbed. Additionally, we assume that in the inner Oort cloud there are more objects than in the outer cloud (used in our integrations) thus more objects might get scattered inwards.
Summary and Conclusions
We showed that the orbit of the Sun around the galactic center can be altered depending on the properties of the passing star (mass, velocity, impact parameter). This can slightly change change its orbit in the Milky Way.
Our study for the outer Solar system shows only small perturbations of the eccentricities of the planetary orbits. Only inclinations of the passing star larger than 80° show some changes of the orbits of Uranus and Saturn. These small perturbations could influence the orbital behaviour and will be studied in more detail. In this context figure 3 shows slight deviations of the planetary eccentricities after a stellar passage with inclination of 0°. The changes of the orbits are only visible in the long time computation.
Short time changes are visible in the orbits of Oort cloud objects which experience the close flyby of a star.
Acknowledgements
This research was funded in whole by the Austrian Science Fund (FWF) [P33351-N].
References
[1] Bailer-Jones C.~A.~L.: New stellar encounters discovered in the second Gaia data release; A$\&$A, 616, A37, 2018.
[2] Bancelin D., Nordlander T., Pilat-Lohinger E., Loibnegger B.: Dynamics of passing-stars-perturbed binary star systems; MNRAS, 486, 4, 4773-4780, 2019.
[3] Innanen K.~A., Zheng J.~Q, Mikkola S., Valtonen M.~J.: The Kozai Mechanism and the Stability of Planetary Orbits in Binary Star Systems; AJ, 113, 1915, 1997.
[4] Rickman H., Fouchard M., Froeschl{\'e} C., Valsecchi G.~B.: Injection of Oort Cloud Comets: The Fundamental Role of Stellar Perturbations; Asteroids, Comets, Meteors 2008, LPICo, 1405, 8077, 2008.
[5] Tanikawa K., Ito T.: Subsystems in a Stable Planetary System; PASJ, 59, 989, 2007.
[6] Zimmermann M.: The influene of binary systems on planetesimal disks. Master thesis, University of Vienna, 2021.
How to cite: Loibnegger, B., Pilat-Lohinger, E., Zimmermann, M., and Clees, S.: Influence of stellar flyby events on planetary systems, Europlanet Science Congress 2021, online, 13–24 Sep 2021, EPSC2021-672, https://doi.org/10.5194/epsc2021-672, 2021.
Please decide on your access
Please use the buttons below to download the presentation materials or to visit the external website where the presentation is linked. Regarding the external link, please note that Copernicus Meetings cannot accept any liability for the content and the website you will visit.
Forward to presentation link
You are going to open an external link to the presentation as indicated by the authors. Copernicus Meetings cannot accept any liability for the content and the website you will visit.
We are sorry, but presentations are only available for users who registered for the conference. Thank you.
Please decide on your access
Please use the buttons below to download the presentation materials or to visit the external website where the presentation is linked. Regarding the external link, please note that Copernicus Meetings cannot accept any liability for the content and the website you will visit.
Forward to session asset
You are going to open an external link to the asset as indicated by the session. Copernicus Meetings cannot accept any liability for the content and the website you will visit.
We are sorry, but presentations are only available for users who registered for the conference. Thank you.

