Multiple terms: term1 term2
red apples
returns results with all terms like:
Fructose levels in red and green apples
Precise match in quotes: "term1 term2"
"red apples"
returns results matching exactly like:
Anthocyanin biosynthesis in red apples
Exclude a term with -: term1 -term2
apples -red
returns results containing apples but not red:
Malic acid in green apples
hits for "" in
Network problems
Server timeout
Invalid search term
Too many requests
TP9
We welcome oral and poster presentations across this broad range of studies about natural or artificial impact collision phenomena on planetary surfaces and small bodies. In particular, abstracts on impact modelling, impact laboratory experiments, geologic and structural mapping, petrographic and geochemical analysis of impact products, as well as remote sensing observations from space missions to planets and small bodies.
Impacts also have a technical application for Planetary Defence, therefore we invite contributions from studies related to DART experiments and the upcoming HERA mission.
Session assets
There is a general consensus that cometesimals formed in an original reservoir, the primordial Kuiper-belt (PKB), between 20-40 au from the Sun (e.g., Nesvorný 2018). From there, they were scattered into the current trans-Neptunian region. The so-called scattered disk is the source reservoir for Jupiter family comets, JFCs (e.g., Duncan & Levison 1997). Crucially, the scattering phase of cometesimals must occur as the gas disk dissipates to prevent the damping of the scattered orbits. This is well described by the final phase of planetesimal-driven migration, particularly Neptune’s migration (e.g., Nesvorný et al. 2018).
Current planetesimal formation models predict an initial Gaussian size distribution centred around 100 km (e.g., Polak & Klahr 2023). Therefore, the question arises if such an initial size frequency distribution (SFD) of the PKB can reproduce the observational constraints of the current Kuiper-belt. Indeed, we find in Bottke et al. 2023 that the collisional evolution of the PKB based on planetesimal formation models will evolve into a SFD that is consistent with (i) crater SFDs on icy satellites and KBOs and (ii) observed SFDs of populations derived from the PKB (e.g., Jupiter’s Trojans). The craters on icy satellites allow us to infer the SFD of the PKB population scattered onto planet-crossing orbits and those that went to the scattered disk (i.e., source of Centaurs/JFCs).
Because comets originate from that same PKB but are then scattered into the Kuiper-belt, they similarly go through the collisional evolution described above. This raises the question of whether the collisional grinding from 100 km cometesimals to the few km sized comets can preserve the primitive properties of comets (i.a., they contain highly volatile species such as CO and have very low densities). Here, we will present recent simulations showing the degree of compaction and heating due to the collisional evolution.
How to cite: Marschall, R., Morbidelli, A., Nesvorný, D., Bottke, W. F., and Vokrouhlický, D.: Comets are fragments: Determining the degree of processing during the collisional grinding of the primordial Kuiper-belt., Europlanet Science Congress 2024, Berlin, Germany, 8–13 Sep 2024, EPSC2024-862, https://doi.org/10.5194/epsc2024-862, 2024.
Abstract
The super slow rotation of the main belt asteroid 253 Mathilde has puzzled scientists for over twenty years, since the first glimpse by the Near Earth Asteroid Rendezvous (NEAR) spacecraft in 1997 [1]. With a very long rotation period of 418 hours [2], Mathilde is one of the slowest rotators in the solar system. The YORP effect, which was previously suggested to explain the slow rotation of small asteroids [3], is unlikely to spin down a 53-km-diameter object in 4.5 Gyr. Alternatively, the impact mechanism could be an explanation. Mathilde has at least five giant craters that are comparable in size to its radius [4], where the related impacts must have delivered a fair amount of angular momentum to the body and possibly spin it down [5]. It is also surprising that all the giant craters are well preserved without destroying each other, possibly due to the highly porous nature [6]. However, how these giant cratering impacts interacted with the structure of Mathilde, and ultimately evolved it into a slowest rotator, remain unexplained by existing works.
To re-examine these questions, we performed smoothed particle hydrodynamics (SPH) simulations of the giant cratering impacts on a homogeneous porous target, implemented with the Drucker-Prager strength model, Tillotson EOS for basalt, and the P-α porosity model. The simulations include both phases of shock fragmentation and gravitational collapse, which lasts a few hours until the remnant body reaches a stable rotation. The angular momentum (AM) transfer efficiency ζ, the ratio between the rotation change of the target and AM of the impactor’s orbital motion, is then expressed as a function of the impact angle. To model the impact-induced spin history of Mathilde, we generated sequential/virtual impacts in each of our 105 Monte-Carlo tests (e.g., Figure 1), following the main belt size distribution and the intrinsic collision probability. The statistic results suggest a median spin change ∆ω of 0.6 rev/d, compared with the 2.2 rev/d in a perfectly inelastic case. Note that the spins of large asteroids (>50 km) peak at ~1–2 rev/d, which should represent the primordial spin at their formation. Assuming a initial spin of 1 rev/d, there are only 2% cases ending at < 0.5 rev/d, and 0.02% at < 0.1 rev/d. The slow rotating Mathilde could be in these rare cases, or formed at a much lower spin rate. Future works will investigate the effect of different porous structures like micro/marco-porosity or rubble piles, to help constrain the properties and impact process of Mathilde-like primitive asteroids.
Figure 1. Impact-induced spin history example, where a 53-km-diameter target is impacted by 75 impactors (>0.5 km) at different velocities and angles during 4.5 Gyr.
References
[1] J Veverka, P Thomas, A Harch, et al. NEAR’s flyby of 253 Mathilde: Images of a C asteroid. Science, 278(5346):2109–2114, 1997.
[2] Stefano Mottola, William D Sears, Anders Erikson, et al. The slow rotation of 253 Mathilde. Planetary and Space Science, 43(12):1609–1613, 1995.
[3] P Pravec, Alan W Harris, D Vokrouhlicky, et al. Spin rate distribution of small asteroids. Icarus, 197(2):497–504, 2008.
[4] AF Cheng and OS Barnouin-Jha. Giant craters on Mathilde. Icarus, 140(1):34–48, 1999.
[5] Masahisa Yanagisawa and Sunao Hasegawa. Momentum transfer in oblique impacts: Implications for asteroid rotations. Icarus, 146(1):270–288, 2000.
[6] Kevin R Housen, Keith A Holsapple, and Michael E Voss. Compaction as the origin of the unusual craters on the asteroid Mathilde. Nature, 402(6758):155–157, 1999.
How to cite: Jiao, Y., Asphaug, E., Cheng, B., and Baoyin, H.: Effect of Giant Cratering Impacts on the Slow Rotation of Asteroid Mathilde, Europlanet Science Congress 2024, Berlin, Germany, 8–13 Sep 2024, EPSC2024-287, https://doi.org/10.5194/epsc2024-287, 2024.
The detailed observations of the boulder populations on rubble-pile asteroid surfaces such as Ryugu, Bennu or Dimorphos provide insights into their physical properties and the evolution of their host asteroids [1]. Asteroid surfaces evolve through impacts and thermal processing – both mechanisms that may lead to boulder fragmentation (Figure 1).
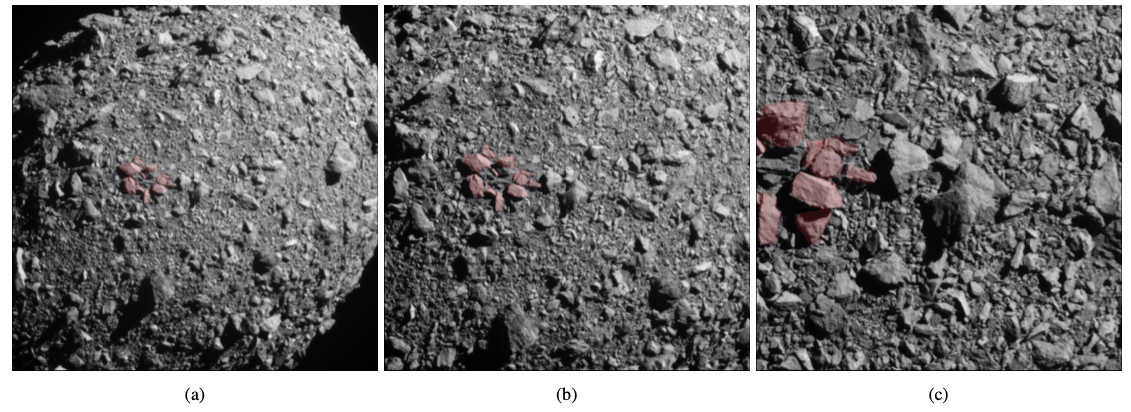
Figure 1: a) - c) Images acquired by the DART spacecraft approaching the surface of Dimorphos. Boulders which may have originated as a result of an impact event on the asteroid surface are highlighted in red (NASA/Johns Hopkins APL).
Here, we present numerical simulations using the Bern SPH code [2] to study the impact fragmentation of boulders on asteroid surfaces. Before applying our models to asteroid scales, we successfully validated them by comparing the results with boulder disruptions observed in laboratory impact experiments [3].
In scenarios of impacts on rubble-pile asteroids, our Bern SPH simulations include the displacement and late-stage evolution of the boulder fragments, using a recently developed approach [4,5]. This allows us to determine their final position on the asteroid surface or if they are ejected from the asteroid.
Our initial results suggest that only for boulders with a relatively low bulk tensile strength (<≈ 104-105 Pa) would the impact fragmentation allow the fragments to stay on the asteroid surface close to the impact point. For higher boulder tensile strength, the specific impact energies required for boulder fragmentation lead to fragment velocities above the escape speed of small asteroids (of the order of tens of cm/s). Our results thus provide constraints for the boulder properties and implications for the surface evolution of rubble-pile asteroids through impact processes.
Figure 2: Bern SPH simulation of boulder fragmentation by impacts. The fate of the boulder fragments (final position on the surface or ejection) depends on the boulder strength, impact energy and surface gravity.
Acknowledgements: S.D.R. and M.J. acknowledge support from the Swiss National Science Foundation (project number 200021_207359). R.-L.B. was funded by NASA New Frontiers Data Analysis Program grant number 80NSSC22K1035.
References:
[1] Ballouz, R-L et al. (2023). “Disrupted Boulders on the Surfaces of Near-Earth Asteroids Bennu, Ryugu, and Dimorphos”. LPI Contributions 2806, p. 2505.
[2] Jutzi, M., Benz, W. & Michel, P. (2008) Numerical simulations of impacts involving porous bodies: I. Implementing sub-resolution porosity in a 3D SPH Hydrocode. Icarus 198, 242–255.
[3] Cline II, CJ et al. (2023). “Using Controlled Impact Experiments to Understand the Effects of Cohesive Blocks on the Cratering Process”. Lunar and Planetary Science Conference.
[4] Jutzi, M., Raducan, S. D., Zhang, Y., Michel, P. & Arakawa, M. (2022). Constraining surface properties of asteroid (162173) Ryugu from numerical simulations of Hayabusa2 mission impact experiment. Nature Communications 13, 7134
[5] Raducan, SD et al. (2024). “Physical properties of asteroid Dimorphos as derived from the DART impact”. Nature Astronomy 8, pp 445–455
How to cite: Della Moglie, P., Raducan, S. D., Jutzi, M., Ballouz, R. L., Cline, C. J., and Cintala, M. J.: SPH Simulations of Boulder Disruptions: from Laboratory Scale Impacts to Asteroids, Europlanet Science Congress 2024, Berlin, Germany, 8–13 Sep 2024, EPSC2024-803, https://doi.org/10.5194/epsc2024-803, 2024.
Introduction Impact processes play a dominant role in the evolution of the solar system at nearly all size scales, from planet formation all the way to micrometeorite impacts on small bodies. The outcomes of collisions are often parameterized by Q, which is the specific impact energy. The parameter Q*D denotes the catastrophic disruption threshold, which is defined as the specific energy required disperse half of the total mass involved in the collision, leaving remaining mass in the largest remnant. Many studies have attempted to determine Q*D numerically, demonstrating that it is a complicated function of the target’s physical and material properties (size, density, strength, internal structure, etc.) and impact conditions (impactor size, velocity, angle, etc.) (e.g., Benz and Asphaug 1999; Leinhardt and Stewart 2012; Jutzi 2015; Ballouz et al. 2015; Raducan et al. 2024, among others). Here, we introduce the concept of Q*TD, which is the catastrophic disruption threshold for a natural satellite, accounting for tides from the central body.
We will present a suite of hundreds of simulations varying the impact conditions to derive a scaling relationship between the mass of the largest remnant, Mlr, and Q*TD . We will show that the influence of an external tidal potential plays an important role in determining both the mass of the largest remnant and the size-frequency distribution of ejected fragments, even for targets well outside the primary’s Roche limit. Finally, we discuss the implications for this modified impact scaling law for small satellites such as Phobos, Deimos, and the inner satellites of the gas and ice giants.
Methods Most previous studies considered only non-rotating targets in inertial space, although pre-impact rotation can enhance mass loss (Ballouz et al. 2014) and the role of tides is known to play a significant role in some scenarios (Hyodo and Ohtsuki 2014). Accounting for tides in collisional disruptions means there are many more free parameters as the problem is no longer spherically symmetric. To keep the problem computationally feasible, we consider a target with a single set of physical and material properties. Then, we vary the impactor size, velocity, impact angle, impact direction, and the orbital distance of the target. We only consider relatively low-speed impacts (v ≪ 1 km s−1), so both the collision and subsequent gravitational accumulation are modeled using pkdgrav, a N-body code that includes particle self-gravity and handles particle contacts using the soft-sphere discrete element method (Richardson et al. 2000; Schwartz et al. 2012; Zhang et al. 2017).
Our simulations consider a spherical target, consisting of randomly arranged particles with a size-frequency distribution following a truncated power law with an index of -3. The particles are cohesionless and have frictional angle of . Particles have a density of 2 g cm-3, which gives the target a bulk density and radius of ρbulk ~1.35 g cm and R~10 km, respectively. The target has a surface escape velocity of vesc ~9 m s−1. The target is placed on a circular orbit around a Mars-mass primary at varying semimajor axes and allowed to settle into an equilibrium before the impact is performed. These simulations assume the target to be tidally locked to the primary, so the target’s spin rate varies along with its orbital distance. The target is slightly smaller in size and less dense than Phobos, however the results can be generalized to any small satellite around a planet.
Preliminary Results We show an example of a head-on collision with an impactor Mimp = 0.1Mtarg at an impact velocity of v = 10vesc ~ 90 m s−1. Snapshots from this simulation at three orbital semimajor axes are shown in Fig. 1. These three semimajor axes correspond to aorb = [1.31, 1.44, 1.97]RRRL, where RRRL is the radius of the target’s rigid-body Roche limit. We see a sharp transition between the two innermost cases. When aorb = 1.31RRRL, the body first undergoes a catastrophic collision but the disturbs the satellite enough causing to to undergo a complete tidal disruption despite it technically being outside the Roche limit. When aorb is increased slightly to 1.45RRRL, the body is safe from disruption and the mass of the largest remnant is Mlr ~0.61Mtot, where Mtot is the combined mass of the target and impactor. As the orbital distance is increased further to aorb = 1.97RRRL, the target is able to retain more mass. We attribute this to two factors. Since the target starts in a tidally-locked configuration, a larger aorb means a slower rotation and therefore a slightly weaker surface gravity. The second, and more important factor, is that the Hill sphere increases with aorb, as does the escape velocity required to reach the Hill sphere, so less ejecta is able able to escape onto planetocentric orbits for the same impact.
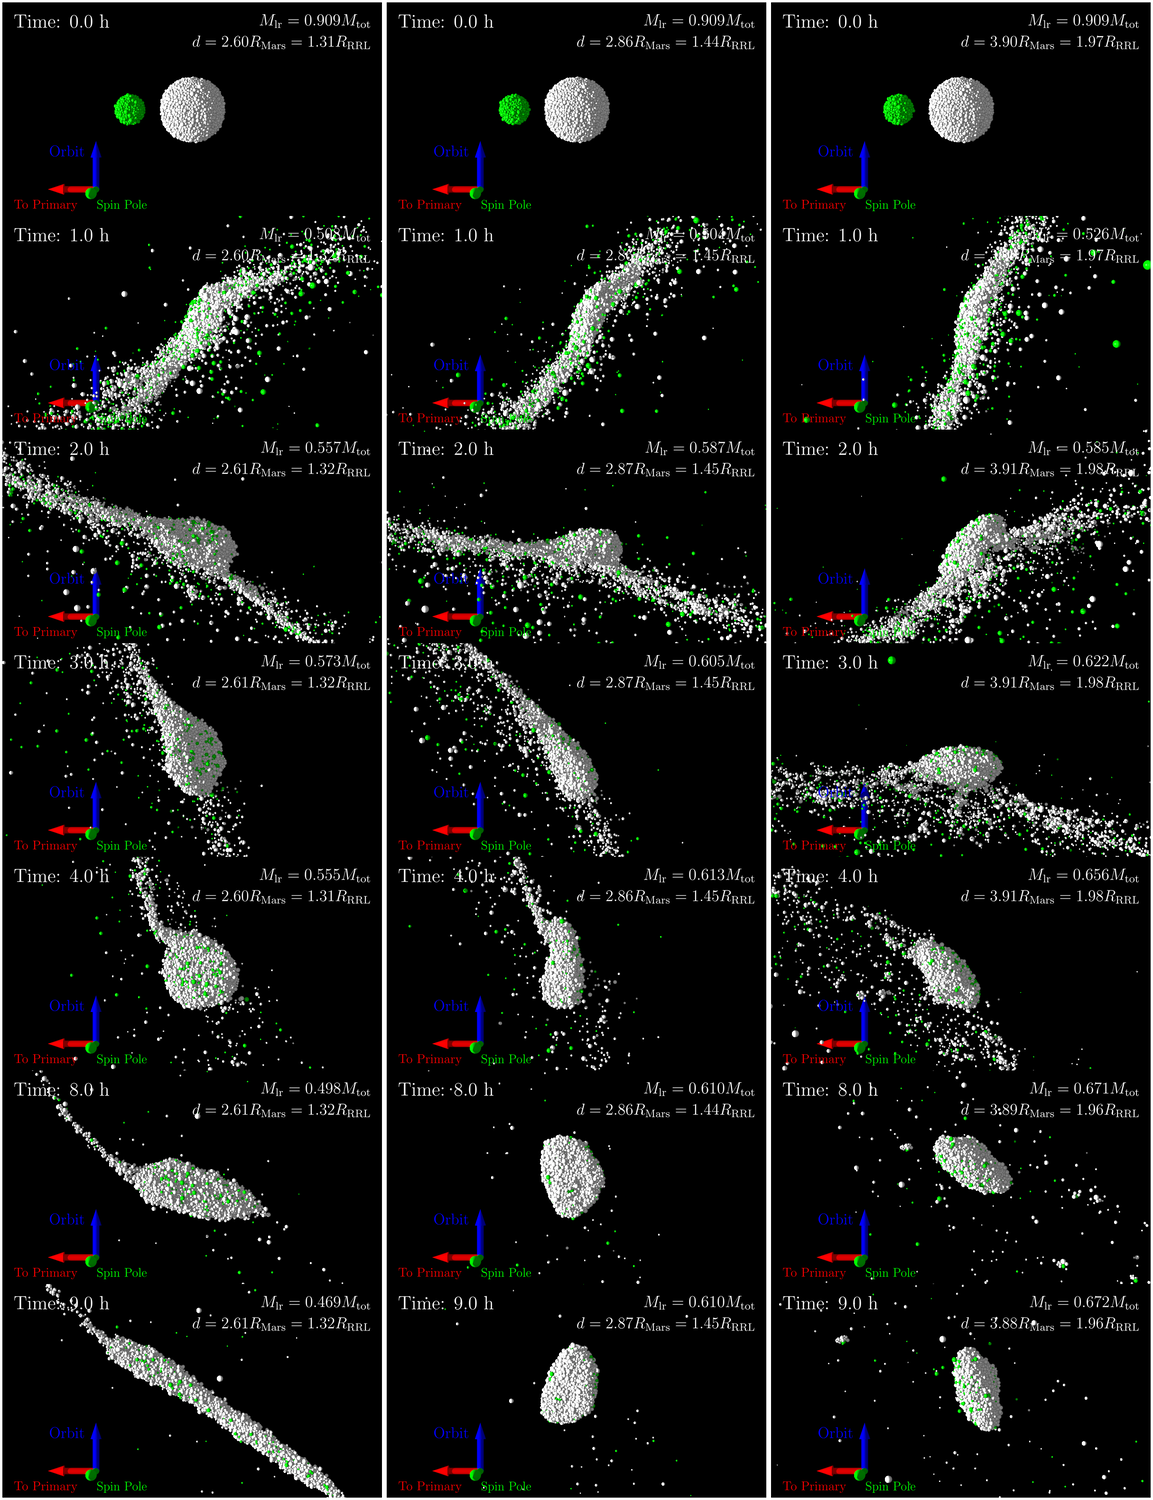
Figure 1: Snapshots from the first 9 hours of three simulations with the same impact conditions at different orbital distances. The impactor is shown in green, traveling from left to right and the target is in white. From left to right, the semimajor axis of the target’s circumplanetary orbit corresponds to 1.31, 1.44 and
1.97 times the rigid-body Roche limit (RRRL).
Acknowledgments H.A. was supported by the French government, through the UCA J.E.D.I. Investments in the Future project managed by the National Research Agency (ANR) with the reference number ANR- 15-IDEX-01. P.M. acknowledges funding support from CNES.
References
Ballouz, R.-L. et al. ApJ 789, 158 (2014).
Ballouz, R.-L. et al. Planet. Space Sci. 107, 29–35 (2015).
Benz, W. & Asphaug, E. Icarus 142, 5–20 (1999).
Hyodo, R. & Ohtsuki, K. ApJ 787, 56 (2014).
Jutzi, M. Planetary and Space Science 107, 3–9 (2015).
Leinhardt, Z. M. & Stewart, S. T. ApJ 745, 79 (2012).
Raducan, S. D. et al. PSJ 5, 79 (2024).
Richardson, D. C. et al. Icarus 143, 45–59 (2000).
Schwartz, S. R., Richardson, D. C. & Michel, P. Granular Matter 14, 363–380 (2012).
Zhang, Y. et al. Icarus 294, 98–123 (2017).
How to cite: Agrusa, H. and Michel, P.: The influence of tides on catastrophic disruptions of close-in planetary satellites, Europlanet Science Congress 2024, Berlin, Germany, 8–13 Sep 2024, EPSC2024-524, https://doi.org/10.5194/epsc2024-524, 2024.
The hypothesis that the lunar core dynamo once generated a global magnetic field is widely accepted [1–2]. Paleomagnetic analysis of lunar samples shows that the lunar dynamo field operated from about 4.2 Ga to sometime between 1.92 and 0.8 Ga [3–5]. From the orbital observations, the strongest lunar magnetic crustal anomalies are found to concentrate on the lunar farside, and a prominent magnetic low correlates with the nearside Procellarum KREEP Terrane [6].
Impact cratering is a geological process that could either magnetize or demagnetize the lunar crust. Previous studies have investigated the magnetic signatures of impact basins hundreds of kilometers in size [7–9]. Among the largest multi-ring basins, only five Nectarian basins are unambiguously associated with central magnetic anomalies. For the smaller craters, previous studies have detected both magnetized [10] and demagnetized [11] signatures.
This study systematically analyzed the magnetic signatures of all lunar impact craters resolvable by the most recent magnetic field models. We used the locations and crater diameters from [12] which were based on optical images, and this database was supplemented by the peak-ring and multi-ring basins from [13] that were characterized using gravity data. We assigned the crater age using the updated version of the crater database of [14]. The surface magnetic field data from [15] was used as the primary model, and the model of [16] was then used to confirm the magnetic signature of the investigated crater.
The investigated craters in this study were classified into three classes: Magnetized (with central magnetic highs), demagnetized (with the magnetic low interior of the crater rim), and no signal (with no clear magnetic signal). The signal fidelity levels of the magnetized and demagnetized craters were further divided into three levels: Certain, probable, and possible. The two authors conducted the classification independently. To assess the likelihood of correct identification, we made use of two sets of synthetic magnetic field models generated by rotating the geographic coordinate system of the observed fields. We found more false identifications of magnetized craters than real observations when the crater diameter is smaller than 90 km. Therefore, we only report the results from the craters with diameters greater than 90 km.
In total, we analyzed 447 craters. Of these, only 26 and 42 were classified as magnetized and demagnetized craters by at least one of the analysts, respectively. If only considering the craters that both analysts agree upon, the numbers decrease to 10 and 30, respectively.
The debiased number of craters for a given classification was defined as the number of craters using the observed magnetic field models minus the number of craters using the synthetic maps in the given diameter or age class. For a few cases where the number of false identifications is larger than the number of using real detections, we simply set the debiased number as zero. The debiased percentage is simply the sum of the debiased numbers divided by the total number of craters in the given class.
In Figure 1, we plot the average debiased percentages of craters with impact-related magnetized and demagnetized signatures as a function of diameter and age. When only considering the certain and probable fidelity levels, about 1%, 3%, and 14% of the complex craters (90–206 km), peak-ring basins (206–582 km), and multi-ring basins (582–1321 km) are found to have magnetized and demagnetized signatures, respectively. When considering all three signal fidelity levels, the results show the same trend of increasing with increasing diameter but show a higher percentage.
In terms of crater age, when only considering the highest two fidelity levels, we find that about 2% and 3% of craters with pre-Nectarian and Nectarian ages show magnetized signatures, respectively. None of the younger Imbrian, Eratosthenian, or Copernican periods show evidence of craters with magnetized signatures. For the demagnetized class, we find that about 0.3%, 3%, and 16% of pre-Nectarian, Nectarian, and Imbrian aged craters show demagnetization signatures, respectively. These results are compatible with a lunar dynamo operating during at least portions of the pre-Nectarian and Nectarian periods, and then either weakening or ceasing at the beginning of the Imbrian period.
Fig 1. Average debiased percentages of the two analysts for craters with magnetized and demagnetized signatures as a function of (a) diameter and (b) age using the surface magnetic field models. The number above each bar shows the average number of craters in the interval from the two analysts after debiasing.
Lastly, we placed constraints on the mechanisms of generating impact-related magnetic signatures. The excavation of crustal materials and thermal demagnetization can account for the magnetic lows within the crater rim. Shock demagnetization might account for the magnetic lows that extend beyond the crater if an ambient core-generated field was absent when the crater formed. In contrast, the magnetized signatures are likely to be the result of the heated materials cooling in the presence of an ambient magnetic field. The reasons for only a small number of craters with magnetic signatures could potentially be a dynamo that was episodic, frequently reversing, or unstable in intensity and direction. Specific impact conditions (e.g., impact angle and the iron-metal content of the impacting projectile) could perhaps also be required for generating a magnetic signature.
Reference [1] Wieczorek M. et al. (2022) Lunar magnetism, [2] Weiss B. and Tikoo S. (2014), Science, 346, [3] Garrick-Bethell, I. et al. (2009) Science 323, 356–359, [4] Garrick-Bethell, I. et al. (2017) JGR-Planets, 122, 76–93, [5] Mighani S. et al. (2020) Sci. Adv., 6, [6] Wieczorek M. (2018) JGR-Planets, 123, 291–316, [7] Halekas J. et al. (2003) Meteorit. Planet. Sci. 38, 565–578, [8] Hood L. (2011) Icarus, 211, 1109–1128, [9] Oliveira J. et al. (2017) JGR-Planets, 122, 2429–2444, [10] Halekas J. et al. (2002) GRL, 29, 23-1, [11] Arkani-Hamed J. and Boutin D. (2014) Icarus, 237, 262–277, [12] Robbins S. J. (2019) JGR-Planets, 124, 871–892, [13] Neumann G. (2015) Sci. Adv. 1, e1500852, [14] Losiak, A. et al. (2015) LPI crater database, [15] Tsunakawa H. et al. (2015) JGR-Planets, 120, 1160–1185, [16] Ravat D. et al. (2020) JGR- Planets, 125.
How to cite: Yang, X. and Wieczorek, M.: Magnetic signatures of lunar impact craters, Europlanet Science Congress 2024, Berlin, Germany, 8–13 Sep 2024, EPSC2024-229, https://doi.org/10.5194/epsc2024-229, 2024.
Introduction: The detection of water on the lunar surface by spacecraft flybys and ground observations has raised questions about its origins. While solar wind is likely an important source of H, leading to H2O and -OH formation, other external processes such as interplanetary dust implantation, micrometeoroid impacts, and dielectric breakdown may also be important in the formation of water molecules. Whilst laboratory observations and studies are informative, they only report end result data, without providing a complete insight on the evolution of the surface composition. In addition, macroscopic simulation models using laboratory equipment are unable to simultaneously resolve chemical reactions at the atomic scale during collisions. In order to better understand water formation and retention, studies at the atomistic level need to be conducted. Molecular dynamics (MD) simulations can capture atomic bonds and molecule formation during different processes, allowing for studies of the atomistic processes underlying water production.
Huang et al. [1], used MD to study water production and retention after a micrometeoroid impact for near surface hydrogen implantation. Their simulations used a reactive force field (ReaxFF) in order to capture bond breaking and formation of H2O molecules while testing different impact velocities for a 6nm impactor. Their results showed that the optimum velocity water production was 16 km/s while they also noted that even at the nanoscale molecules can still reach the Moons exosphere. Their work was limited to hydrogen at the surface only, focusing on water production during normal micrometeoroid impacts. However, the majority of solar wind protons are distributed throughout the substrate rather than concentrated at the near surface according to the site location on the Moon. Research is needed on the role of implantation depth and incidence angle on the water formation behavior during micrometeoroid impacts. Thus, in this study, we consider water formation and retention during micrometeoroid impacts for different realistic hydrogen implantation depth cases in a silica substrate. Using atomistic modelling we also examine the effect of different micrometeoroid sizes at normal and 30o incident angles on water production and retention.
Methodology: We conducted MD simulations of micrometeoroid impacts on the lunar surface to better understand the underlying physics of water formation, retention. We used a reactive force field (ReaxFF) potential, originally parameterized to describe a silica-water system and previously used in micrometeoroid and H diffusion simulations in amorphous SiO2 [1]-[4].
First, a 433 × 433 × 290 Å3 substrate with a free surface is created, representing a part of the outer surface of a lunar grain. Hydrogen atoms were then placed according to two different depth distribution cases. A near surface distribution is created by placing ~30000 H atom at the surface only and then impacting. A distribution with depth was created by running separate binary collision approximations following best practices for SW impacts [5] and then depositing H in the MD substrate according to these results. Micrometeoroids of 6nm and 9nm in diameter were simulated at velocities ranging from 12-20 km/s and at normal and 30o degrees angles of incidence.
Results: MD simulations showed that water generation during a micrometeoroid impact is highly dependent on impact velocity, incident angle, and initial depth distribution of H. In the majority of cases there was an increase in H2O generation with impactor velocity. Interestingly, when the hydrogen is distributed throughout the depth (as opposed to at the near surface) there is a difference in both H2O production rate and retention. For example, for a 9 nm impactor at 30 degrees there was in increase in retained water by 20% when H was distributed according to SW impacts. In contrast, for this same impactor there was a distinct drop in retained water by 24% when H was deposited at the surface only. We also observe more H2O ejecta when compared to the distributed H cases. Therefore, whether micrometeorites lead to the formation or loss of H2O strongly depends on the initial deposition profile of the implanted H. In addition, other ejected atoms and molecules such as H, H2 and -OH leave the substrate during impact, these ejecta can potentially contribute to the lunar exosphere or be redistributed at nearby sites.
Results also indicate a dependence on the impact energy in the normal direction for the different cases simulated. For example, a 6nm micrometeoroid at 20 km/s and normal impact angle exhibits similar distribution behavior as a 9nm micrometeoroid at 12 km/s and normal impact angle. This indicates a dependence in impact energy as the two cases have close energies of 5 x 10-14 J and 5.8 x 10⁻¹⁴ J respectively. In addition, a decrease from initial concentration was observed at the near surface of the substrate, 0 - 40 Å in depth. This is likely due to the high impact energy experienced at the surface that raises the local temperature, breaking the chemical bonds of the surface water. Results point to the importance of considering both the impactor behavior (velocity/size/angle) along with the initial hydrogen deposition when studying water production. Those areas on the Moon which are directly exposed to SW and thus have H deposited at depth are more likely to retain produced water.
References:
[1] Huang, Z. et al. (2021), Geophysical Research 142 Letters, 48(15)
[2] Fogarty, J. C. et al., (2010) Journal of Chemical Physics Vol 132, Issue 17, p. 174704
[3] Morrissey, L. S. et al., (2022) Icarus Vol 379, p. 114979
[4] Sheikholeslam, S. A. et al., (2016) J Mater Chem C Mater Vol 4, Issue 34, pp. 8104–8110
[5] Morrissey L. S. et al. (2023) Planet. Sci. J. 4 67
How to cite: Georgiou, A., Huang, Z., Verkercke, S., Lewis, J., and Morrissey, L.: Water Formation During Micrometeoroid Impact on the Lunar Surface: A Molecular Dynamics Study, Europlanet Science Congress 2024, Berlin, Germany, 8–13 Sep 2024, EPSC2024-673, https://doi.org/10.5194/epsc2024-673, 2024.
Introduction
Impacts are one of the most destructive processes in the solar system, and impact craters have been identified on almost every type of solar system body. The lunar surface is covered in craters ranging from 2500 km in diameter, down to sub-millimetre scale. Lunar impact flashes (LIF) are caused by incandescence during an impact, and can be observed by ground based telescopes. Over 650 LIFs have been observed within literature [1,2,3], but despite this large volume of data, only 3 freshly formed craters with documented LIF have been located previous to this work. Such craters are important, as they serve as ground truth data for both the refinement of the luminous efficiency, η, typically taken as between 10-2 and 10-4, and for analysing which crater scaling law is most accurate at the scale of the observed craters.
Method
PyNAPLE is software we developed to locate the resultant crater within Lunar epoch, of an observed LIF [4]. Using the >650 LIFs available in literature, we applied constraints to filter out the unconfirmed events, and to prioritise the higher energy events, which had the highest probability of being detected with PyNAPLE. In total, this left 22 LIFs to be processed with PyNAPLE.
Results
After processing the 22 LIF events, there were sufficient LROC images to locate the freshly formed craters for six new events, as well as the three already identified within literature[4,5,6]. For one of these events, two candidate craters were found. Additionally, two unlinked craters were located during the search, however comparing the formation window of these craters to the database of LIFs, no candidate formation events were identified. A selection of six of these craters is shown in Fig. 1.
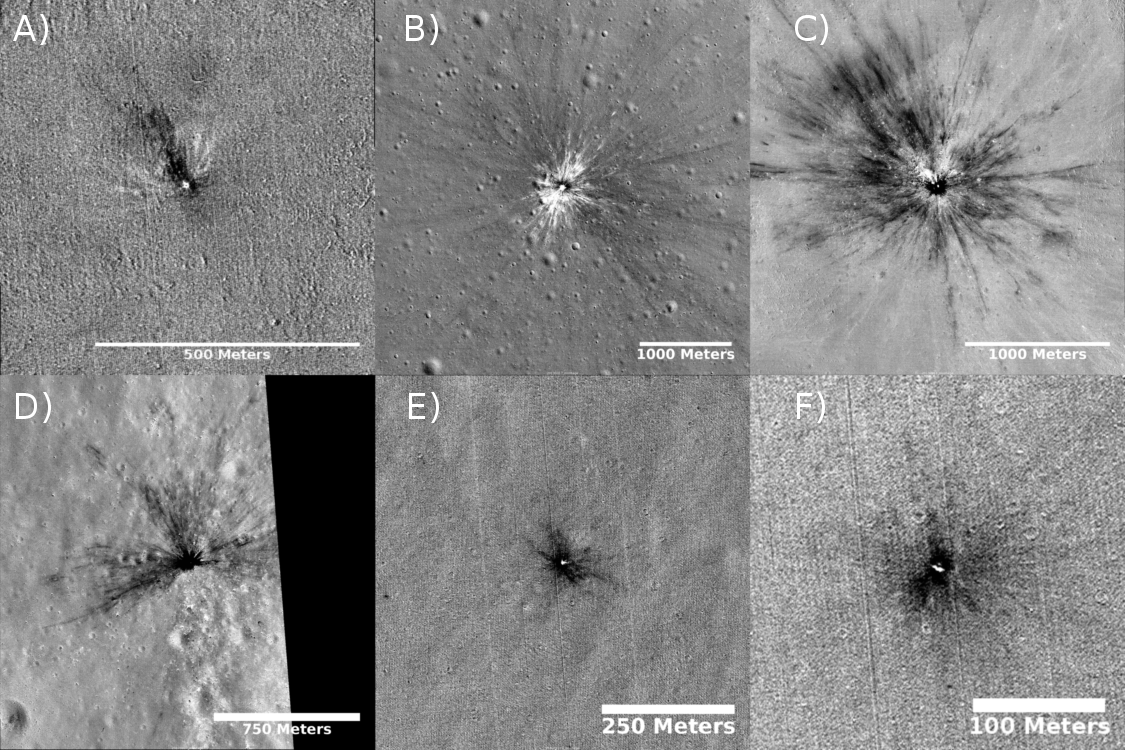
Figure 1: Six of the craters located from LIF observations by PyNAPLE.
Analysis & Discussion
For each of the 9 craters with known formation event, the likely parent meteoroid stream for each event can be obtained by comparing the LIF location to the meteoroid streams that were active and visible to the impacting location at the time of impact. Identification of the parent stream gives an approximate value for the impactors velocity, impacting angle, and projectile density.
Using the calibrated brightness of each flash, a value for the luminous energy, Elum, can be obtained for each event. Using an estimate for η, the total kinetic energy of the impactor for each event can also be caluculated, KE = Elum / η.
The crater scaling laws are several equations which all attempt to relate the kinetic energy of an impactor to the rim-to-rim diameter of the formed crater. As they were mostly derived from explosive tests, their accuracy at the <100m scale of these craters is unknown. Using two of the found craters, which share a parent meteoroid stream and therefore share similar properties, we can evaluate the accuracy of the most popular scaling laws, as shown in Fig. 2. From this comparison, as Shoemaker & Wolfe [7] most closely fits the data, we can conclude it is the most accurate at this range. This equation does not exactly fit, however, and while there are several factors that could contribute to this, such as the estimates for projectile density,target density, impactor velocity, and angle, the single most likely factor is the poorly constrained luminous efficiency.
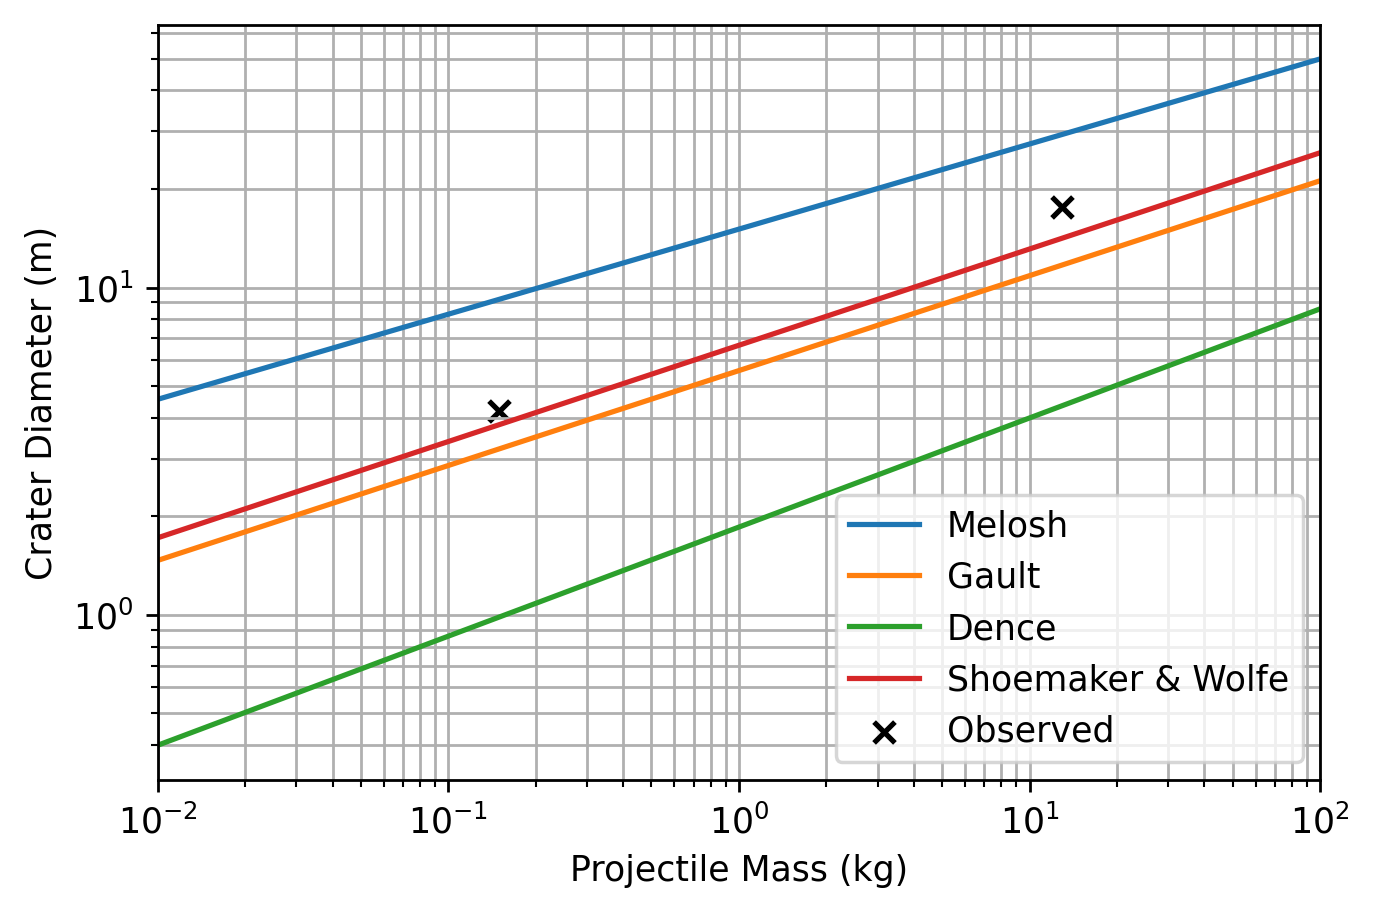
Figure 2: The comparison of four popular scaling laws, using two of the located craters with same parent meteoroid stream as ground truth.
Under this assumption, a more accurate value for the luminous efficiency can be calculated from the observed craters. This can be done using a rearrangement of the crater scaling laws, to work out the required KE for the observed crater diameter, and subsequently using the observed luminous energy of the impact flash to calculate η = Elum / KE.
Performing this for each LIF linked impact crater, after outlier removal, produces an average value of η = 0.017. While this is slightly larger than the typically used values of between 10-2 and 10-4, the difference is close enough that this could be the result of small inaccuracies in the other parameters used, such as impact velocity, or projectile density. The inaccuary of the scaling law used would also effect this value; as more LIF-linked craters are obtained, and a greater statistical dataset is formed, a re-evaluation of the crater scaling laws, and possibly the derrivation of a new equation, is necessary for this work.
Bibliography
[1] Xilouris et al. (2018) A&A 619, A141 [2] Madiedo et al. (2015) Planetary and Space Science, 111, 105 [3] Suggs et al. (2014) Icarus, 238, 23 [4] Sheward et al. (2022). MNRAS, 514(3):4320–4328 [5] Robinson et al. (2015) Icarus , 252, 229 [6] Robinson, M., (2014) Another New Crater! Webpage: http://lroc.sese.asu.edu/posts/810 [7] Shoemaker & Wolfe (1982) Satellites of Jupiter, 277–339
How to cite: Sheward, D., Avdellidou, C., Delbo, M., and Cook, A.: The Resultant Craters from Lunar Impact Flashes, Europlanet Science Congress 2024, Berlin, Germany, 8–13 Sep 2024, EPSC2024-782, https://doi.org/10.5194/epsc2024-782, 2024.
Introduction: Fragmentation of rocky surfaces upon meteor impacts often generates fields of boulders around impact craters. Ejected boulders sometimes possess sufficient kinetic energy to create secondary craters, increasing overall crater density and introducing biases when estimating crater retention ages. Characterizing the kinetic energy of ejected boulders is required to correct such biases in age determinations [1]. However, the vast number of resolvable boulders around single impact craters has rendered morphometric studies of impact-generated boulders challenging. As a result, few boulder fields have been studied [2–11], impeding systematic analyses of the role of, e.g., impactor energy and target properties on spalled boulder properties. To enable more extensive analyses of boulder morphometrics, we developed BoulderNet [12], a machine learning-based algorithm that automatically detects the boulder outlines and characterizes their morphometrics from high-resolution satellite images. Here, we use BoulderNet around over 40 young and fresh impact structures on the lunar surface (i.e., without visible degradation) to better understand the role of the impactor energy and target properties in the boulder ejection process.
Methods: A couple of improvements to the previously published version of BoulderNet [12] were implemented. First, the model architecture was modified from Mask R-CNN [13] to YOLOv8 [14], leading to refined outline detections (thanks to the anchor-free nature of YOLOv8). Second, boulders around lunar cold spots and fresh impact craters (directly relevant to this study) were added to the training dataset. Overall, these changes resulted in the detection of smaller boulder sizes and an increase in recall and precision for most boulder sizes.
This updated version of BoulderNet was then used to investigate the youngest and freshest impact craters on the lunar surface - the so-called cold spots [15]. Cold spots smaller than 400 m in diameter were excluded from this study because most of their associated boulders are close to or below the limit of resolution of LRO NAC images [16]. A total of 42 cold spots were studied - 5 located in mare, 36 in highlands, and one on the floor of a larger impact crater - with diameters ranging from 420 to 2300 m. Boulder outlines were automatically detected within 1–4 radii away from the crater center. Boulder morphometrics (size, aspect ratio, orientation, spatial density, and location) were then automatically extracted and analyzed.
Fragmentation of rocky materials generates fragment-size populations that roughly follow a power-law distribution, N(>D)=C.D-β, where N is the cumulative number of fragments with diameter > D, and β and C are constants. The slope parameter, β, varies with fragmentation process and history [3]. To further compare boulder populations around cold spots, we fit such a power law for each cold spot (including boulders with diameters greater than 2–4 m depending on image resolution).
Results: As expected, more boulders are generated around larger impacts (Fig. 1). Furthermore, preliminary results suggest that the slope parameter, β, spans a wider range of values for smaller crater diameters (< 1000 m; β ~ -2.5 to -7.0), but clusters around -2.5 to -3.5 for larger craters (Fig. 2). Surprisingly, the correlation between the size of the largest boulders generated by a given impact and crater size is relatively weak (Fig. 3), especially in lunar highlands.
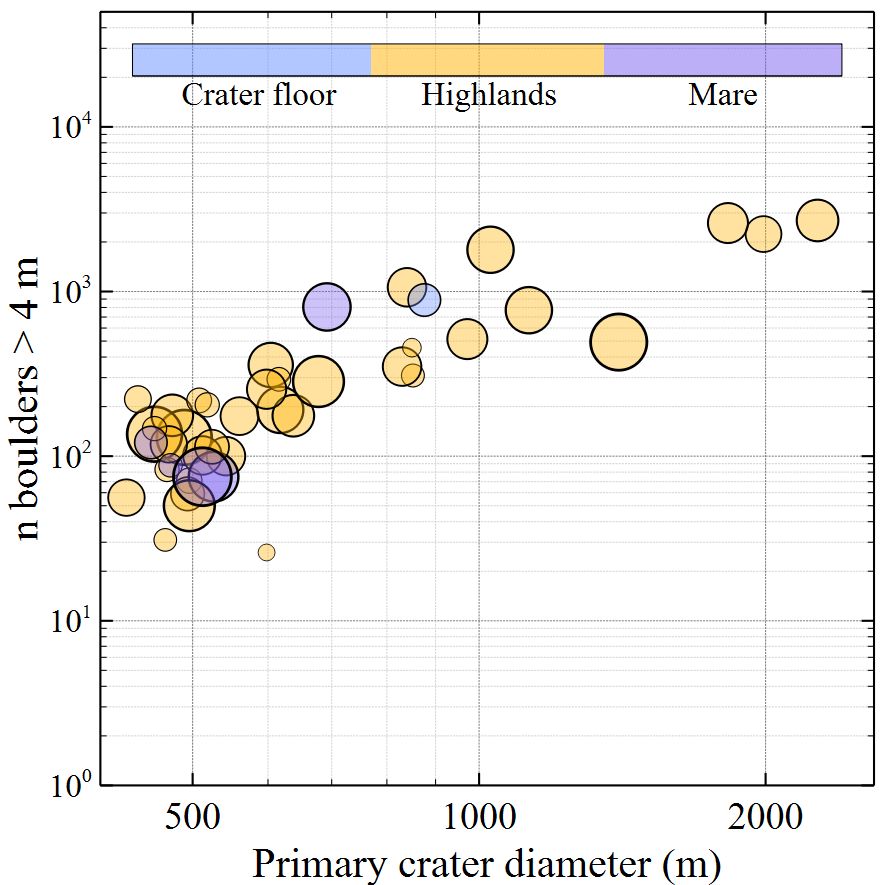
Fig 1. Number of boulders larger than 4 m as a function of primary crater diameter. Only boulders within 1 radius away from the crater rim are selected. Colors reflect terrain type. Symbol size reflects the resolution of NAC images from which detections were made (larger circle = coarser resolution).
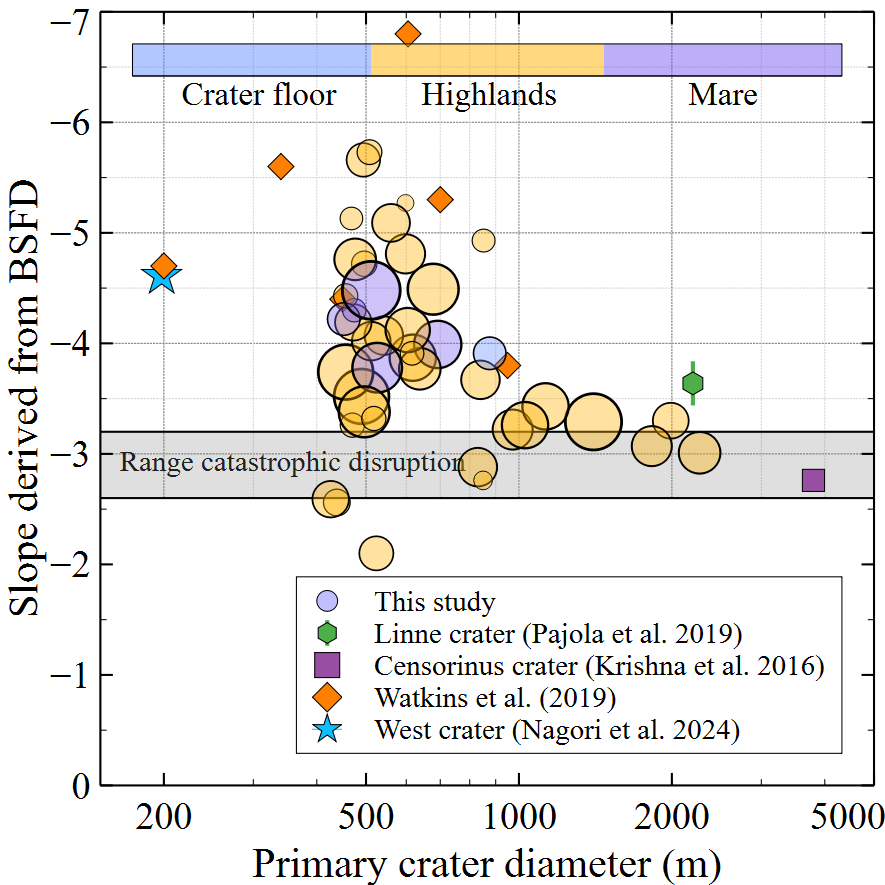
Fig 2. Slope parameter, β, of boulder populations around lunar cold spots as a function of primary crater diameter. Results from other studies are also shown for comparison. The range of catastrophic disruption for asteroid collisions is highlighted in gray.
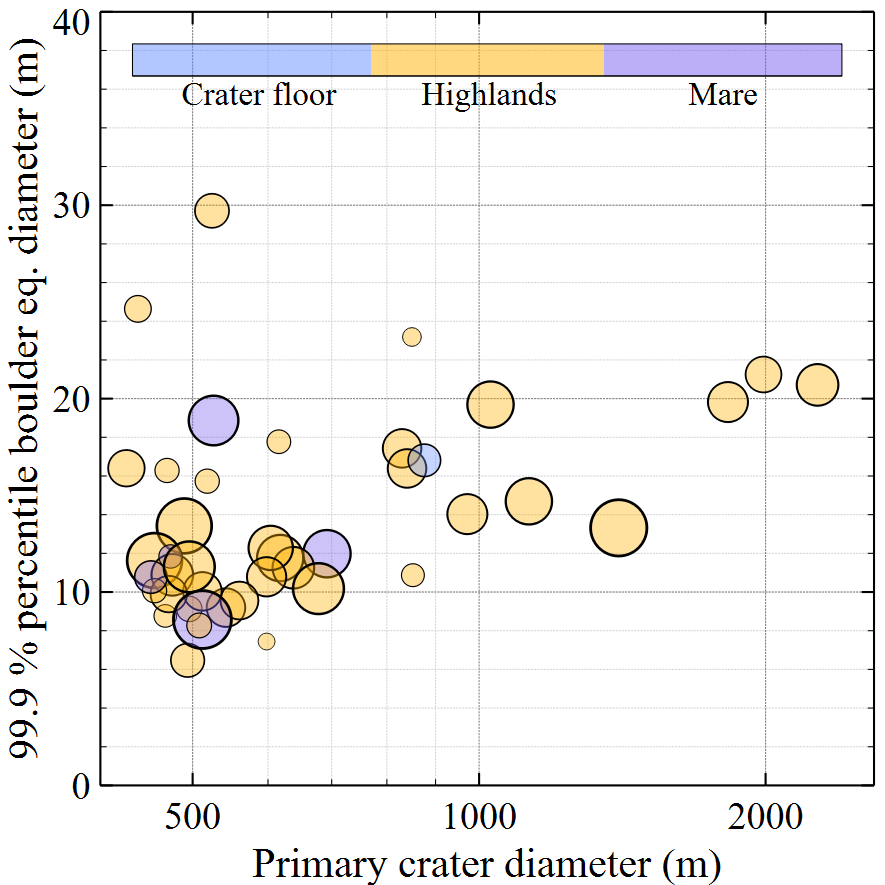
Fig 3. 99.9th percentile of equivalent boulder diameter as a function of primary crater diameter.
Discussion and Conclusions: The general absence of correlation between the size of the largest boulders generated by a given impact and crater size hints at the importance of fragmentation history and the likely presence of pervasive fractures in the lunar crust, especially in highlands. This interpretation is possibly corroborated by our observation of larger variations in β for lunar craters smaller than a kilometer in diameter, which could be explained by more heterogeneous crustal materials in the first tenths of meters. We emphasize that the role of target lithology (mare vs. highlands) is difficult to assess due to the relatively small number of very fresh impact craters therein. To address this caveat, we will analyze boulders around fresh martian craters in similarly young lava flows.
References:
[1] Melosh (1984) Icarus 59.
[2] Shoemaker (1965) JPL Tech. Rept.
[3] Hartmann (1969) Icarus 10.
[4] Vickery (1986) Icarus 67.
[5] Bart & Melosh (2010) Icarus 209.
[6] Krishna et al. (2016) Icarus 264.
[7] Pajola et al. (2017) Icarus 296.
[8] Pajola et al. (2019) PSS 165.
[9] Watkins et al. (2019) JGR Planets 124.
[10] Pajola et al. (2021) Universe 7, 82.
[11] Mistick et al. (2022) Icarus 376.
[12] Prieur et al. 2023, JGR Planets 128.
[13] He et al. arXiv:1703.06870.
[14] Ultralytics: YOLOv8 (2024), https://github.com/ultralytics/ultralytics.
[15] Williams et al. (2018) JGR Planets 123.
[16] Robinson et al. (2010) Space Sc. Rev. 150.
How to cite: Prieur, N. C., Xiao, Z., Kerner, H., Werner, S., and Lapôtre, M.: Systematic Analysis of Boulder Populations around Lunar Cold Spots, Europlanet Science Congress 2024, Berlin, Germany, 8–13 Sep 2024, EPSC2024-1252, https://doi.org/10.5194/epsc2024-1252, 2024.
Introduction
The contribution of secondary craters to the size-frequency distribution of impact craters on planetary surfaces has been debated controversially [1-3], in particular as they have the potential to affect the dating of planetary surfaces via crater counting. The identification of secondary craters is straightforward in proximity to the source crater. Fragments impacting near the primary crater have relatively low velocities and produce irregular and non-circular shaped craters that are shallower than fresh primaries [4]. Here we present the first field of secondary craters found on Earth that allows to study secondary crater formation in detail.
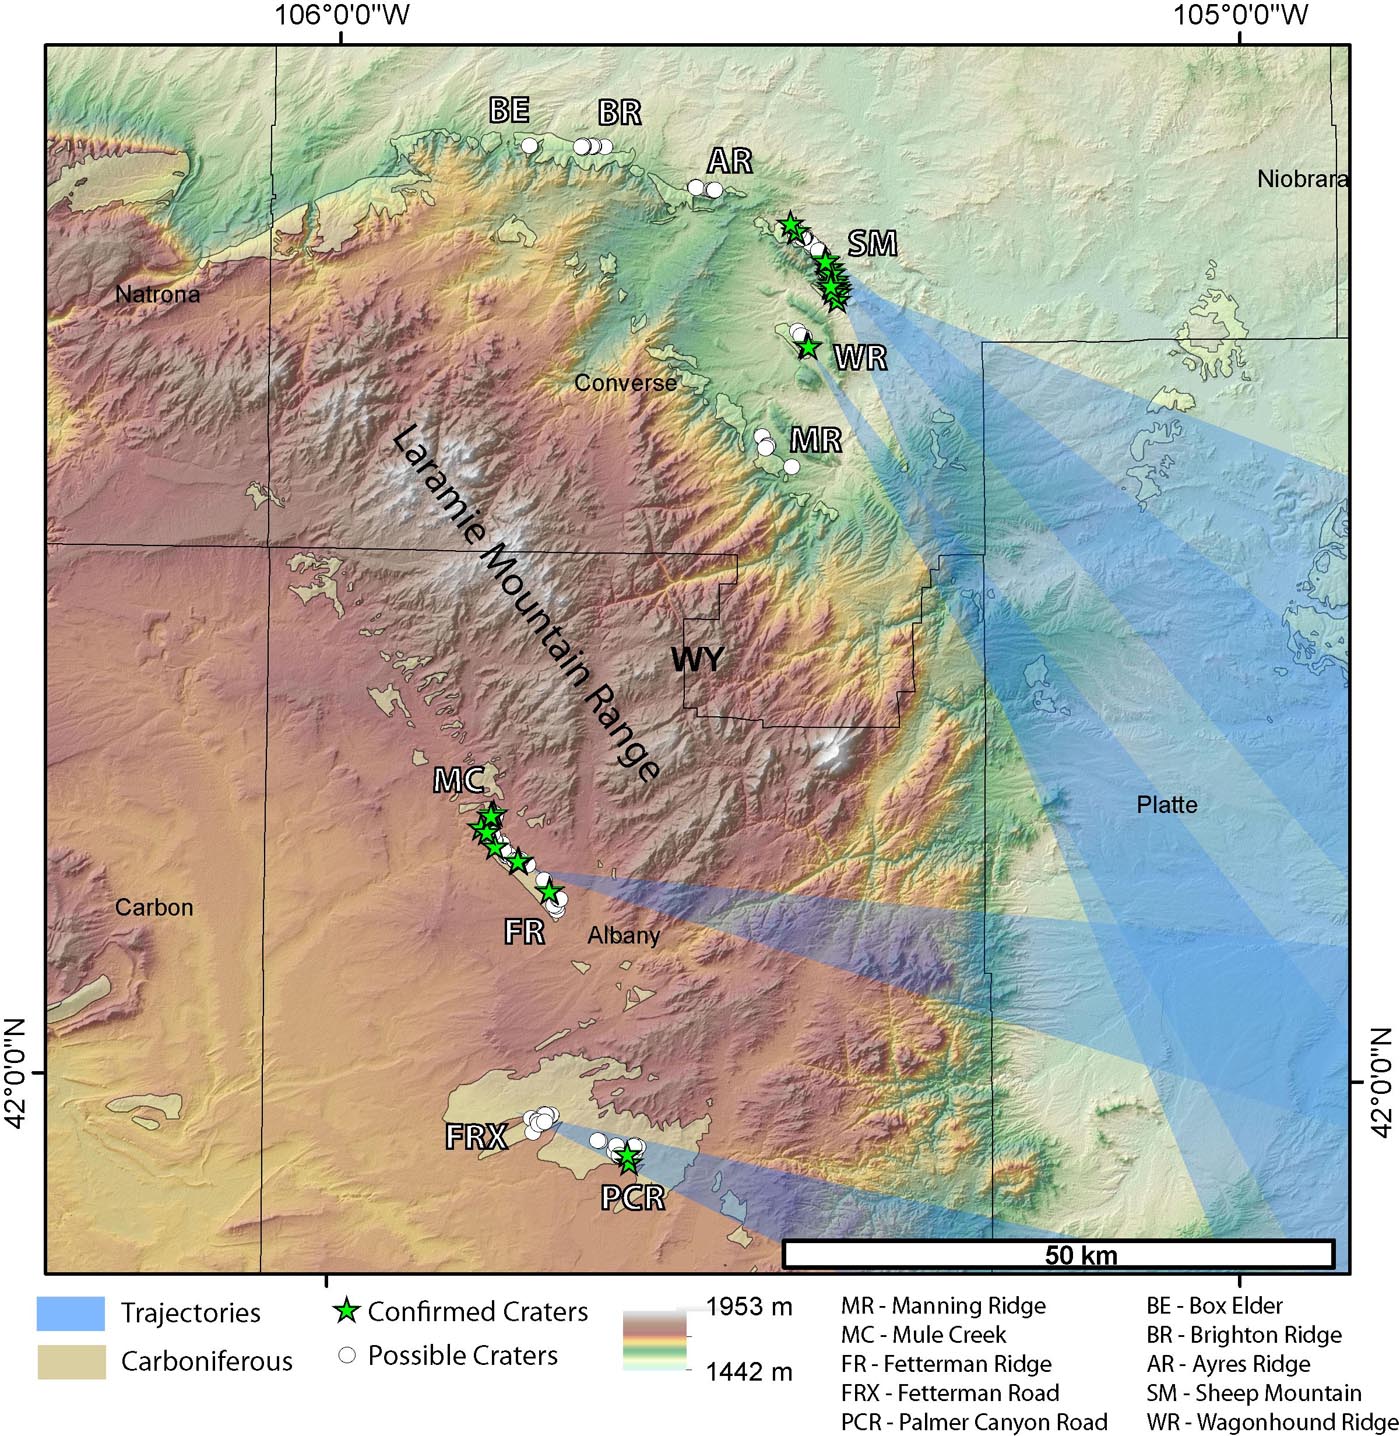
Fig.1 DEM map of southeastern Wyoming, USA, showing the locations of the secondary craters and the trajectory fans.
The secondary crater field in Wyoming
In 2018 a field of small impact structures was discovered in Wyoming in tilted Permian strata of the Rocky Mountains Front Range system [5] (Fig. 1). The confirmation of the impact origin of these craters was based on the documentation of shock features in quartz grains. At first, [5] interpreted this cluster of craters as a crater strewn field that was formed by the atmospheric fragmentation of a single meteoroid. The maximum theoretical spreading of such strewn fields is restricted and should not exceed more than one kilometer perpendicular to the trajectory [6]. Since the discovery of the first craters, additional craters have been identified in the same strata in an area that measures 90 by 40 km (Fig.1) [8] and excludes a meteoroid-break-up scenario. Instead it was shown that the craters represent secondary craters.
Secondary crater morphologies and trajectory reconstruction
The diameters of the 31 confirmed and 188 potential crater structures range in size from 10 m to almost 80 m. Many craters are circular, but their ellipticity can reach up to 1.7 (Fig. 2). All craters are exposed at the same stratigraphic level so are assumed to be of equivalent, 280 Myr age. The freshest structures contain steep crater walls, raised rims with overturned ejecta flaps and remains of the proximal ejecta blankets. Estimates of depth-diameter ratios are 0.1 and less. We observe irregular crater clusters and crater chains, where craters overlap [7]. Occasionally relics of herringbone patterns were observed (Fig. 2). We used the orientation of the long axis of elliptical craters and the crater chain alignments for trajectory reconstruction. Criteria for up-range and downrange distinction included overturned ejecta flap downrange and V-shaped herringbone patterns (Fig. 2). The craters define fan-like corridors of trajectories for each crater field (Fig. 1). Tracing back the trajectories allowed the location of the primary crater to be estimated in the area of the intersection of the corridors, centered at 41°28’N and 103°59’W [7]. All discovered secondary craters occur at a distance of 150+/-50 km to the proposed primary crater. We calculated the ballistic paths of ejecta taking into account aerodynamic drag. Trajectories of ejecta with 1, 2 and 4 m radius were modeled with ejection angles ranging from 30 to 60 degrees and initial speeds of 1, 2 and 4 km/s. Modeling showed that the impacts occurred at around 700-1000 m/s with impact energies of about 12 to 400 GJ. Such impacts are capable of generating craters of 8–55 m in diameter and may generate small volumes, where shock pressures are sufficient to form shock microstructures in quartz [7].
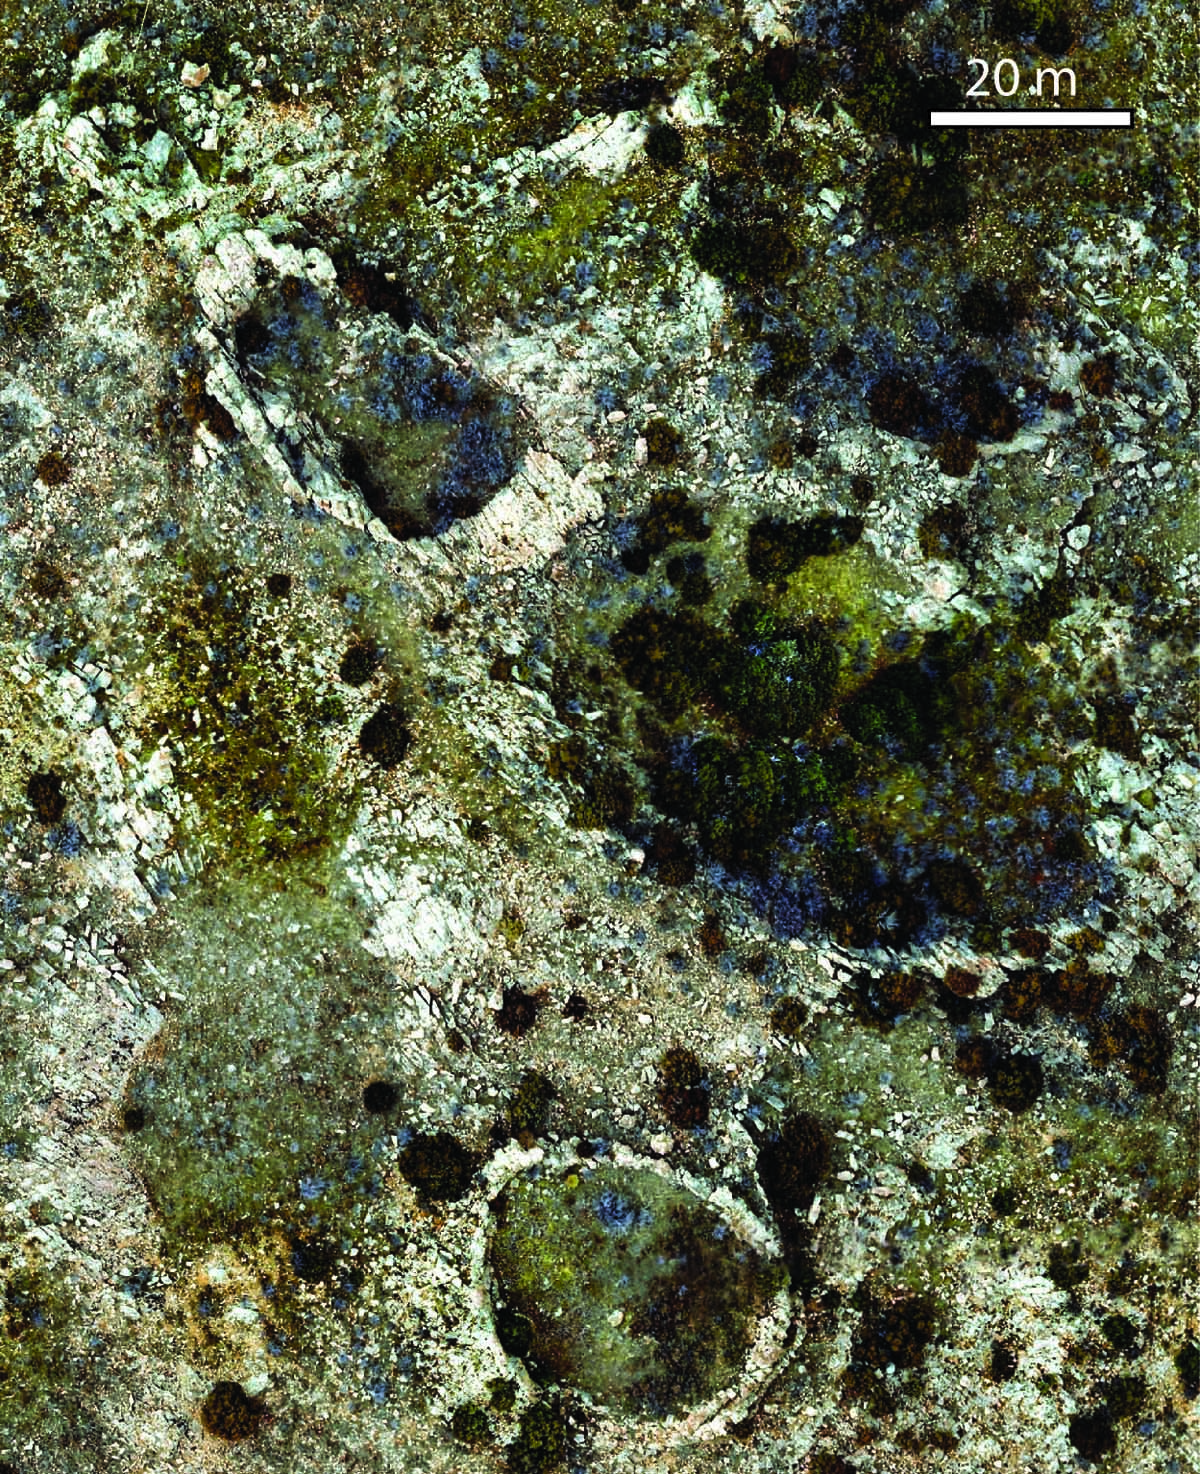
Fig.2 Drone image of a the southern part of the Sheep Mountain secondary crater field.
The primary crater
The possible location of the primary crater is situated in the Northern Denver basin, where 280 Myr old strata are deeply buried beneath younger beds. Ejecta scaling suggests that the primary crater may have a diameter of 50-65 km. We will analyze newly released high-resolution Bouguer gravity data to constrain location and size of the possible crater. The borehole I-35 Hawk Fee, situated in the area of interest, shows some breccia layers at 3023-3066 m depth at the respective stratigraphic level, but shock features could not unequivocally found until now.
A chain of primary craters in Wyoming?
Recently, a new impact structure has been discovered in the Bighorn Basin of NW Wyoming, named Jake Seller Draw impact structure [8] some 300 km NW of the secondary crater field. The 4.3-km-diameter structure was recognized as a seismic disturbance at a depth of ∼6.5 km making it the most deeply buried impact structure known on Earth to date. Shock features were detected from boreholes drilled into the center of the structure and its ejecta. Seismo-stratigraphy and drilling showed that the crater also formed 280 m.y. ago. The coincident stratigraphic age of the Jake Seller Draw impact structure with the ages of the Wyoming crater field, its SE-NW alignment with the fan of secondary craters and the proposed source crater of the Wyoming crater field, suggest a causal relationship between the Jake Seller Draw structure and the Wyoming crater field [8]. In addition to that, the buried 7 km diameter Cloud Creek impact crater [9] lies exactly on the same trajectory some 110 km NW of the secondary crater field (Fig.3). Its published age apparently rules out a connection to the other craters, but in a personal communication with the first author of [9], the age of Cloud Creek was presented as not robust. We propose that the Wyoming impact event comprised of three asteroids and impacted the Earth along a SE to NW impact trajectory. The largest of the primary craters formed the secondary crater field that is preserved in downrange direction.
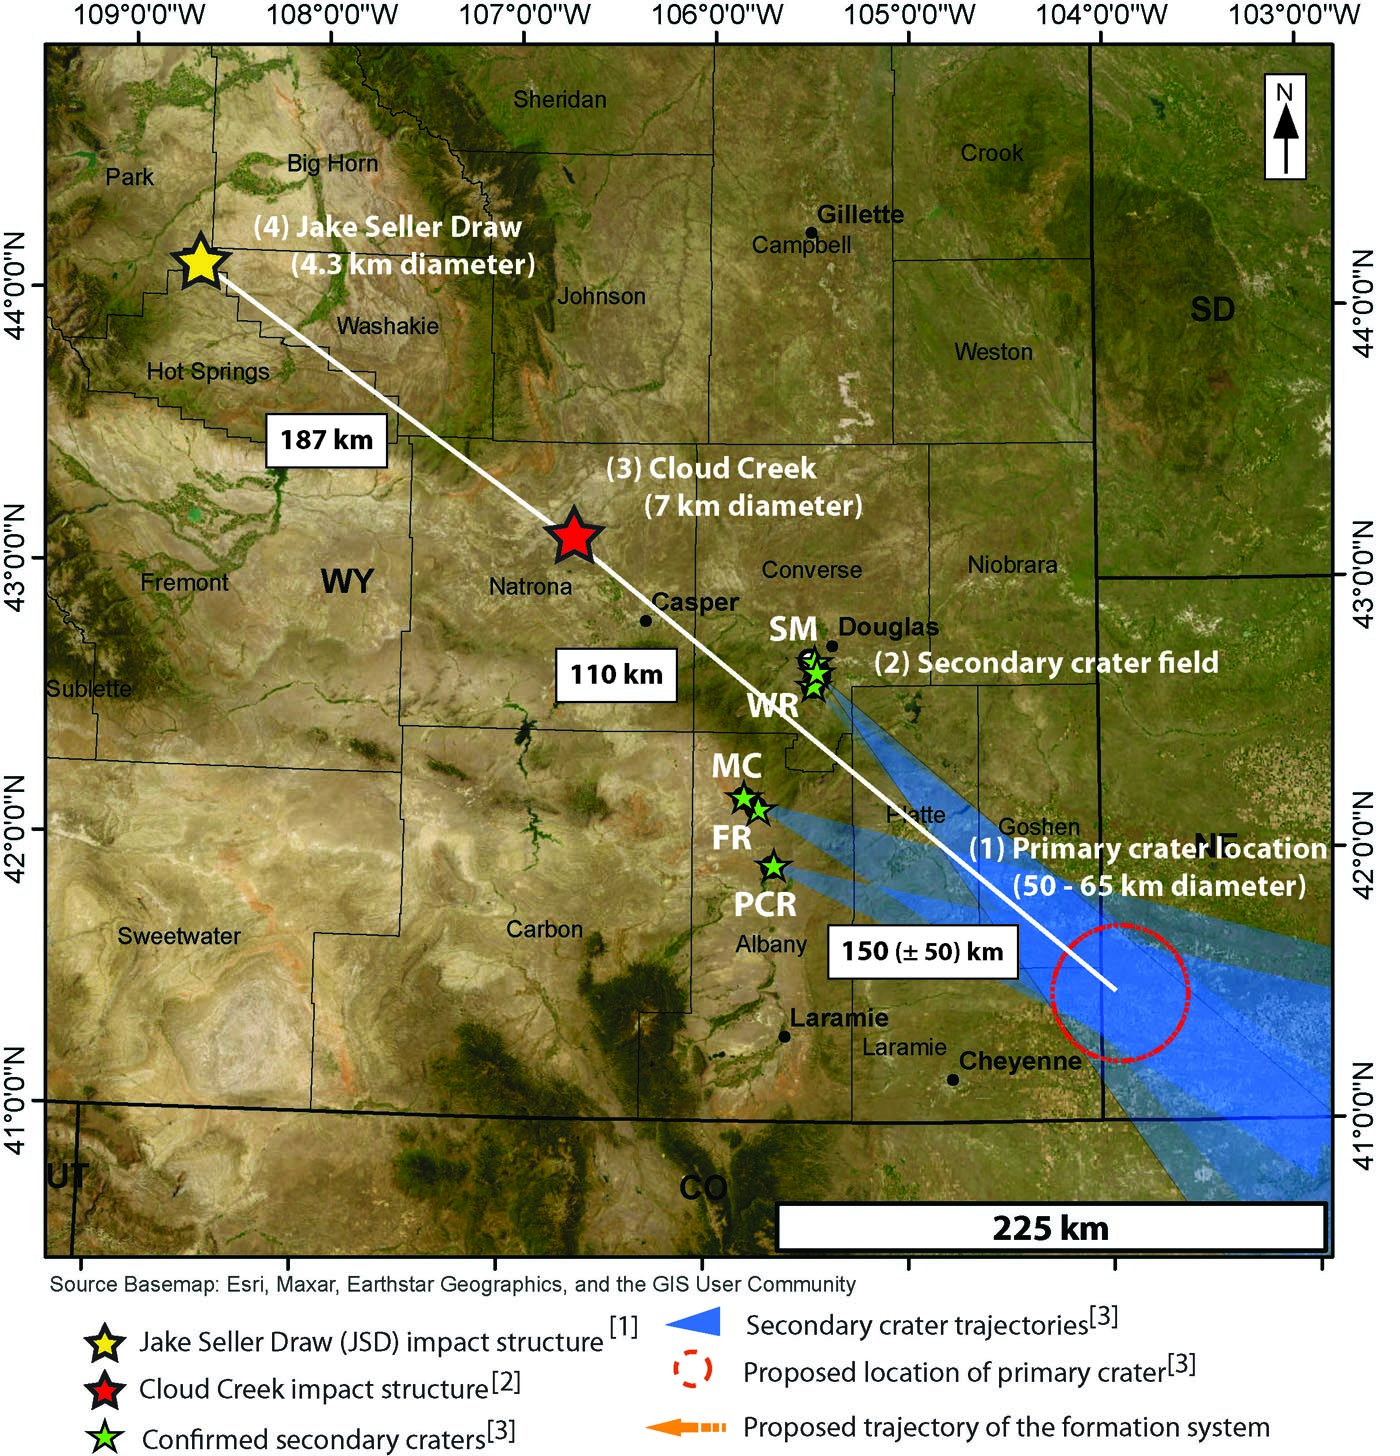
Fig. 3 Map of the primary and secondary impact structures in Wyoming
References
[1] Ivanov,B.A. 2006, Icarus, 183, 504–507. [2] McEwen,A.S. & Bierhaus,E.B. 2006, AREPS, 34, 535–567. [3] Zanetti,M. et al. 2017, Icarus, 298, 64–77. [4] Pike, R.J. & Wilhelms, D.E. 1978, Proceedings, LPSC 9, 907–909. [5] Kenkmann, T. et al. 2018, Scientific Reports, 8, 13246. [6] Artemieva,N.A. & Shuvalov,V.V. 2001, JGR 106, 3297–3309. [7] Kenkmann,T., et al. 2022, GSA Bull. https://doi.org/10.1130/B36196.1. [8] Sturm,S., et al. 2024, GSA Bull. https://doi.org/10.1130/B37164.1. [9] Stone,D.S. & Therriault,A.M. 2003, MAPS, 38, 445–455.
How to cite: Kenkmann, T., Sturm, S., Müller, L., Fraser, A., Cook, D., Sundell, K., and Rae, A. S. P.: Secondary cratering: a case study on Earth , Europlanet Science Congress 2024, Berlin, Germany, 8–13 Sep 2024, EPSC2024-1067, https://doi.org/10.5194/epsc2024-1067, 2024.
Introduction: Reconstruction of paleoenvironments, especially aquatic, is important in search for potential Life habitats, e.g. on Mars. Remote sensing, preferably combined with rovers, give information on telltale geochemistry and landforms. However, this may be hampered by extensive surface erosion. Impact craters offer efficient sediment traps relatively protected from erosion. In aquatic (“marine”) environments, water may rush back into the crater during early modification generating “resurge deposits” [1]. Resurge deposits in drill cores from several impact craters show a direct relation between average clast frequency per meter (‹N›), event magnitude (i.e., projectile diameter, d) and target water depth (H) as ‹N›=-15(d/H) +100 for a “low” (e.g. moat) location, or ‹N›=-13(d/H) +150 for a “high”, more turbulent position (e.g., near rim) [2;3]. This implies that any of these factors can be calculated if the other two are known. This was applied on Rochechouart impact structure that was debated if marine-target or not due to lack of marine sediments in the area [4]. Here, we study drill cores from the interior of the today burried Decorah crater, Iowa (43°18′ 49″N, 91°46′19″W), to learn more about its paleoenvironment.
The 5.6km Decorah crater seemingly lacks a central uplift expected for its size and target, and is suggested to be marine-target [5]. Target rocks were Upper Cambrian and Lower Ordovician sandstones and dolomite [5;6]. Earliest post-impact infill by marine Winneshiek Shale places the impact in Darriwilian[7]. Decorah is extensively drilled, but only two yielded cores useful for this study; the ~33m “H2” core (0.32km inside the eastern rim), and the ~28m “CS1” core (approx. halfway between south-western rim and crater center) [cf. 5].
Methods: We log the polymict breccias of the 5cm in diameter H2 and CS1 cores as their observed grading [5] suggests resurge deposits [cf. 1]. At the time of writing, only H2 is fully logged and interpreted. CS1 will be presented at the conference. The logged section of H2 spans 9.6m from the bottom of the core until the clasts sizes become to small (<5mm) for the method, i.e., the line-logging technique previously used for Lockne, Tvären, Chesapeake Bay, Wetumpka, Flynn Creek, Chicxulub, and Rochechouart [cf 1;4;8;9;10;11]. For most of these craters it was possible to work directly on the cores, but here we have, similarly to the Chicxulub study [8], used digital core photos and the software JMicroVision 1.2.7. The core recovery in the logged intervals of H2 and CS1 was >98%. Size sorting calculates as the standard deviation of the clast size per length unit (here half a meter). Roundness is estimated with a grain shape comparator [cf. 12]. Matrix- or clast support of each clast is based on contact with adjacent clasts and plotted as a ratio per length unit. Alltogether, plotted values show relative variations indicating trends, not absolute values. In addition, clast colors and textures were noted to enable an association with the target stratigraphy [e.g., 4; 8]
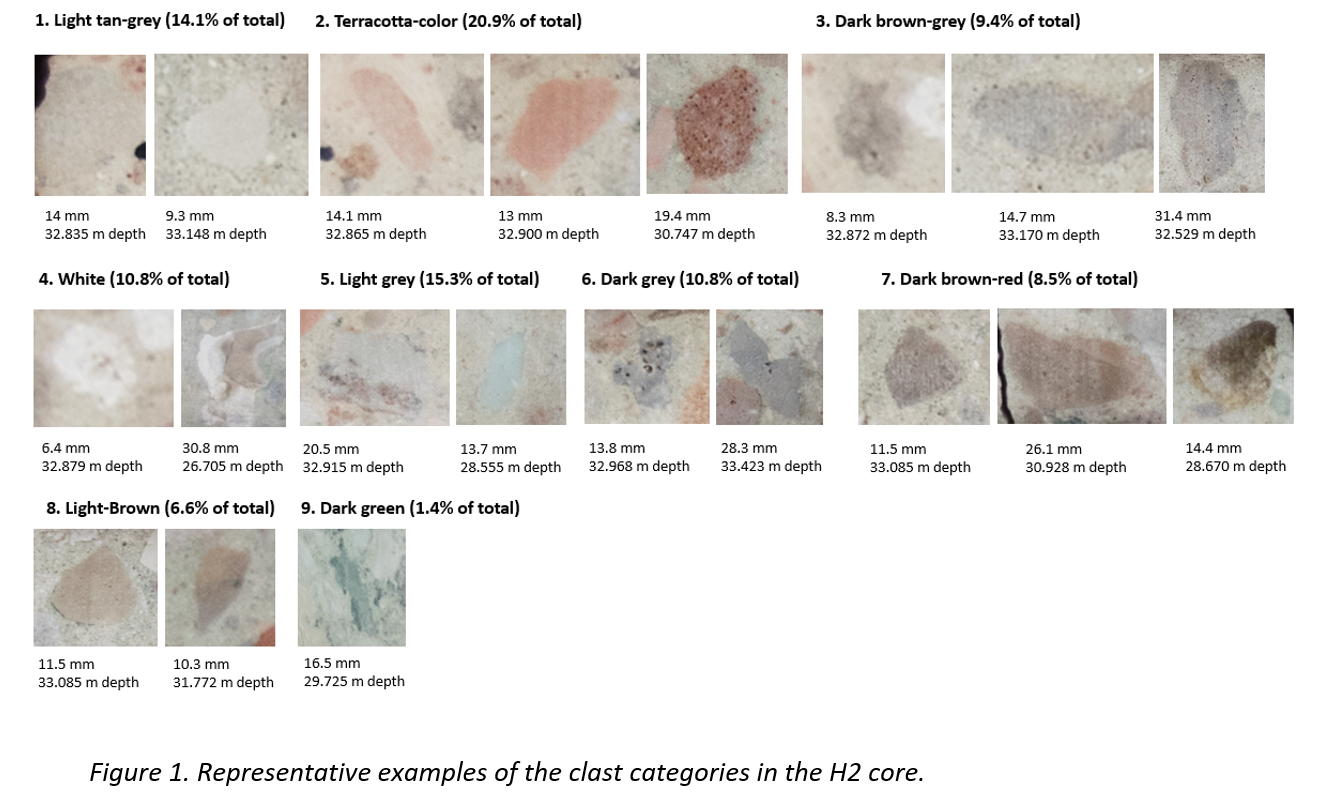
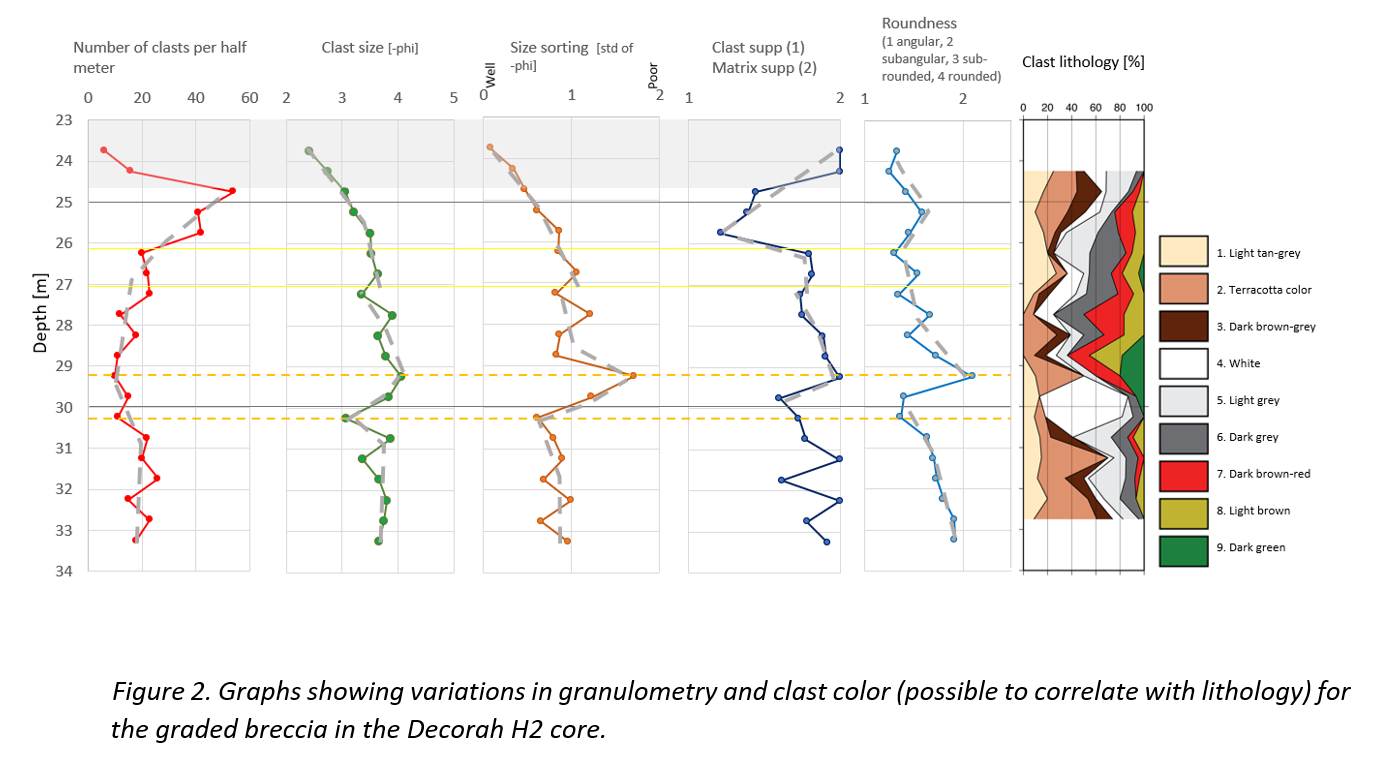
Results and discussion: A selection of the 416 clasts examined in H2 is shown in Fig 1. The plots in Fig. 2 support the normally graded appearance of the breccia as noted by [5]. When comparing with logs from aforementioned craters, where cores have reached through resurge deposits into underlying slump and avalance breccias, it is evident that H2 ends within resurge deposits. Nevertheless, the cored interval shows similar trends as several of the other craters. We primarily compare with Rochechouart. There, the sequence is subdivided into 6 intervals [see fig. 4 in 4]. Especially intervals 3–6 in Rochechouart show similarities to H2, whereas intervals 1-2 likely were not cored at Decorah, but would be expected as they represent the inevitable initial stages of the resurge. Intervals 3 and 4 at Rochechouart (“outwards passage of anti-resurge” followed by development of “body of standing water”) are characterized by slight upwards increase in clast frequency (until 32m in H2) followed by slight decrease (until 30.25m in H2). In the same interval at Rochechouart, the clast size and size sorting remained stable (up to 30.25m in H2), but accompanied by an increase in clast angularity (up to 30.25m in H2). With interval 5 at Rochechouart, a new pulse in transport energy caused a strong increase in clast size and drop in size sorting, as well as slight increase in roundness (29.25–30.25m in H2). This is then in Rochechouart followed by interval 6 that includes an increase in clast frequency and size sorting, and a generally normal grading towards the top (29.2m and upwards in H2). There is also a general upwards decrease in roundness similar to H2. This interval is interpreted to represent settling of material in a now almost water-filled crater, with seiches causing minor repeated beds (e.g., at 26m and 27m in H2)
H2 shows an obvious change in clast lithologies at interval 29.25–30.25m (Fig. 2). The “white” and“dark green” fragments are followed by “dark brown-red”, “dark grey” and “light brown”, whereas “terracotta colored”, “light tan-grey” and “light grey” appear throughout the logged sequence, possibly as the basement clasts do at Rochechouart.
Two stratigraphic intervals can be correlated with clast types; The Upper Cambrian Lone Rock Formation, which contains glauconitic and feldspathic sandstone with some beds of dolomite and green-gray shale, and the Lower Ordovician Oneota and Shakopee formations, which include beds that have been stained red owing to their relationship to the truncating, inter-regional unconformity at the base of directly overlying St. Peter Sandstone [6]. These two intervals produce the more easily traceable greenish and reddish clasts.
The calculated ‹N› = 43. The online "Earth impact effects program" calculator gives a 350m projectile diameter (d) for a final crater diameter of 5.8km. This results in 92m target water depth (H). This seems reasonable considering that resurge must have been able to overcome the elevated rim [cf. 1]. Likewise, certain benthic fossils in the Winneshiek Shale indicate a deposition within the photic zone (i.e., <200m) [cf. 13].
How to cite: Ormö, J., Sturkell, E., and King Jr., D. T.: Assessing target water depth and paleoenvironment at the Decorah impact structure, Iowa., Europlanet Science Congress 2024, Berlin, Germany, 8–13 Sep 2024, EPSC2024-48, https://doi.org/10.5194/epsc2024-48, 2024.
On the 24th of December 2021, an impact produced a 150-m-wide crater on Mars (Fig. 1) and excavated subsurface water ice [1, 2]. The crater is located at 35.10°N, 189.82°E in Amazonis Planitia, and is the largest crater observed to have formed since MRO (Mars Reconnaissance Orbiter) began observations in 2006. The crater presents the lowest-latitude observation of subsurface ice exposed by an impact on Mars [12]. The ice is seen in the proximal ejecta, <700 m from the crater rim, with the highest concentration much closer to the crater rim [2].
The impact produced a magnitude-4 seismic event detected by the InSight (Interior Exploration using Seismic Investigations, Geodesy and Heat Transport) lander, 3500 km away [1]. Here we compare observations with numerical impact simulations, to constrain impact parameters and target structure, specifically the location of the pre-existing subsurface ice. Our results will provide important constraints for the climate history on Mars and understanding the properties of impact-generated seismic waves.
Methods
We use iSALE3D shock physics code [3, 4] to simulate several scenarios that could have produced the “Christmas Eve crater”, informed by statistical analysis of impact parameters necessary to form a 150-m crater [1]. As asymmetry of the blast zone and the presence of an up-range ejecta exclusion zone suggest a highly oblique impact trajectory, we consider impact angles between 15–30°. We assume a spherical impactor of diameter 5–7 m striking the target at 12 km/s. We implement a two-layer target configuration. A fractured bedrock layer, modelled as 25% porous basalt (bulk density 2150 kg/m3), is overlain by a 50% porous basaltic regolith layer (bulk density 1430 kg/m3). Both layers are defined using the Tillotson equation of state for basalt [5], ϵ-α compaction model [6, 7] and the ROCK strength model [8]. We investigate three thicknesses of the upper layer: 10, 15 and 20 m, guided by observations of other craters in the area [2].
The state and position of ejecta are tracked using Lagrangian tracer particles throughout the simulation, and then projected to their final locations assuming ballistic trajectories [9]. We focus on the most proximal ejecta blanket, within 1 crater radius (75 m) of the crater rim, as it contains the highest concentration of visible ice. As we do not explicitly model ice as a separate material, we assume temperature and pressure thresholds of 0°C and 10 MPa, respectively, as the melting point and unconfined compressive strength of ice [10]. We identified ice patches visible around the crater using the quantitative multi-spectral method described in [11] to produce a map of icy ejecta for comparison with our simulations. We use this map to identify overlapping simulated ejecta particles and trace them back to their original positions, producing a possible pre-impact distribution of subsurface ice.
Results and Discussion
Our simulations produce craters with rim diameters of 130–160m, consistent with observations. The best match to the observed crater morphology is achieved by impacts into the 15-m-thick regolith layer. The simulated craters in this target configuration are 17–19 m deep (depending on impact angle, measured from the pre-impact surface), consistent with the observed crater (17 m), though have steeper walls. This could be explained by later-stage crater modification, which is not simulated here. Fig. 2 shows an impact scenario of a 5.2-m-wide impactor at 30°, compared with the observed crater profile.
Our results suggest that the proximal ejecta blanket originated from depths <12 m. The ejecta that have experienced temperatures and pressures below the thresholds described above (‘ice-compatible’) originated from even shallower depths, <10 m, and from 30–60 m radially away from the crater centre (Fig. 3). No ejecta with preserved ice originates from closer to the crater centre owing to higher temperatures and pressures closer to the impact point.
For this scenario, 96% of ice-containing pixels overlapped with a simulation tracer particle. When projected to their pre-impact positions, the overlapping ejecta imply a discontinuous ice distribution under the pre-impact surface (Fig.3b), consistent with the heterogeneous distribution of subsurface ice found at other ice-exposing impact sites at higher latitudes [12].
Conclusions
Our iSALE3D simulation results suggest the presence of a stronger bedrock layer 15 m beneath the surface, overlain by a porous regolith layer. We find that the ice blocks visible in orbital images most likely originated from shallow depths <10 m. Our results also suggest that the ice was laterally discontinuous across the pre-impact target.
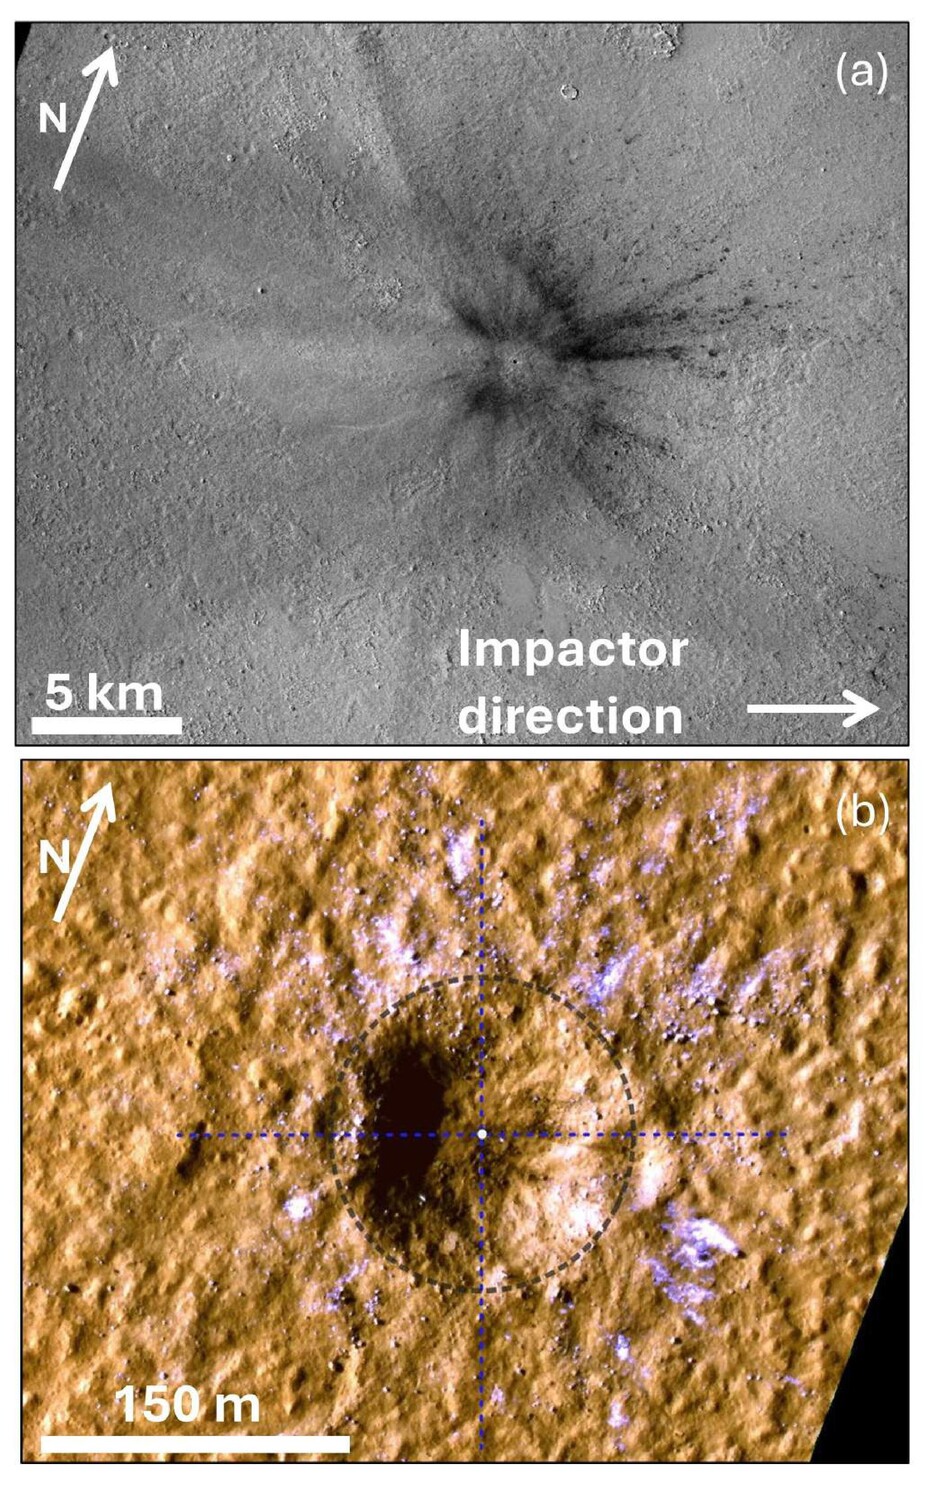
Figure 1: (a) CTX image of the Christmas Eve crater (image ID: K18_060561_2175_XI_37N170W). (b) HiRISE image of the crater and proximal ejecta (image ID: ESP_073077_2155_COLOR). Black circle marks the approximate crater rim. Dashed lines indicate the location of cross-sections in Fig. 2.
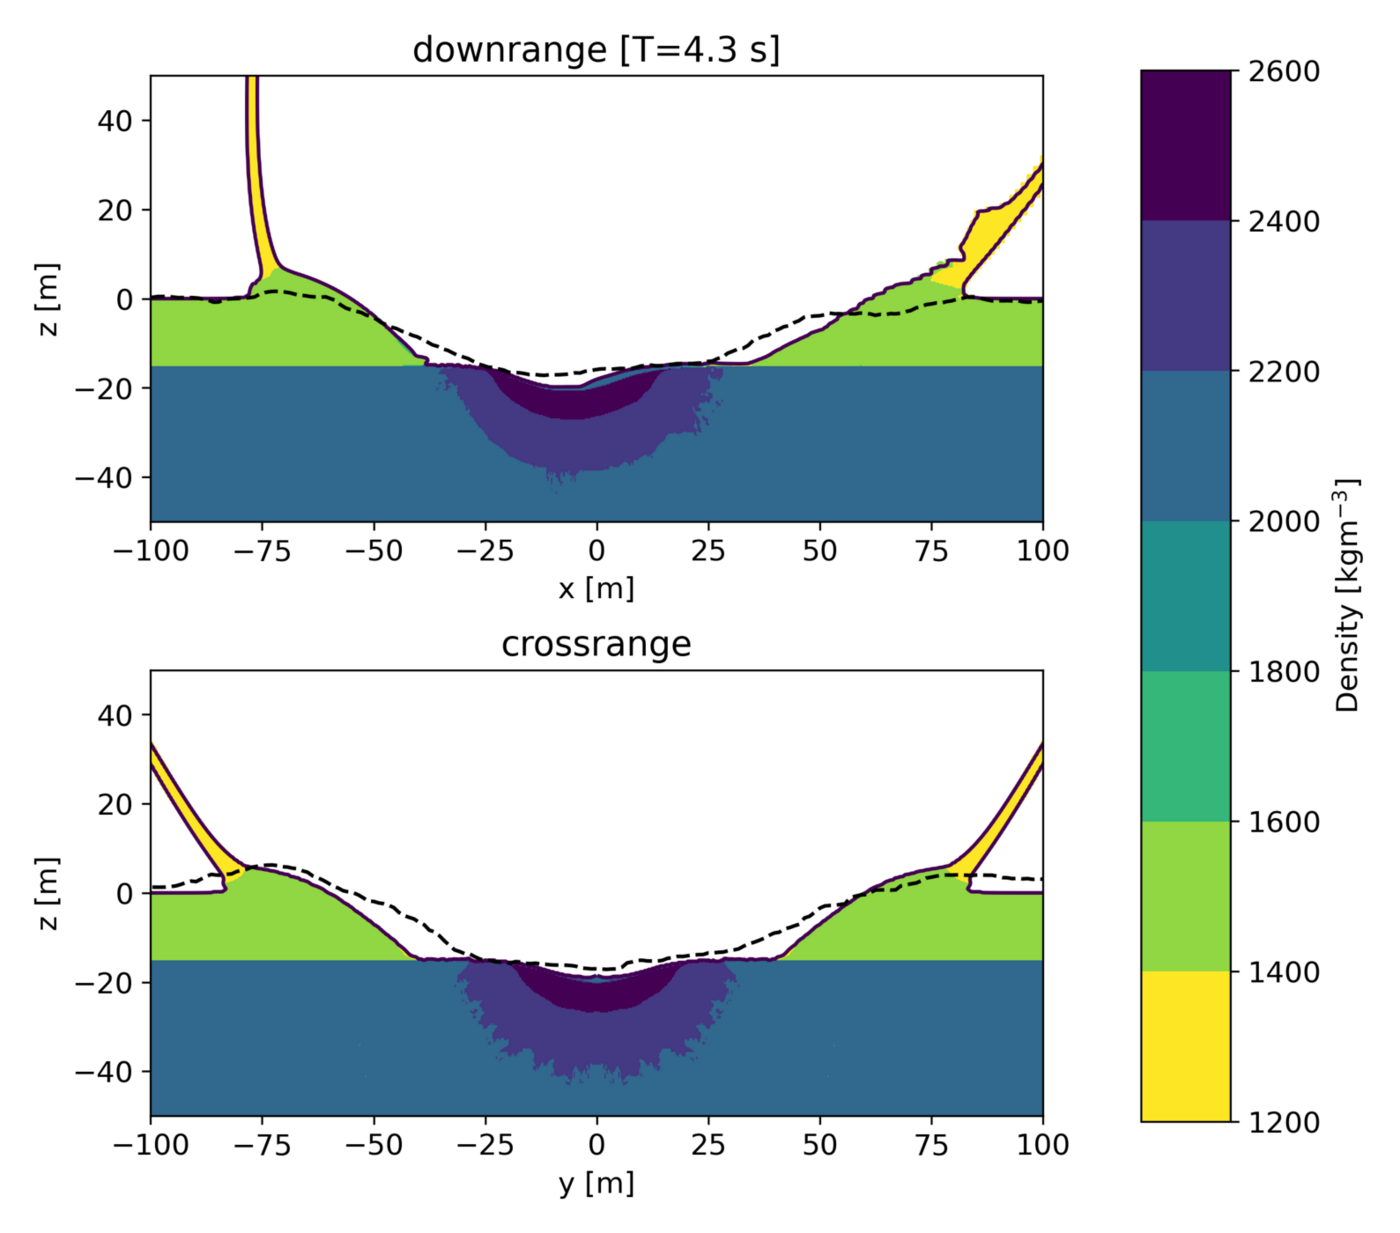
Figure 2: Depth profile of a simulation in (a) downrange and (b) cross-range direction, compared with the observed profiles (dashed lines) measured along the dashed lines in Fig. 1.
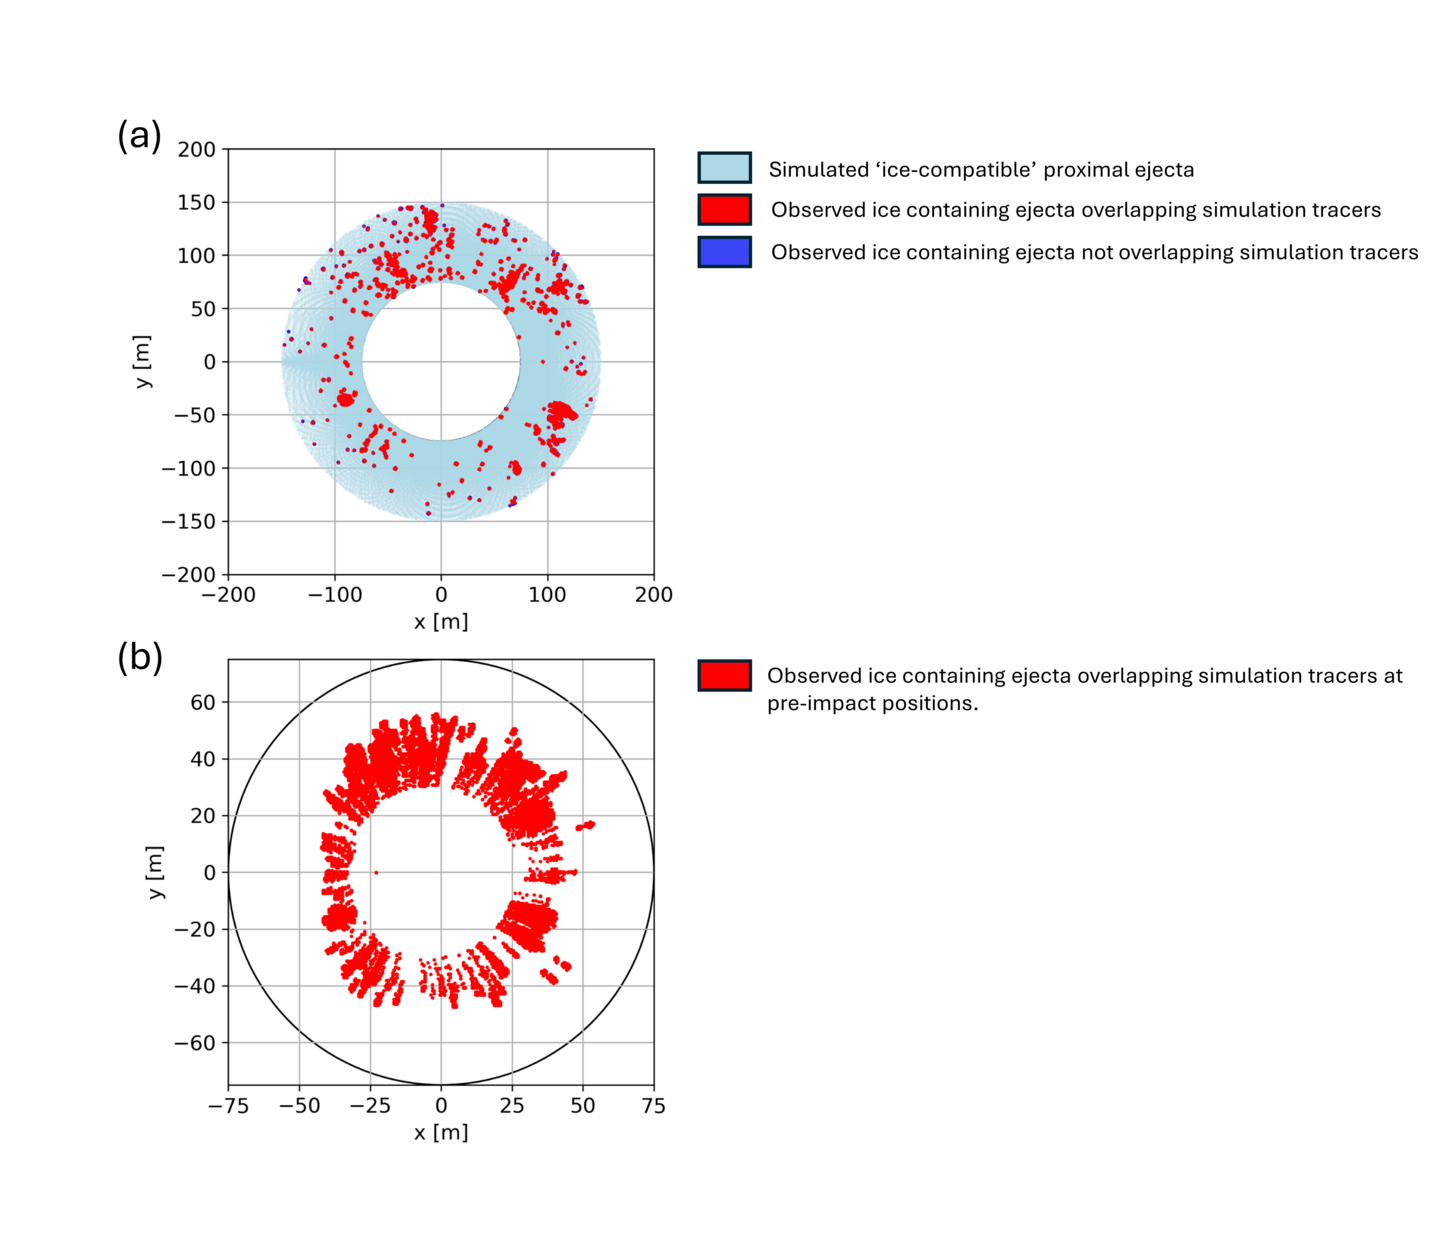
Figure 3: (a) Simulated ice-compatible ejecta at their final projected landing locations (light blue), the observed ice locations (dark blue squares) and observed ice pixels overlapping with simulated tracers (red). (b) Pre-impact locations of simulated ejecta overlapping with observed ice locations (red). Black circle marks the approximate crater rim.
References:
[1] Posiolova, L. V. et al. (2022) Science (New York, N.Y.) 378:412–417.
[2] Dundas, C. M. et al. (2023) Geophysical Research Letters, 50.
[3] Elbeshausen, D. et al. (2009) Icarus, 204:716–731.
[4] Elbeshausen, D. & Wünnemann, K. (2011) Proceedings, 11th Hypervelocity Impact Society Symposium.
[5] Tillotson, J. H. (1962) Report No. GA-3216, General Atomic, San Diego, CA,43.
[6] Wünnemann, K. et al. (2006) Icarus, 180:514–527.
[7] Collins, G. S. et al. (2011) International Journal ofImpact Engineering, 38:434–439.
[8] Collins, G. S. et al. (2004) Meteoritics and Planetary Science, 39:217–231.
[9] Raducan, S. D. et al. (2019) Icarus, 329:282–295.
[10] Durham, W. B. et al. (1983) Journal of Geophysical Research: Solid Earth, 88:B377–B392.
[11] Rangarajan, V. G. et al. (2023) Icarus,115849.
[12] Dundas, C. M. et al. (2021), Journal of Geophysical Research: Planets, 126(3), pp. 1–28.
How to cite: Wojcicka, N., Collins, G. S., Rangarajan, V. G., Dundas, C. M., and Daubar, I. J.: Oblique Impact Modelling of the Crater Formation and Icy Ejecta of the "Christmas Eve Crater" on Mars. , Europlanet Science Congress 2024, Berlin, Germany, 8–13 Sep 2024, EPSC2024-771, https://doi.org/10.5194/epsc2024-771, 2024.
Introduction:
The surface and crustal structure of the terrestrial planets in the inner solar system have been influenced by large and energetic impact events. Impact basins have long been recognized and studied through satellite images, topographic data, and gravity data.
Peak-ring basins are characterized by a rim crest and an interior peak ring, while multi-ring basins are larger and defined by having additional concentric topographic rings (e.g., [1]). Peak-ring and multiring basins are widespread on the terrestrial planets and can be characterized by their gravity signature. GRAIL data showed that large lunar basins are characterized by a central gravitational anomaly. The size of this gravitational anomaly corresponds closely to the diameter of the inner peak-ring of a basin, while the main ring is approximatively twice the diameter of the peak ring [2]. This allowed to confirm the existence of previously proposed basins, to correctly identify which ring is the main crater rim, and to detect new basins that were not yet identified.
In this work we present an improved techniques based on the analysis of gravity and crustal thickness data to estimate the inner ring and rim crest diameters. This technique expands upon the work of [2] and allows us to better identify highly degraded basins. From this analysis, we quantify how lower resolution gravity and crustal thickness datasets (such as for Mars and Mercury) might bias the peak ring and main rim diameter estimates.
Methods:
In our approach, we first quantify the regional value of the Bouguer gravity anomaly and crustal thickness, which is defined as the average value obtained from azimuthally averaged profiles in the radius range 1.5D to 2D, where D is the crater diameter. The diameter of the Bouguer gravity high, as well as the diameter of the crustal thickness anomaly, were then estimated as the radius where the profiles first intersect the background regional values. After the initial estimate of D was obtained, the procedure was iterated until there was no change in the obtained diameters.
We tested this method using Bouguer gravity data for certain lunar peak-ring and multi-ring basins (see table 1 in [2]), by considering the spherical harmonic degree range from 6 to 540 (which removes the effect of the hemispheric asymmetry and the South Pole–Aitken impact). We then filtered the data using the spherical harmonic degree range 6-49 in order to simulate the lower resolution of the Mars gravity models (e.g., GMM-3, [3],[4]). We then used the same approach using crustal thickness maps derived after GRAIL [5], both for the degree ranges 6-310 and 6-46, to simulate the loss of spatial resolution of Mars. Uncertainty estimates were obtained for the crustal thickness and the Bouguer anomaly diameter by considering the ±1σ values for the background values in the spatial range of 1.5D to 2D.
In Figure 1 we show an example for the Humboldtianum basin, which has a peak-ring diameter of 322 km (5.3° in angular radius). Our method gives a result of 323.1 ± 4.4 km from the Bouguer gravity data (using the degree range 6-540), and 316.3 km ± 4.9 km from crustal thickness data (using the degree range 6-310).
Conclusions and future work:
When considering the highest spatial resolution of the Bouguer gravity data and crustal thickness maps, our method properly detects peak-ring or inner ring sizes for lunar basins with main rim diameter greater than 250 km (i.e., for inner ring diameters greater than about 110 km). Nevertheless, when considering filtered versions of these datasets that correspond to the effective spatial resolution of the Mars gravity models, only basins with rim crest diameters greater than about 450 km can be detected with acceptable accuracy. Regardless, these results confirm a roughly one-to-one relationship between the Bouguer anomaly diameter and the inner peak-ring diameter of lunar basins, as well as between crustal thinning size and peak-ring size (Figure 2).
We first plan to apply this approach to the Moon in order to reassess the impact basins database of [2]. Following this, we will apply the same methodology to Mars to provide a consistent database of Martian basin sizes. Previous databases for Mars suffer from a difficulty of detection as a result of sedimentary and erosive processes, and also an imperfect understanding of their crustal thickness and gravity signatures that was only elucidated by the GRAIL mission. Future analyses will be applied to the planet Mercury. Results from these analyses will allow one to better constrain the impact rate during the early solar system.
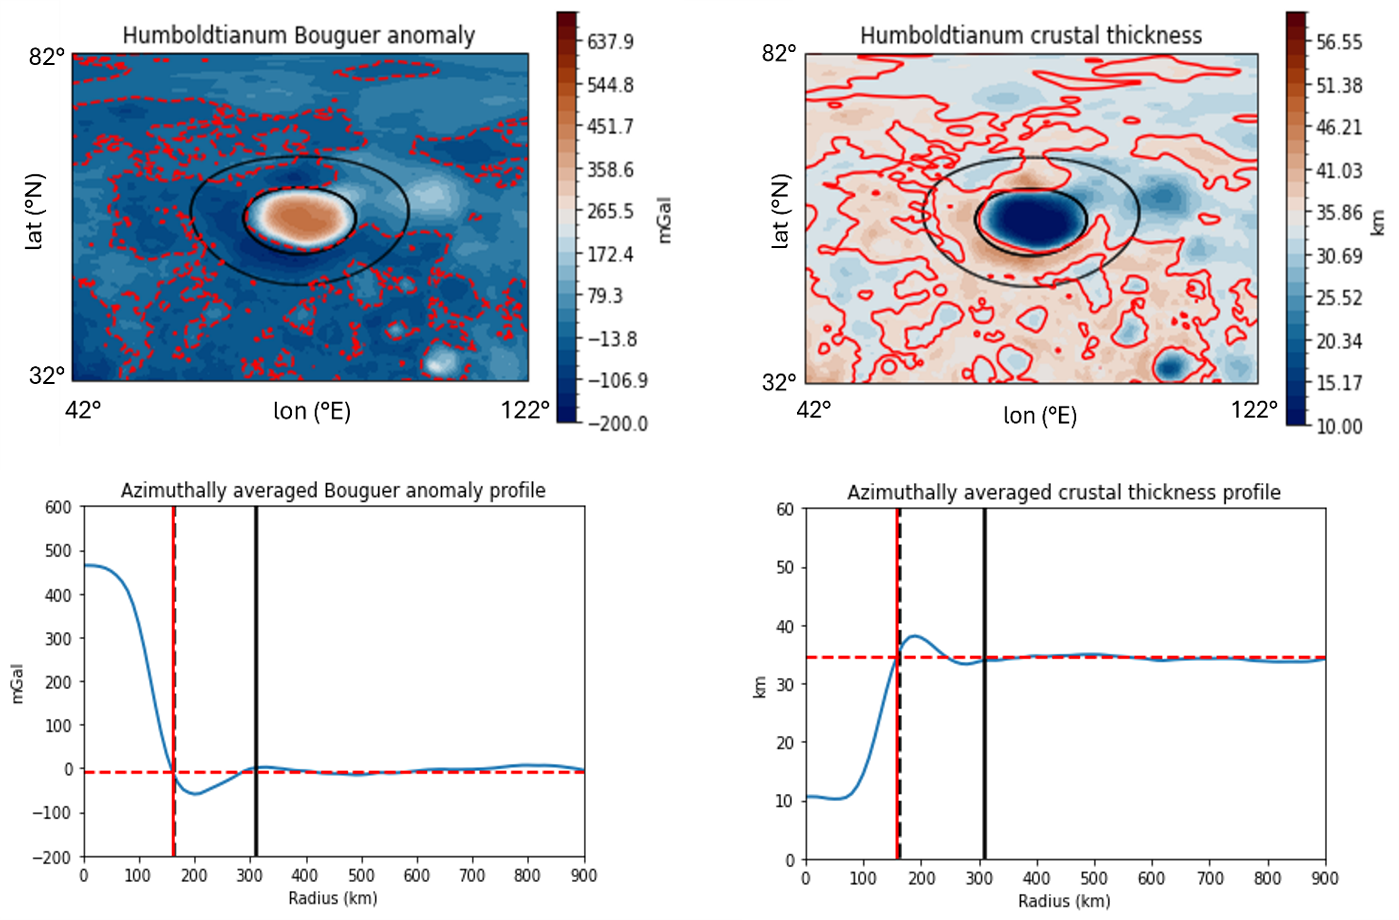
Figure 1. Bouguer gravity anomaly (left) and crustal thickness (right) of the Humboldtianum impact basin. Images of these datasets are shown in the top row, and azimuthally averaged profiles are shown in the bottom row. Black dashed lines represent the peak-ring or inner ring radius (km), while black solid lines denote the main rim radius (km). Regional values of the Bouguer gravity anomaly and crustal thickness are indicated by red dashed lines, while Bouguer anomaly and crustal thinning diameters are shown with red solid lines.
Figure 2. Bouguer anomaly diameter (left) and crustal thinning diameter (right) versus peak-ring or inner-ring diameter (km) for certain lunar peak-ring and multi-ring basins. Basins include Schwarzschild, d’Alembert, Milne, Bailly, Planck, Schrödinger, Mendeleev, Birkhoff, Lorentz, Vaporum, Korolev, Moscoviense, Crüger-Sirsalis, Grimaldi, Apollo, Hertzsprung, Freundlich-Sharonov, Humboldtianum, Coulomb-Sarton, Humorum, Smythii, Nectaris, Orientale, Crisium, Imbrium. Red dashed lines indicate a 1:1 ratio.
References:
[1] Baker D. M. H., et al. (2011). Planet. Space Sci.
[2] Neumann G. A., et al. (2015). Sci. Adv.
[3] Genova A., et al. (2016). Icarus.
[4] Wieczorek M. A., et al. (2022). JGR: Planets.
[5] Wieczorek M. A., et al. (2013). Science.
Acknowledgements: We gratefully acknowledge funding from the Italian Space Agency (ASI) under ASI-INAF agreement 2017-47-H.0.
How to cite: Buoninfante, S., Wieczorek, M. A., Galluzzi, V., Ferranti, L., Milano, M., Fedi, M., and Palumbo, P.: Quantifying the size of impact basins on the Moon and Mars., Europlanet Science Congress 2024, Berlin, Germany, 8–13 Sep 2024, EPSC2024-484, https://doi.org/10.5194/epsc2024-484, 2024.
Introduction: The prevailing theory for the formation of Earth’s Moon is the Giant Impact hypothesis, in which a collision between the young Earth and a massive body ejects material into a circumplanetary disk from which the Moon then forms. In the leading version of this hypothesis, called the “canonical” Moon-forming impact, a Mars-sized impactor (Theia) collided with the Earth in an oblique impact at roughly the mutual escape velocity of the bodies. Prior simulations suggest that about one lunar mass of material is ejected into orbit, from which the Moon later accretes. A successful Moon-forming impact must be consistent with the following observations: 1) It must explain the angular momentum of the Earth-Moon system, 2) eject enough mass into orbit to allow the formation of the Moon, 3) the disk must be depleted in iron compared to the Earth and 4) the isotopic composition of the disk and Earth’s mantle must be similar. To date, no scenario has been found that satisfies all constraints without requiring either special initial conditions (isotopic similarity between target and impactor) or post-impact processes (removal of angular momentum, post-impact mixing). Studies investigating the formation of the Moon usually focus on meeting certain observational constraints and therefore a limited region of the parameter space. A systematic investigation of the parameter space of potential Moon-forming impacts has not yet been performed.
Methods: We present a systematic survey of the parameter space for Moon-forming giant impacts. This study consists of 7649 collision simulations which cover a wide range of the initial angular momentum, the impact velocity, and the impactor-to-target mass ratio. We also include pre-impact rotation for both the target (proto-Earth) and the impactor, where the rotational angular momentum can be either aligned or anti-aligned with the orbital angular momentum. The simulations are carried out using the 3D smoothed-particle hydrodynamics (SPH) and gravity code Gasoline, with numerical improvements for giant impact simulations. The colliding bodies are modelled as a two-layer sphere, using the ANEOS equation of state for both the iron core and the rocky mantle. Bodies with pre-impact rotation are created by evolving the particle representation in a co-rotating frame with an angular velocity that is slowly increasing until it reaches the desired value and then transferring it to the stationary frame. The collision outcomes are then analyzed using a novel disk finder algorithm to distinguish between the planet and the circumplanetary disk. From this we then calculate the bound angular momentum, the disk mass, the disk iron mass fraction, and the mixing between impactor and target material in the collision.
Results: The set of simulations presented here, which systematically samples the pre-impact parameter space, produces a very diverse set of outcomes (see Figure 1), including disk masses between 0-6.71 ML (lunar masses). Notably, no simulation was identified that could satisfy all four of the known constraints.
Without pre-impact rotation, no collision produced a sufficiently massive disk (Md > 2 ML) below a bound angular momentum of 2 JEM (see center frame of Figure 2). Collisions with pre-impact rotation can fill some parts of the post-impact parameter space that are not populated by collisions without pre-impact rotation. For example, massive disks can be created by collisions with very low impactor-to-target mass fractions (gamma < 0.1), and we find excellent mixing for all impactor-to-target mass fractions, but massive disks and good mixing are limited to impactor-to-target mass fractions >= 0.5 and the scenario with fast counter-rotating target and very low impactor-to-target mass fraction. By adding pre-impact rotation, we also find results that satisfy both the constraints on disk mass and angular momentum. However, in those cases the disk is predominantly composed of impactor material and therefore they do not satisfy the mixing constraint. Nonetheless, we find plenty of cases that satisfy any combination of three out of the four constraints.
Around 3% of the simulation results show a massive bound fragment (between 0.5 and 1.5 ML) orbiting in the disk. These fragments either form directly by tidal deformation of impactor material and material excavated from the target or by fragmentation of spiral arms. Such direct formation of (proto) satellites can occur for a wide range of impact conditions. Their composition can be anything between target to impactor dominated and we also find cases with excellent mixing. The fate of such fragments is unclear as they could either be eroded by tidal forces or serve as a seed for the formation of the Moon. In the latter case, constraints on the disk mass and the mixing parameter may change, as this may increase the accretion efficiency. As the accreted material does not necessarily mix with the deeper layers of the Moon, this also allows for differences in the composition between the surface and the deep interior of the Moon.
Conclusions: In our systematic survey of the Moon-forming giant impact parameter space, we find no single case that can satisfy all observational constraints without requiring very specific pre-impact conditions or post-impact processes. We also find that the canonical Moon-forming impact cannot produce sufficiently massive disks without significant pre-impact rotation. A modified canonical impact with a counter-rotating target can produce massive enough disks but these disks are then strongly impactor dominated. In general, collisions with pre-impact rotation can produce massive disks at much lower angular momentum, allowing to reconcile the angular momentum and disk mass constraints. The presence of gravitationally bound fragments found in a small fraction of cases could significantly alter the disk mass and mixing constraints; as a result, the community may be forced to reconsider the currently accepted set of constraints.
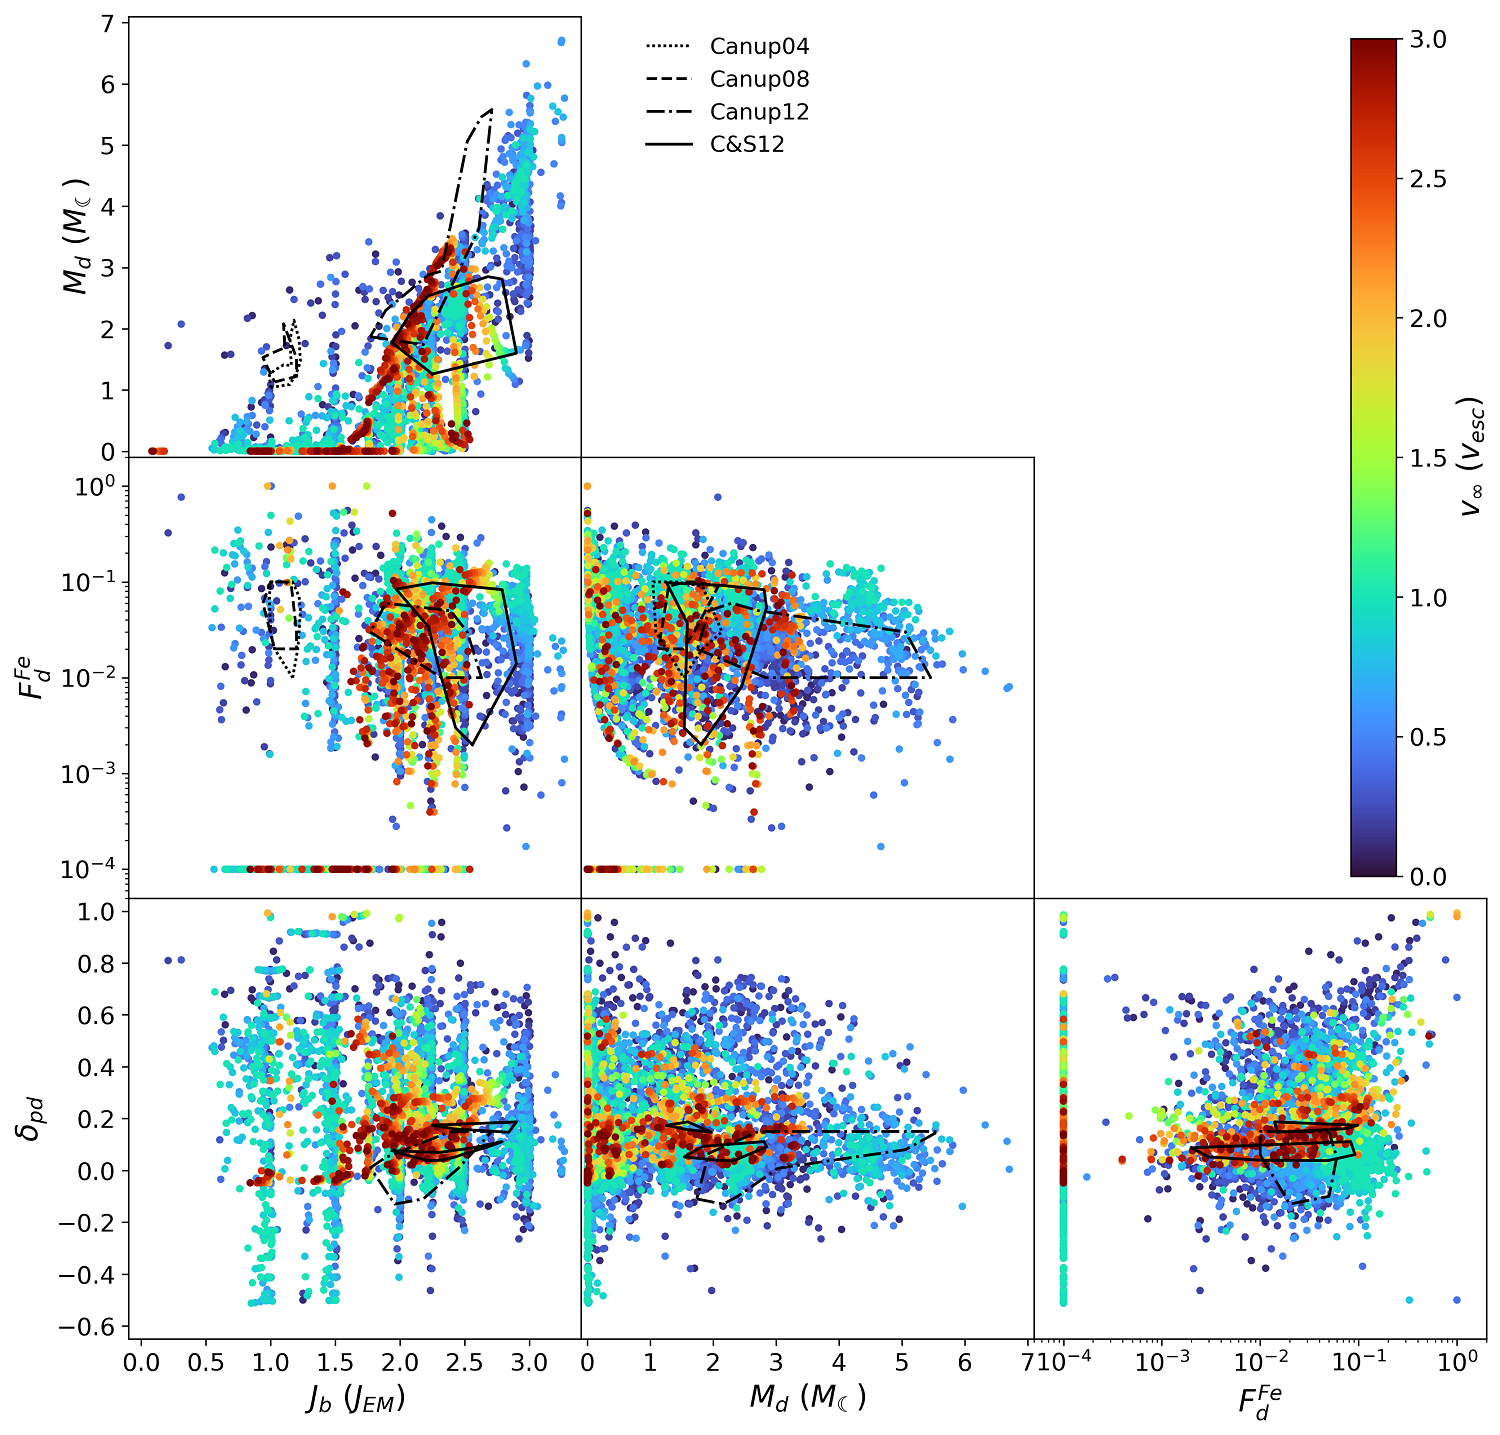
Figure 1: Post-impact variables of all 6247 simulations that result in a merger.
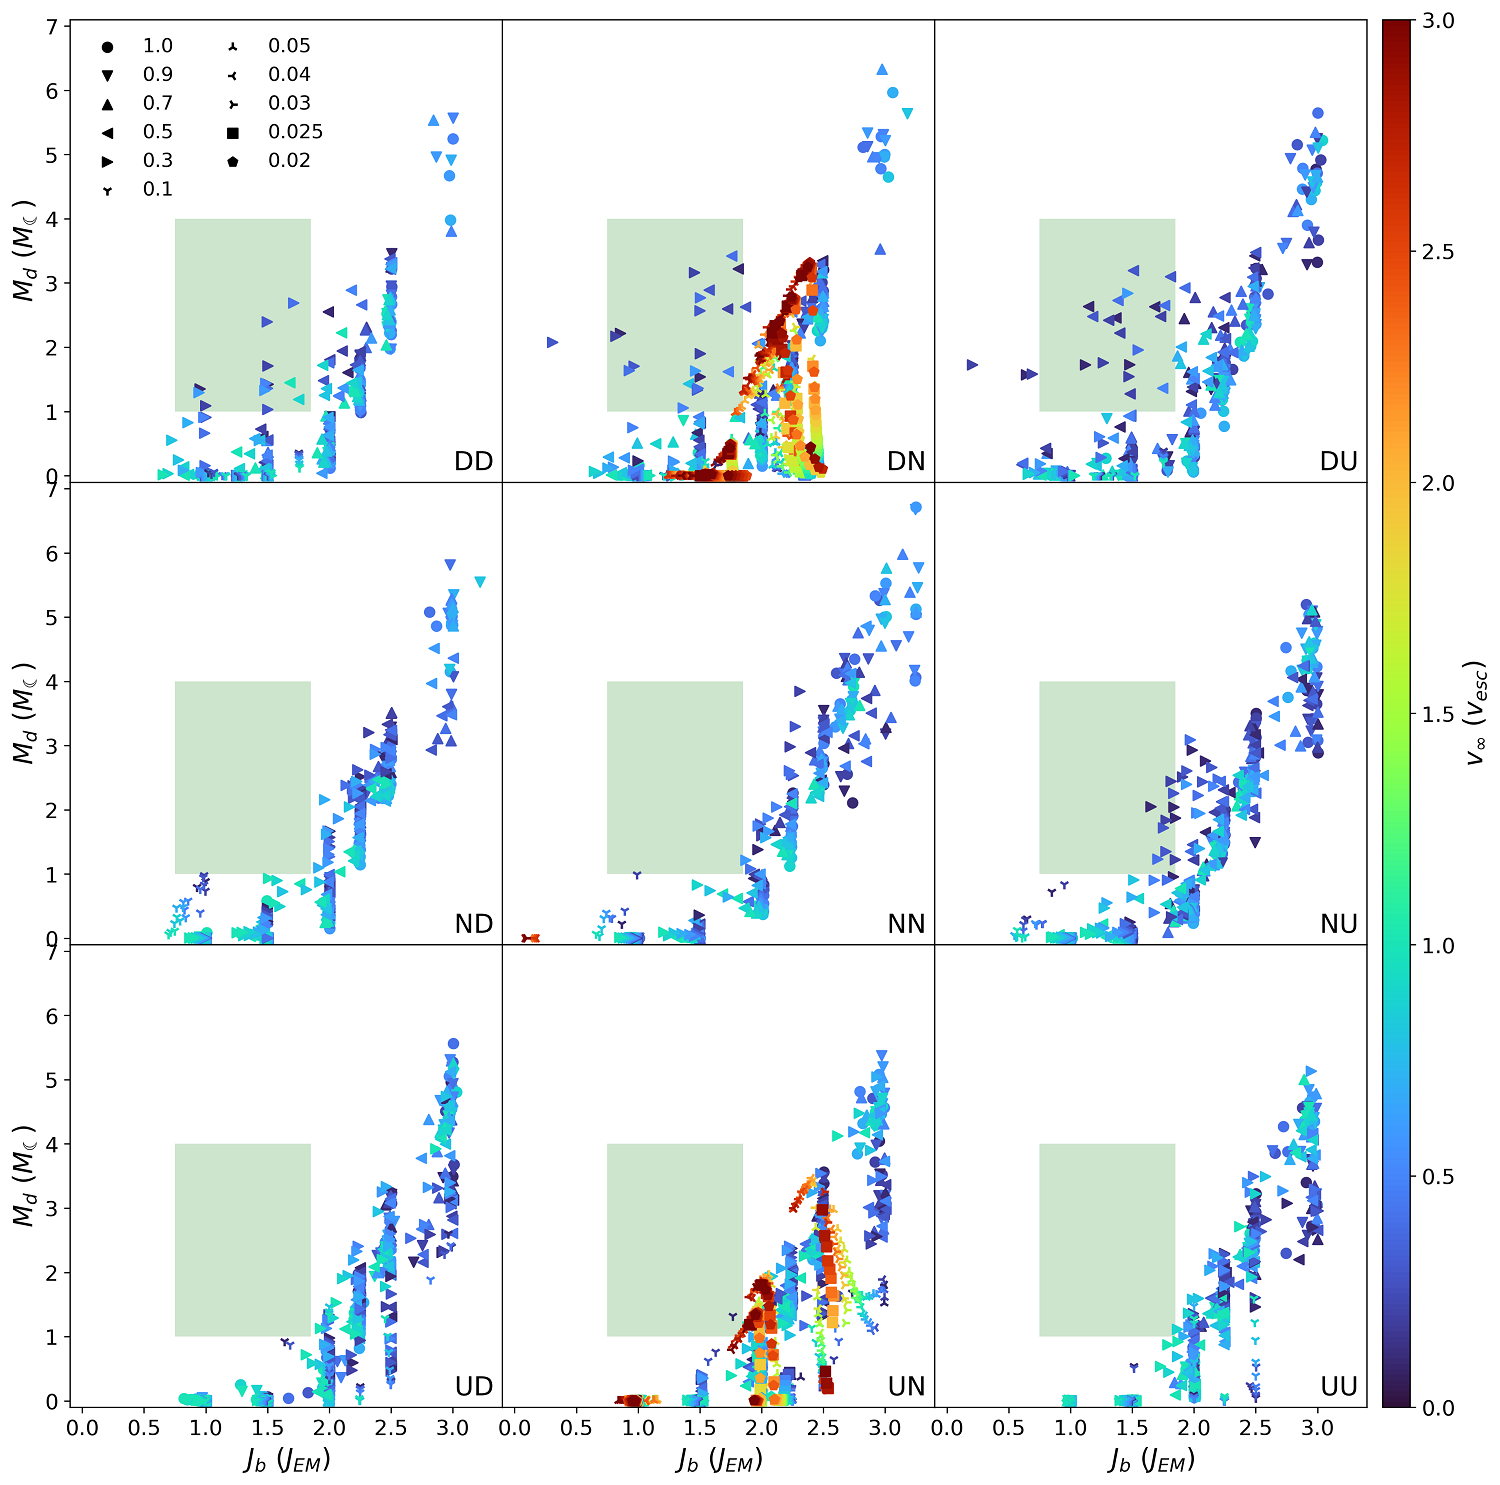
Figure 2: Top panel of Figure 1 split into the 9 different spin configurations.
How to cite: Meier, T., Reinhardt, C., Timpe, M., Stadel, J., and Moore, B.: A Systematic Survey of Moon-Forming Giant Impacts, Europlanet Science Congress 2024, Berlin, Germany, 8–13 Sep 2024, EPSC2024-74, https://doi.org/10.5194/epsc2024-74, 2024.
Introduction: Planetary formation models suggest that Earth experienced multiple high-energy impacts. They can produce substantial melt in the proto-Earth’s silicate mantle, possibly forming a global magma ocean. Mixing of the impactor’s metallic core into the molten Earth's silicate mantle controls the chemical equilibration between metal and silicates, which defines the respective compositions of Earth's core and mantle. Previous studies explore mixing upon large impacts either with numerical modelling or with analog laboratory experiments. Numerical simulations are efficient in reproducing the shock physics of hypervelocity impacts. However, their spatial resolution is limited and does not allow for reproducing the turbulent features that are responsible for metal-silicate mixing in a magma ocean. On the other hand, liquid impact experiments that do produce small-scale mixing and turbulence are subsonic: they neglect compressibility effects. Here, we investigate the degree of mixing upon impact by coupling various results from fluid impact experiments [1] and numerical modelling extending the crater depth from experiments to supersonic conditions [2].
Methods: The laboratory experiments used to explore mixing and extend to the supersonic regimes consist in a volume of fluid impacting into a tank of water. The denser impactor fluid is dyed, enabling for the optical estimate of the volume of the evolving sinking plume right after the impact. The volume of the plume gives, once corrected from the volume of the impactor material, an analogue of the volume of entrained silicates upon a given collision. We have extended laboratory results on the crater growth from subsonic to supersonic conditions using the grid-based Eulerian shock physics code iSALE [3,4,5,6] to simulate fluid impacts. The scaling-law that is produced [2] to extend laboratory experiments results to supersonic, hypervelocity conditions, is used here to be further applied to the mixing. The experiments from [1] suggest that the impact between an impactor of density ρi and a lighter target of density ρt involves two main stages: the opening of the crater at early times and the fall of central jet that had been formed from the collapse of the crater. That latter event controls the release of the impactor material into the target. At later times, buoyancy forces become important, which controls the sinking of the impactor material into a turbulent thermal descending into the target. The competition between total buoyancy and the momentum of the collapsing jet controls the dynamics of the descending thermal [1], hence the mixing between impactor material and surrounding target silicates. It has been showed that the jet height scales as the maximum crater depth and that the maximum jet volume scales as the maximum crater volume [7]. We use these scalings, coupled to those regarding mixing from [1] and those on the extension of maximum crater depth from experiments to supersonic conditions from [2] to extend the mixing results from laboratory experiments to hypervelocity regimes accounting for both the effects of the Froude number (measure of the importance of the impactor kinetic energy to its gravitational energy at impact) and the Mach number (impact velocity to sound speed ratio).
Results: Figure 1 shows the mass of silicates that is entrained in the thermal prior to its descent to the magma. It provides a direct measure of the so-called mixing between metal and silicates during a large impact into a magma ocean. We find that the Mach number decreases the estimates of metal-silicate mixing upon impacts derived from laboratory experiments. The extent of its effect however depends on the other impact parameters such as the impactor size. The larger the impactor compared to the target size, the larger the effect of the Mach number. For M>3, the mixing estimates can be underestimated by more than a factor 3 if not accounting for the shock.
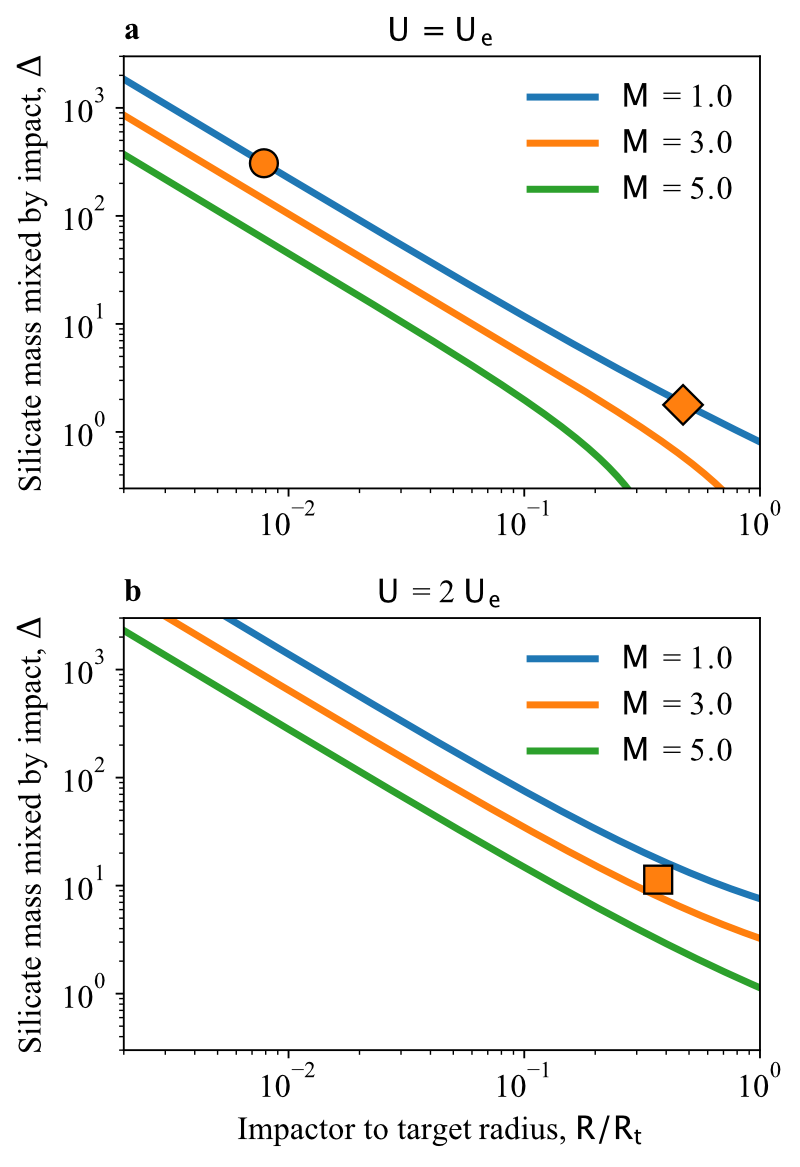
Figure 1. Mass of silicates mixed with metal by the impact stage, prior to the descent into the magma, Δ, as a function of the impactor to target radius, R/Rt , varying the Mach number, M, for two cases: a) impact velocity is escape velocity, U = Ue and b) impact velocity is twice larger than the escape velocity, U = 2 Ue. Circle: impactor of 100 km in radius onto an Earth-sized target. Diamond: canonical Moon-forming scenario with a Mars-sized impactor and U = Ue [8]. Square: Moon-forming scenario with an impactor mass 20 times smaller than the target onto a fast-spinning
Earth at U = 2 Ue [9].
Discussion: We have studied the statistics on how often in typical classical scenarios of accretion such collisions would occur for Earth analogs through its growth history. We use collision files from N-body simulations in the Grand Tack scenario [10] and estimate that, depending on the sound speed of the impacted material, 24% to 74% of the total amount of collisions endured by Earth analogs may occur at M>3. If considering only giant impacts, as these are those when the effect of the Mach number is the most significant, this drops to 4% to 28%. The effect of the Mach number on the mixing, however not extreme, may need to be accounted for when following the metal silicates reequilibration through an entire stage of planetary formation.
Acknowledgments: We gratefully acknowledge the developers of iSALE-2D, including Gareth Collins, Kai Wünnemann, Dirk Elbeshausen, Tom Davison, Boris Ivanov and Jay Melosh. This work was funded by the Deutsche Forschungsgemeinschaft (SFB-TRR170, subproject C2 and C4).
References: [1] Landeau M. et al. (2021) Earth Plan. Sci. Lett. 564, 116888. [2] Allibert L. et al. (2023) JGR: Planets 128 (8), e2023JE007823. [3] Collins. G. S. et al. (2004) Meteoritics & Planetary Science 39:217-231. [4] Wünnemann K. et al. (2006) Icarus 180:514-527. [5] Elbeshausen, D. et al. (2009). Icarus, 204(2), 716-731. [6] Elbeshausen et al. (2011). Proceedings of 11th Hypervelocity Impact Symposium (HVIS), Fraunhofer Verlag. [7] Ghabache É. et al. (2014) . Fluid Mech. 761, 206–219. [8] Canup R. M. (2004) Icarus 168 (2), 433–456. [9] Ćuk, M. and Stewart S. (2012) Science 338 (6110), 1047–1052. [10] Jacobson S. A. and Morbidelli A. (2014) Phil. Trans. Roy. Soc. A 372, 20130174.
How to cite: Allibert, L., Landeau, M., Röhlen, R., Maller, A., Nakajima, M., and Wünnemann, K.: Metal-silicate mixing upon Giant Impacts into magma oceans, Europlanet Science Congress 2024, Berlin, Germany, 8–13 Sep 2024, EPSC2024-1126, https://doi.org/10.5194/epsc2024-1126, 2024.
1. Introduction
The launch of the Hera mission is scheduled for October 2024 [1]. The target of the mission is the binary Didymos system, especially the secondary Dimorphos, which was impacted by the DART mission on 27th September 2022 at 01:15 am (CEST) [2]. The mission shall provide a detailed characterisation of the two bodies and discover what happened to Dimorphos after the impact. To better understand the cratering process, numerical impact simulations have been conducted to analyse the effects of various target properties, (e.g. as strength and porosity), interior structures and exterior boulders, on the outcome of the cratering event [e.g. 3-5]. Nevertheless, these shock physics codes need to be validated against laboratory experiments [e.g. 6-8]. In this study, we explore the effects of curvature of the asteroid strength (cohesion, crush resistance), porosity, and density of boulders on the cratering process in laboratory experiments at the EPIC facility in CAB, and we use these experiments to validate numerical codes.
2. Method
Impact experiments are performed using the EPIC accelerator, which is a 20 mm calibre compressed N2 (300 bar) cannon that launches projectiles at velocities up to ≈420 m/s. The experiments, half- or quarter-space, can be recorded with two high-speed cameras. In the experiments presented here we have kept the impact velocity constant at approximately 380 m/s and used 20 mm spherical delrin projectiles. We used motion tracking sensors with a 100 Hz sampling rate to measure the seismic signal that is generated by the impact. For the first experiment, approximating the surface curvature of an asteroid, we used a target of quartz sand piled in the shape of a half-frustum of ~17 cm height (quarter-space). For the target properties-studies we used two unconsolidated targets of projectile-sized boulders of different strength (cohesion, crush resistance) in quarter-space configuration. The weaker boulder material is made from a blend of sand and gypsum with a lower crush-strength than the porous ceramic boulders in the other experiment. The material of the sand/gypsum boulders was also tested in a homogeneous cylinder impact setup (half-space).
To simulate these experiments, we use the iSALE shock physics code [9-11], applying different strength models and the ε-α-porosity compaction model: For sand parameters, we refer to [6].
3. Results
The crater in the frustum target (Figure 1, top) reaches a transient stage after ~85 ms. The crater is larger than a crater in a flat sand target (Figure 1, bottom). First models of the frustum experiment yield a similar crater diameter (+16%).
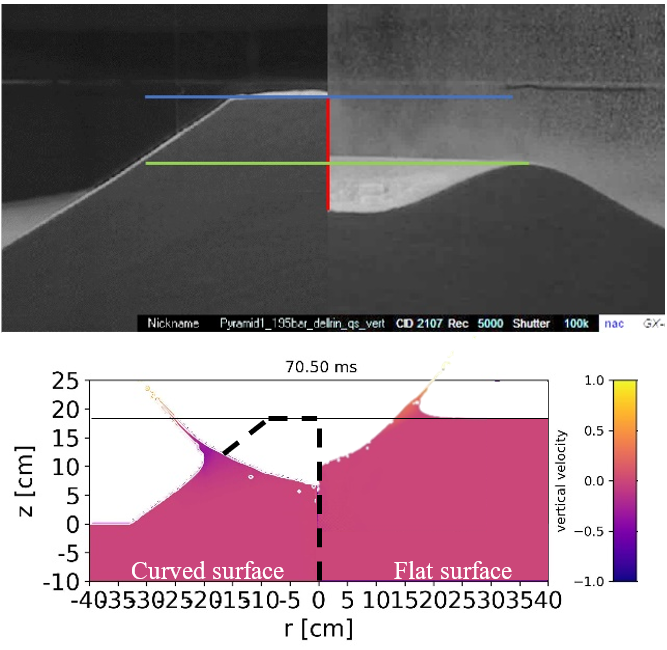
Figure 1: Frustum. Top: Images of the original target (left half) and the final crater (right half). Colours denote: Blue – 26.7 cm crater width at pre-impact surface level when the maximum depth (8.2 cm, red) is reached (49 ms). Green – 27.3 cm crater width of final crater. Bottom: Simulation of frustum (left) and flat sand target (right) after 70.5 ms. The dashed line indicates the shape of the frustum.
The crater in a cohesive homogeneous target of low strength (Figure 2) resembles typical craters in competent rock with fractures and spall pieces.
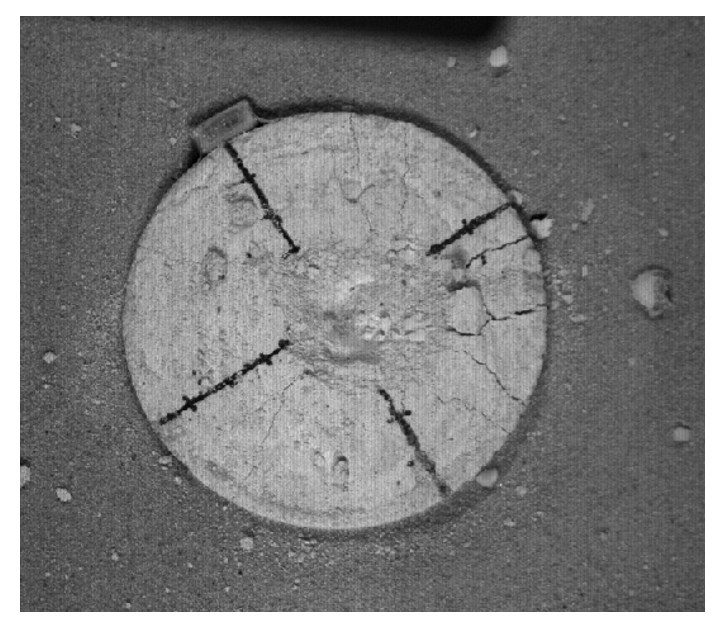
Figure 2: Homogeneous weak (but cohesive) material buried in sand. The cylindric material is 20 cm in diameter and 20 cm in depth. The crater is ~7.1 ± 0.5 cm in diameter.
The experiments with targets made of boulders of two different strengths produce craters of different characteristics (Figure 3). While the diameters are similar, the depth of the crater with weaker boulders is much deeper than in the case of stronger boulders, yielding a depth-diameter ratio of ~0.56 instead of ~0.19. In both cases, impact generated dust is injected into the pore space in the target. In the weak target, more boulders are crushed, and fragments are ejected. In the stronger case, ejection is mostly suppressed.
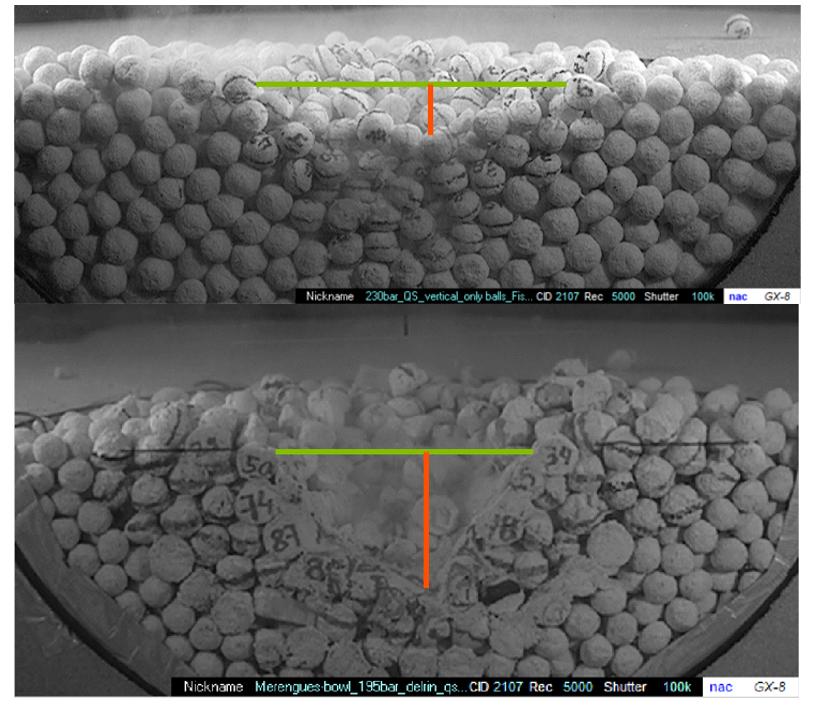
Figure 3: Craters in unconsolidated targets of strong (top) and weak (bottom) cohesive, projectile-size boulders. The diameters (green) are 20 cm & 17.7 cm, respectively, and the depth (orange) is 3.8 cm & 9.9 cm.
4. Conclusion and Discussion
Our experiments serve as validation scenarios for shock physics codes. First simulations can reproduce the resulting crater shape and diameter (Figure 1), but further modelling is ongoing.
The experiments show that surface curvature plays an important role for the cratering event if a large fraction of the crater growths beyond the flat surface. In our case, the flat top diameter of the frustum is about the size of the crater radius in a flat target, i.e. about half of the cratering is ongoing beyond the flat surface. In contrast to a flat target, the release of the pressure and the resulting pressure gradients are not vertical (i.e. there is a horizontal component influencing material movement), and a larger lateral growth of the crater occurs.
The experiments with targets of homogeneous projectile-sized particles (“boulders”) show some transition of the cratering regime from typical crater shapes to deep craters and funnels [cf. 12, 13]. Besides impact velocity or the projectile-target density ratio, the transition seems to depend on the strength and crushing behaviour of the target.
Acknowledgements
We gratefully acknowledge the developers of iSALE (www.isale-code.de). The work by J.O. and S.D.R. was supported by grant PID2021-125883NB-C22 by the Spanish Ministry of Science and Innovation/State Agency of Research MCIN/AEI/ 10.13039/501100011033 and by “ERDF A way of making Europe”. R.L., J.O., I.H. S.D.R., M.J., and K.W. were supported by the Spanish Research Council (CSIC) support for international cooperation: I-LINK project ILINK22061.
References
[1] Michel P. et al., PlanSciJour,3,160,2022.
[2] Daly R. T. et al., Nature,616,443-447,2023.
[3] Stickle A. M. et al., PlanSciJour,3,248,2022.
[4] Raducan S. D. et al., Nature Astronomy,8,445-455,2024.
[5] DeCoster M. E. et al., PlanSciJour,5,21,2024.
[6] Ormö J. et al., M&PS, 50(12),2067-2086,2015.
[7] Luther R. et al., PlanSciJour,3,227,2022.
[8] Ormö J. et al., EPSL,594,117713,2022.
[9] Amsden A. et al., LANL,LA-8095,101,1980.
[10] Wünnemann, K. et al.,Icarus,180,514-527, 2006.
[11] Collins, G. S. et al., Int.Journ.Imp.Eng.38,434-439,2011.
[12] Kadono T., PSS,47,305-318,1999.
[13] Luther R. et al., M&PS,58(12),1832-1847, 2023.
How to cite: Luther, R., Ormö, J., Herreros, I., Benavidez, P., Raducan, S. D., Jutzi, M., Baldauf, S., and Wünnemann, K.: Impact Experiments and Model Validation in the frame of the Hera mission , Europlanet Science Congress 2024, Berlin, Germany, 8–13 Sep 2024, EPSC2024-194, https://doi.org/10.5194/epsc2024-194, 2024.
Please decide on your access
Please use the buttons below to download the supplementary material or to visit the external website where the presentation is linked. Regarding the external link, please note that Copernicus Meetings cannot accept any liability for the content and the website you will visit.
Forward to presentation link
You are going to open an external link to the presentation as indicated by the authors. Copernicus Meetings cannot accept any liability for the content and the website you will visit.
We are sorry, but presentations are only available for users who registered for the conference. Thank you.
The model and initial data. At the late stages of formation of the terrestrial planets and at the late-heavy bombardment, bodies collided with these planets. Some material could be ejected at such collisions. The motion of bodies ejected at such collisions from the Earth, Mars, and Mercury was studied under the gravitational influence of the Sun and all planets. The symplectic code from the SWIFT integration package (Levison, Duncan, 1994) was used for integration of the motion equations. The considered time integration step ts equaled to 1, 2, 5, or 10 days, and the results of calculations with different ts were compared. Most of calculations were done with an integration time step equal to 1 day for ejection of bodies from Mercury and with ts=5 days for other planets. In each calculation variant, the motion of 250 bodies ejected from the Earth was studied for the fixed values of an ejection angle iej, a velocity vej of ejection, and a time step ts of integration. The values of vej varied from the parabolic velocity to 20 km/s. The values of iej varied from 15o to 90o. In most calculations, bodies started directly from the surface of the considered planet. In each variant, bodies started from one of six considered opposite points (Ipatov, 2024). Bodies that collided with planets or the Sun or reached 2000 AU from the Sun were excluded from integration. The motion of bodies was studied during the dynamical lifetime Tend of all bodies, which usually (exclusive for ejection velocities close to the parabolic velocity) equaled to a few hundreds of Myr. The fractions of bodies collided with different planets were calculated, and they were close for different considered ts. The fraction of bodies ejected from the Earth and later collided with the Moon is discussed in (Ipatov, 2024).
Migration of bodies ejected from the Earth. Most of bodies ejected from the Earth fell back onto the Earth at vej≤11.25 km/s, i.e., at vej slightly greater than the parabolic velocity. For T=10 Myr, the values pE of the probability of a collision of a body with the Earth were about 0.2-0.3, 0.12-0.2 and 0.12-0.18 at vej equal to 11.5, 12, and 14 km/s, respectively. For T=Tend such values equaled to 0.25-0.35, 0.16-0.27, and 0.12-0.2, respectively. At vej about 12-14 km/s, mean velocities of collisions with the Earth and the Moon were about 14-20 and 10-16 km/s, respectively. The ratio of the probability of collisions of bodies with the Earth to the probabilities of collisions of bodies with other planets and the Sun usually decreased with time. The probability of collisions of bodies ejected from the Earth with the Moon moving in its present orbit was about 0.006-0.01 and 0.004-0.008 at vej=12 km/s and vej≥14 km/s, respectively (Ipatov, 2024). It was concluded that a large Moon embryo should be formed close to the Earth in order to accumulate material not rich in iron. For more efficient growth of the Moon embryo, it is desirable that after some collisions of impactor bodies with the Earth, the ejected bodies did not simply fly out of the crater, but some of the matter went into orbits around the Earth, as in the multi-impact model.
For T=10 Myr, the probabilities pv of collisions of the bodies with Venus were mainly about 0.13-0.22, 0.05-0.2, and 0.03-0.15 at vej equal to 11.5-12, 14, and 16.4 km/s, respectively. At T=Tend such values were mainly about 0.23-0.37, 0.2-0.4, 0.17-0.3. The total number of ejected bodies delivered to the Earth and Venus probably did not differ much. Probabilities of collisions of bodies with Mercury were mainly less than 0.05 and 0.1 at T=10 Myr and T=Tend, respectively. This probability could be up to 0.2 for ejection from the back point of the Earth’s motion with vej≥16.4 km/s and iej≥45o. The probabilities of collisions of bodies with Mars were smaller than those with Mercury and did not exceed 0.012 and 0.025 at T=10 Myr and T=Tend, respectively. More material ejected from the Earth was delivered to Mercury than to Mars. The probabilities of collisions of bodies with Jupiter were of the order of 0.001. The fraction of bodies collided with the Sun often was between 0.2 and 0.5 at vej≥11.3 km/s. The fraction of bodies ejected into hyperbolic orbits was mainly greater for a greater ejection velocity. For T=Tend it did not exceed 0.1 at vej≤12 km/s. At vej≥16 km/s and iej≥60 degrees, all bodies were ejected from the Solar System if they started from the front (in the direction of the motion) point of the Earth.
Migration of bodies ejected from Mars. The probability pma of a collision of a body ejected from Mars with Mars did not exceed 0.04 at vej≥5.3 km/s, and pma was considerable only at vej close to the parabolic velocity. The fraction pme of bodies collided with Mercury was typically less than 0.06, with pme>pma at vej≥6 km/s. Probabilities pe and pv of collisions of bodies ejected from Mars with the Earth and Venus were about 0.1-0.2 (each) at 5.1≤vej≤6 km/s, with pv typically a little greater than pe at vej≥5.2 km/s. Usually at 5.1≤vej≤8 km/s more than a half of bodies collided with the Sun. The probability of ejection of a body into a hyperbolic orbit was less than 0.1 at vej≤6 km/s, but it could exceed 0.9 at vej=20 km/s.
Migration of bodies ejected from Mercury. Most of bodies ejected from Mercury fall back onto Mercury. Probabilities pv of their collisions with Venus typically were about 0.2-0.3 at 6≤vej≤10 km/s. Probabilities of collisions of bodies with the Earth typically did not exceed 0.02 and 0.1 at vej≤8 km/s and vej≤15 km/s, respectively. Less than 20% of ejected bodies collided with the Sun. The fraction of bodies ejected into hyperbolic orbits did not exceed 0.01 for most of calculation variants.
Acknowledgements: The studies were carried out under government-financed research project for the Vernadsky Institute.
References: Ipatov S.I. (2024) Solar System Research 58:94-111. https://doi.org/10.1134/S0038094624010040.
Levison H.F. and Duncan M.J. (1994) Icarus 108:18–36.
How to cite: Ipatov, S.: Migration of bodies ejected from the terrestrial planets, Europlanet Science Congress 2024, Berlin, Germany, 8–13 Sep 2024, EPSC2024-51, https://doi.org/10.5194/epsc2024-51, 2024.
Introduction: Impacts are prevalent across the Solar System, acting as one of the fundamental mechanisms shaping the evolution of celestial bodies from large planets to asteroids and comets. From small-scale Martian meteorites to larger biosphere-forming collisions, e.g., the Chicxulub event, impact events are essential for comprehending the dynamic history and evolution of planetary bodies. Collisions in space have been explored by missions to the near-Earth Asteroids (NEAs), leading to major advancements in characterizing Near-Earth Objects (NEOs), from JAXA's Hayabusa2 sample-return mission on asteroid Ryugu to NASA’s recent DART space mission that performed the first kinetic deflection on asteroid Dimorphos [1,2]. Up next, the Hera mission by the European Space Agency (ESA) is set to rendez-vous with Dimorphos to assess the effects of DART impact from a unique proximity in 2026 [3]. Understanding the aftermath of the DART impact, shock physics modeling emerges as a promising approach. Model simulations have thus far examined the impact cratering, ejecta plume, and momentum exchange resulting from DART-scale impactors. These analyses encompassed factors varying from the surface strength and porosity [4,5], to target layering [5,6], obliquity [7] and projectile shape [8], boulder distribution [6,9], and impact-induced gravity anomalies [10].
Methods: Interior features of near-Earth asteroids are mostly unknown. To infer what lies below the surface of asteroid Dimorphos, here we tested various interior scenarios through the iSALE-2D shock physics modeling [11-13]. Regarding the model set-up, the latest material and mechanical parameters are documented in detail for the impactor and target asteroid [14-16]. To model the porosity compaction of the target material, we use the ε-α model [13] in a wide porosity range (10-50%) for a monolithic and homogeneous interior. This process is iterated for heterogeneous interiors consisting of multiple inner layering with or without weak subsurface and strong core formation, and meter-scale boulders, including the surface boulder Atabaque, as observed by the DRACO camera onboard the DART spacecraft [17].
Results: We document the consequences of the DART collision, performing a series of hyper-velocity impact simulations considering various interior compositions and structures in iSALE-2D. Results are depicted at t=1s after impact in terms of porosity and density fields. The crater size and morphology highly rely on the asteroid strength. In the case of a homogeneous interior with a cohesion of 100kPa, a 10-meter-wide crater forms at t=1s. At a lower strength of 1 kPa the crater is 20-meter-wide at t=1s. As expected, the lower the strength, the larger is the crater diameter. Besides, the results highlight the crucial role of boulder positioning and subsurface layering in shaping crater morphology. For instance, when a half-buried boulder the size of Atabaque [17] is positioned off-center, it results in substantially deeper craters. This stems from the impact on weak and high porosity regolith (Fig. 1h), in contrast to those formed from head-on collisions with a boulder (Fig. 1i).
Perspectives and future work: For a rubble-pile asteroid with extremely low strength, the crater size can be much larger. We will include such cases as well, i.e. weak asteroids (Y0 = 1-100 Pa) with a homogeneous interior, in the next step. We will examine the impact of boulder representation in 2D axisymmetric simulations, exploring both single and double boulder configurations in three-dimensional setups using the output iSALE-3D. As the impact crater continues to collapse for several seconds after impact in the case of rubble-pile asteroids subject to low cohesions, we will comprehensively examine cratering formation over extended timeframes. To achieve this, a fast time integration scheme is implemented into the iSALE-2D code (similar to the approach documented in Ref. [15]), to thoroughly explore plausible cratering processes associated with the interior heterogeneity, as assisted by the available telescopic ejecta observations following the NASA DART impact.
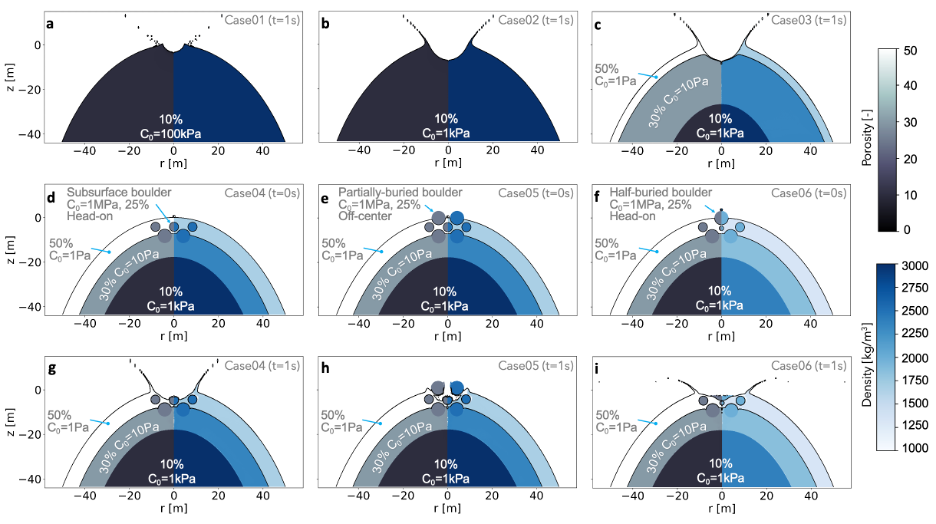
Figure 1: Effects of the DART-scale impact on the asteroid Dimorphos with different interior structures. Homogeneous interior with a cohesion of a 100 kPa and b 1 kPa with 10% porosity. c Heterogeneous interior with a strong core overlaid by a thin surface layer having a low cohesion of 1 Pa, Heterogeneous interior d with a subsurface boulder, e with a half-buried boulder, the size of boulder Atabaque, positioned off-center, f at the center. Results in d, e, and f show the initial state, while g, h, and i display corresponding cases at t=1s post-impact.
Acknowledgments: This research is financially supported by the Research Foundation Flanders (FWO) with grant: 12AM624N to C.B.S. P.C. acknowledge the support of the Vrije Universiteit Brussel (VUB) strategic program. O.K. acknowledges the support of European Union’s Horizon 2020 research and innovation program, NEO-MAPP project (grant: 870377), and the PRODEX program managed by the ESA with the help of the Belgian Science Policy Office (BELSPO). Here, we gladly acknowledge the developers of iSALE-2D shock physics model, including G. Collins, K. Wünnemann, D. Elbeshausen, T. Davison, B. Ivanov, & J. Melosh. Plots were created using pySALEPlot tool developed by T. Davison available in iSALE-2D.
References: [1] Daly et al.(2023). Nature,616(7957), 443-447. [2] Thomas et al.(2023). Nature,616(7957), 448-451. [3] Michel et al.(2022). PSJ,3(7),160. [4] Bruck-Syal et al.(2016). Icarus,269:50-61. [5] Stickle et al.(2022). PSJ,3(11),248. [6] DeCoster et al.(2024). PSJ,5(1),21. [7] Raducan et al.(2022). Icarus,374,114793. [8] Owen et al.(2022). PSJ,3(9),218. [9] Raducan et al.(2022). AA,665,L10. [10] Senel et al.(2023). LPI,2806,2598. [11] Amsden et al.(1980). LA-8095:101p. [12] Collins et al.(2004). MPS,39(2),217-231. [13] Wünnemann et al.(2006). Icarus,180(2),514-527. [14] Luther et al.(2022). PSJ,3(10),227. [15] Raducan et al.(2022). PSJ,3(6),128. [16] Raducan et al.(2024). Nature Astronomy, 8,445–455. [17] Jewit et al.(2023). AJL,952(1), L12.
How to cite: Senel, C. B., Karatekin, Ö., Luther, R., Dai, K., Zhu, M.-H., Wünnemann, K., and Claeys, P.: Inferring the interior of asteroid Dimorphos from hypervelocity DART-scale impact simulations, Europlanet Science Congress 2024, Berlin, Germany, 8–13 Sep 2024, EPSC2024-937, https://doi.org/10.5194/epsc2024-937, 2024.
Asteroids are the building blocks of the Solar System and gaining insights into their mechanical characteristics and internal structures is not only key to understanding the Solar System formation, but also essential in safeguarding Earth from potential asteroid-related hazards. Recent space missions to small asteroids, including JAXA’s Hayabusa2, NASA’s OSIRIS-Rex and DART [1] have revealed that cratering events on these bodies occur in a regime that is not yet fully understood, where the interplay of low gravity and material strength (cohesion) influences the outcomes.
The craters on asteroid surfaces are key to understanding their surface properties and evolutionary history. Impact simulations using so-called shock physics codes have been previously used to determine the target properties on asteroids based on observed craters [2]. When validated against laboratory experiments, these models become invaluable for interpreting the history of asteroids. However, the low-gravity, low-strength conditions on rubble-pile asteroids pose significant challenges for both experimental investigations and numerical modelling. In this regime, the craters formed can grow to approximately a hundred times the size of the impacting projectile over extended periods, needing considerable computational resources to accurately simulate the impact physics and replicate the final crater. Our recent work introduces a novel approach that directly employs shock physics code calculations to model the entire process of impacts in this challenging regime. This method has shown promise, notably in replicating the SCI artificial impact experiment conducted by Hayabusa2 on asteroid Ryugu [3], which helped determine the asteroid's surface mechanical properties2. However, to enhance the credibility and accuracy of our simulations, further validation through detailed laboratory impact experiments is essential.
This research focuses on the effect of gravity on the size and shape of impact craters on rubble-pile asteroids. We used the Bern SPH [4] shock physics codes to model the outcomes of recent laboratory cratering experiments conducted under simulated low-gravity environments and performed at the Institute of Space and Astronautical Science (ISAS) in Japan [5]. By validating our numerical simulations with laboratory experiments, we aim to deepen our understanding of the physical processes involved in low-gravity impacts, including the interaction between particles and the material's crushing behaviour.
The findings of this study will aid in interpreting the cratering history on asteroids Didymos and Dimorphos, targets of the upcoming ESA Hera mission in late 2026 [6]. This work is part of the Hera Impact Physics Working Group (IWG) and aims to develop new modelling strategies by integrating different numerical codes for simulating cratering on small, rubble-pile asteroids. The results from this research, and other benchmark and validation studies carried out within the Hera IWG [e.g., 7], will provide quantitative and reliable predictions about impact outcomes, which can be measured using spaceborne and in-situ instruments by the Hera mission.
Acknowledgements: S.D.R. and M.J. acknowledge support from the Swiss National Science Foundation (project number 200021_207359). S.D.R. gratefully acknowledges the support received from the Swiss Society for Astrophysics and Astronomy (SSAA) MERAC Travel Award. M. K. and A. M. N. acknowledge support by JSPS KAKENHI (grant number, JP21H01148 and JP24K17116).
References:
[1] Daly, R. T. et al. Successful Kinetic Impact into an Asteroid for Planetary Defense. Nature 1–3 (2023) doi:10.1038/s41586-023-05810-5
[2] Jutzi, M., Raducan, S. D., Zhang, Y., Michel, P. & Arakawa, M. Constraining surface properties of asteroid (162173) Ryugu from numerical simulations of Hayabusa2 mission impact experiment. Nat. Commun. 13, 7134 (2022).
[3] Arakawa, M. et al. An artificial impact on the asteroid 162173 Ryugu formed a crater in the gravity-dominated regime. Science (2020) doi:10.1126/science.aaz1701.
[4] Jutzi, M., Benz, W. & Michel, P. Numerical simulations of impacts involving porous bodies: I. Implementing sub-resolution porosity in a 3D SPH Hydrocode. Icarus 198, 242–255 (2008).
[5] Kiuchi, M. et al. Impact experiments on granular materials under low gravity: Effects of cohesive strength, internal friction, and porosity of particle layers on crater size. Icarus 404, 115685 (2023).
[6] Michel, P. et al. The ESA Hera Mission: Detailed Characterization of the DART Impact Outcome and of the Binary Asteroid (65803) Didymos. Sci. J. 3, 160 (2022).
[7] Luther R., et al. Impact Experiments and Model Validation in the frame of the Hera mission. EPSC (2024).
How to cite: Raducan, S. D., Jutzi, M., Kiuchi, M., and Nakamura, A. M.: Insights into cratering events on small asteroids from experimental and numerical simulation results, Europlanet Science Congress 2024, Berlin, Germany, 8–13 Sep 2024, EPSC2024-286, https://doi.org/10.5194/epsc2024-286, 2024.
Introduction: The late accretion phase is characterized by impacts of large differentiated bodies onto terrestrial planets. The material from these impacts could have changed Earth’s composition significantly. One noteworthy effect is that they may explain the high concentration of highly siderophile elements [HSE] in Earth’s contemporary mantle [1,2]. The likely presence of a deep magma ocean, as a consequence of giant collisions like the moon forming impact [3] necessitates a better understanding of impacts into such molten targets. To estimate the mixing of impactor material into the target body, it is essential to know both how much of the impactor stays in the mantle and how significantly it is fragmented due to the impact [4]. Different approaches have been used to analyze this problem in the past [4,5] and our work aims to expand on such studies. For this reason, we improved the treatment of fragmentation in the Eulerian shock physics code iSALE and used it to examine the effect of different impactor and target parameters on the fate of the impactor core.
Methods: We use the grid-based Eulerian shock physics code iSALE [6,7,8,9] to simulate impacts of differentiated bodies into a magma ocean. Such impact hydro codes are optimized to reproduce specific characteristics of the impact process, like the shock wave propagation or the crater formation. Small scale effects like fragmentation are in contrast insufficiently resolved and prone to artifacts. Our new method improves this and allows for a more accurate simulation of the fragmentation process down to the resolution limit of the simulation. It works by determining when fragments in the simulation reach a size close to the resolution limit and then using additional petrophysical criteria to represent fragmentation more accurately. The material of new fragments created by this method is then removed from the simulation grid and represented by particles instead.
The setup of our simulations consists of a differentiated body impacting into a magma ocean target. We vary several setup parameters, including the impact velocity and impactor size, as well as the depth of the magma ocean.
Results: Figure 1 shows the results of a simulation of an impact into a target with an infinite magma ocean depth at different time steps. It shows significant fragmentation of the impactor core in this case, both with and without the new method. The resulting fragment size frequency distributions are quite different though, with far finer fragmentation in the simulation with the new method.
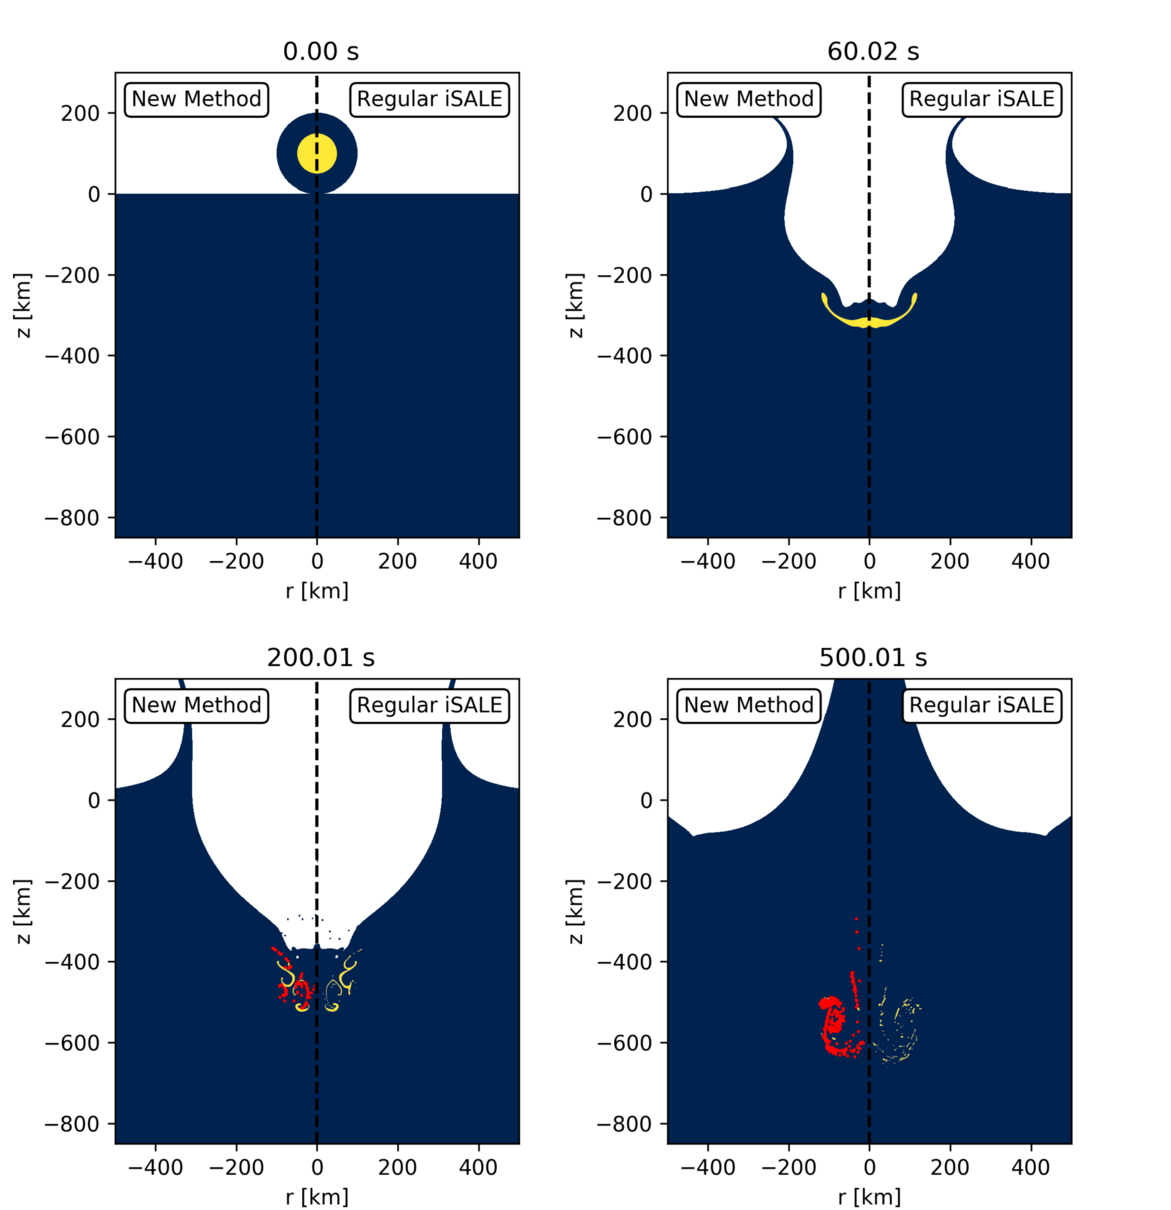
Figure 1: Simulations with and without the new method at different time steps. The impactor core is shown in yellow and the particles in the new method in red.
The exact degree of impactor core fragmentation and weather the fragments end in the core or the magma ocean varies greatly based on the specific impact conditions. Generally speaking, impactor cores can punch through shallower magma oceans, even more at high impact velocities. However, such high velocities also cause more fragmentation of the impactor cores. For great magma ocean depths of more than two to three times the impactor radius, significant fragmentation is always observed and the resulting pieces remain almost completely in the magma ocean.
Acknowledgments: We gratefully acknowledge the developers of iSALE-2D, including Gareth Collins, Kai Wünnemann, Dirk Elbeshausen, Tom Davison, Boris Ivanov and Jay Melosh. We gratefully acknowledge the developers of iSALE-3D, including Dirk Elbeshausen, Kai Wünnemann, Gareth Collins and Tom Davison. This work was funded by the Deutsche Forschungsgemeinschaft (SFB-TRR170, subproject C2 and C4).
References: [1] Wood B. J. et al. (2006) Nature 441:825-833. [2] Walker R. J. (2009) Geochemistry 69:101-125. [3] Tonks W. B. et al. (1993) Journal of Geophysical Research: Planets 98:5319-5333. [4] Daguen R. et al. (2014) Earth and Planetary Science Letters 391:274-287. [5] Kendall J. D. et al. (2016) Earth and Planetary Science Letters 448:24-33. [6] Collins. G. S. et al. (2004) Meteoritics & Planetary Science 39:217-231. [7] Wünnemann K. et al. (2006) Icarus 180:514-527. [8] Elbeshausen, D. et al. (2009). Icarus, 204(2), 716-731. [9] Elbeshausen et al. (2011). Proceedings of 11th Hypervelocity Impact Symposium (HVIS), Fraunhofer Verlag.
How to cite: Röhlen, R., Wünnemann, K., Allibert, L., Maas, C., and Hansen, U.: Breaking or Entering? The Fate of Asteroid Cores During Impact Into a Magma Ocean., Europlanet Science Congress 2024, Berlin, Germany, 8–13 Sep 2024, EPSC2024-816, https://doi.org/10.5194/epsc2024-816, 2024.
Introduction. Hermean Permanently Shadowed Regions (PSRs) have been suggested to contain water ice deposits, based on radar and neutron observations. These regions can provide thermally stable environments for water ice on geologic timescales [1]. Images and reflectance measurements highlighted the presence of bright and low-reflectance materials, suggesting that ice deposits can be both exposed at the surface and insulated by 10−30 cm of a carbon-rich material sublimation lag [1, 2, 3, 4].
Water ice could have been delivered by (1) a continuous flux of water-bearing micrometeoroids [5], or (2) few individual and large impacts of comets and/or hydrated asteroids [3, 6]. Based on the relative purity of water-ice deposits and the correlation between the polar crater age and the percentage extension of their PSRs, both sources could have contributed to the ice deposit formation (e.g., [7]).
A key point to determine which source is responsible of the water-ice delivery is the quantification of the projectile mass ratio that remains within the planet’s gravity. During an impact, a cometary nucleus is subject to extreme pressures and temperatures, which are sufficient to completely vaporize its constituent ices [8]. According to numerical simulations on the Moon, much of this vapor escapes lunar gravity within seconds, but a significant portion remains gravitationally bound as a transient atmosphere before migrating to cold traps [9, 10]. The final goal of this study is to investigate the fate of cometary projectiles when they impact on the Hermean surface and quantify the fraction that remains within the planet’s gravity.
Methods. A systematic numerical investigation has been carried out by means of iSALE shock physics code (e.g., [11, 12, 13, 14]). The target is assumed to be made by either a single basaltic sheet or by a more complex stratigraphy, including a water ice layer on top or within it. Different surface temperatures will be considered (Tmin=120 K, Tmean=300 K, Tmax=450 K [15]). The projectiles are assumed to be of ice composition, with diameters ranging from small (1 to 1000 µm) to large (>1 m) sizes, and velocities of 20 and 40 km/s, respectively, in the two cases [16].
Results. In this work, we present the very preliminary results of these numerical simulations. The modelling cases with the smaller projectiles aim at investigating the hypothesis (1), i.e., continuous flux of water-bearing micrometeoroids (Fig. 1). On the other hand, the impacts of larger projectiles represent the second case, where water ice is delivered to the surface by means of single events (Fig. 2).
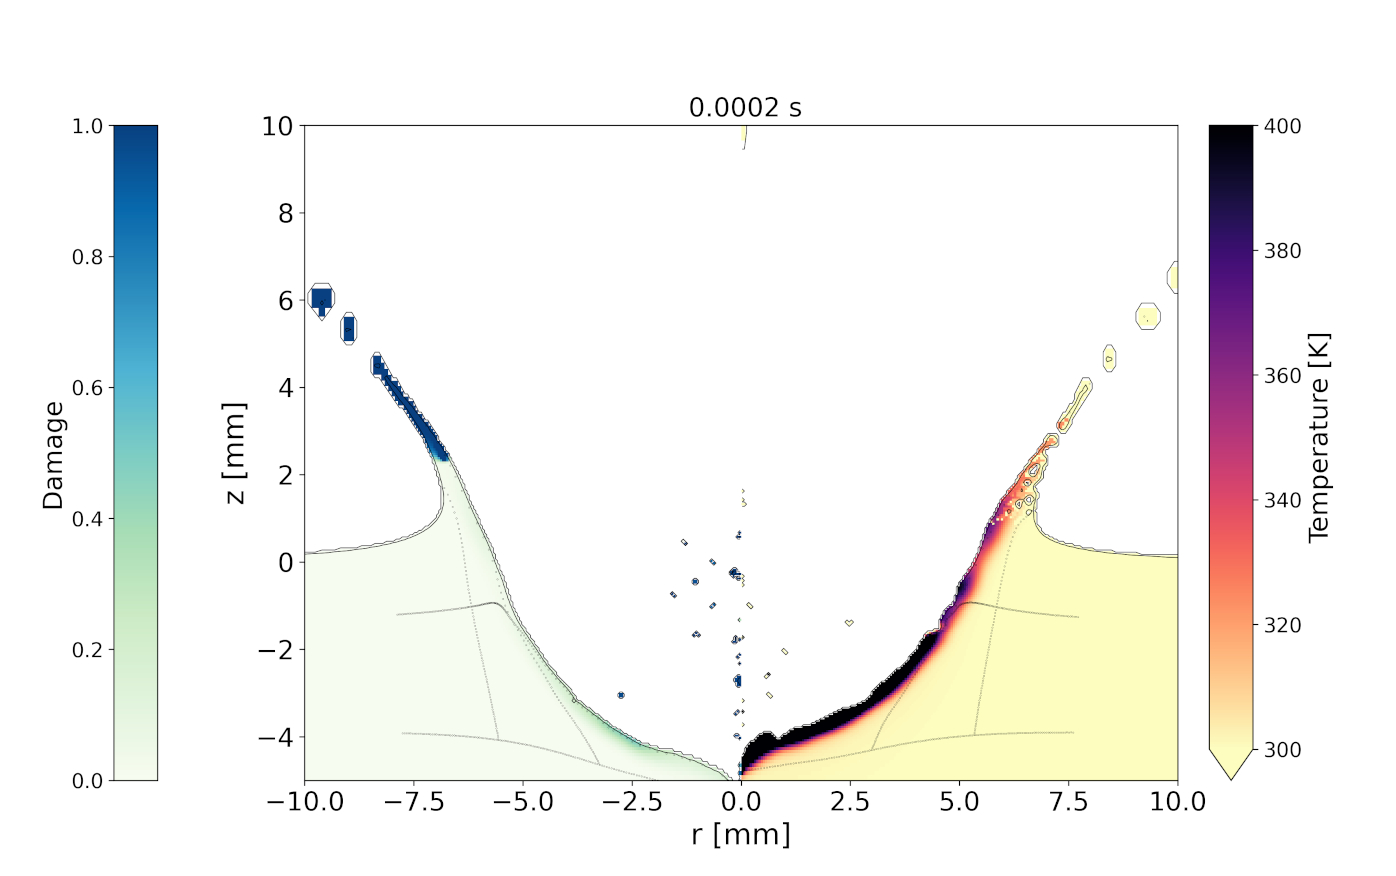
Figure 1. Excavation stage of a 1 mm ice projectile impacting at 20 km/s on the surface, with temperature of 300 K. The left and right panels show the cases where a target cohesion of 1 kPa and 50 kPa was respectively set.
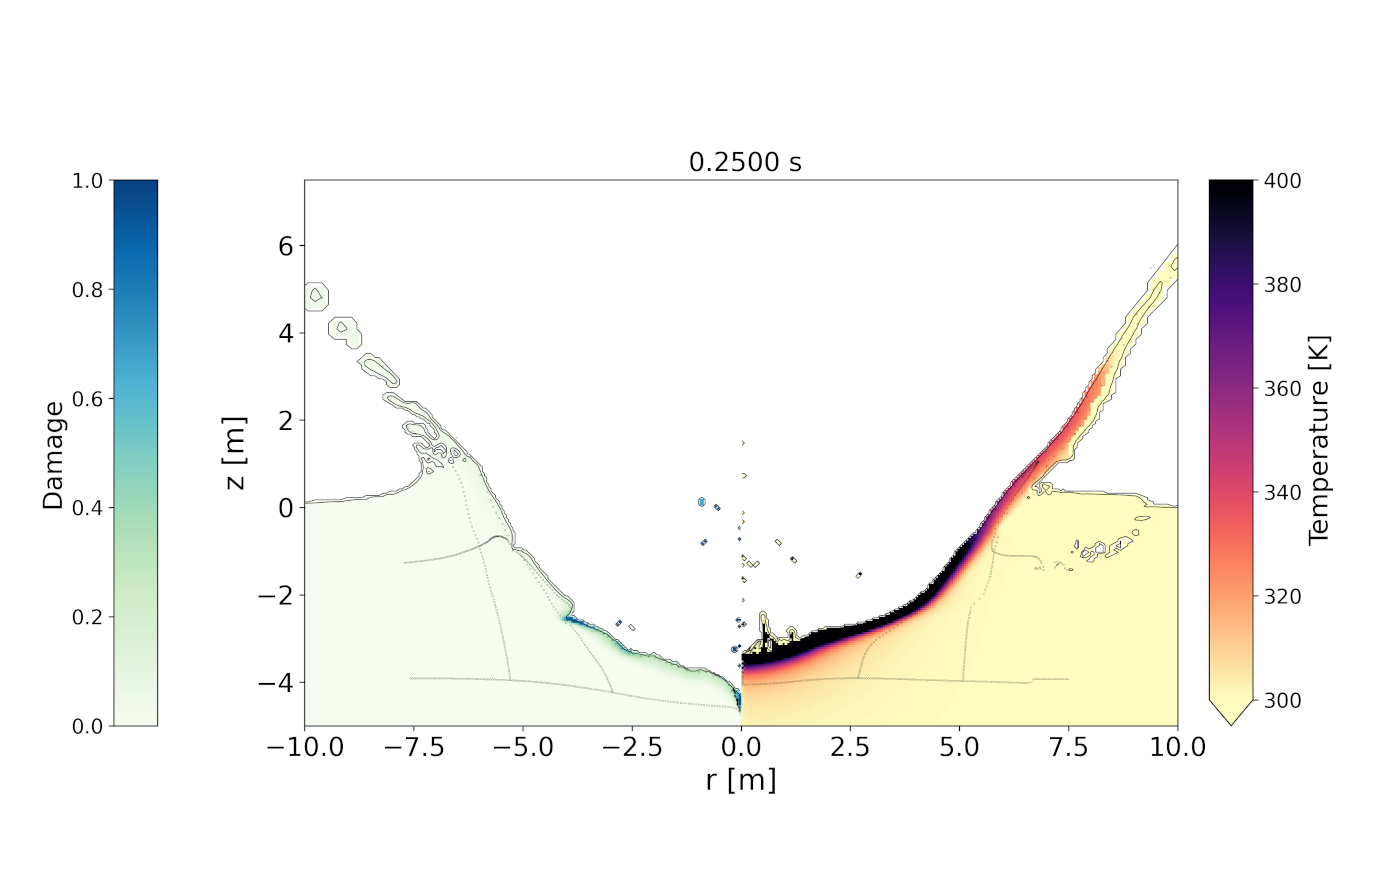
Figure 2. Excavation stage of a 1 m ice projectile impacting at 40 km/s on the surface, with temperature of 300 K. The left panel shows the model where the surface is assumed as regolith layer, described by the Drucker-Prager strength model, whereas the right panel reports the model where the surface was described by a pressure and damage-dependent strength model [13].
Discussion and Conclusions. According to the results presented by [7], a sample of craters on the northern Hermean pole exhibits an increasing trend between the crater age and the extent of the radar bright material on their PSRs, supporting hypothesis (1) However, a few of the studied craters are outliers, being much younger compared to the ice deposit.
One such example is Fuller crater, 27 km in diameter, located at 82.63°N, 317.35°E. Remote sensing data underlies the presence of a zone within its floor at very low temperature, where water ice could have remained stable over geological timescales. Preliminary numerical simulations to reproduce the craters suggests that it could have been formed by a km-sized comet (Fig. 3).
In the case the impact occurred in the night-side (Fig. 3, left panel), the post-impact temperatures are lower than 300 K on the floor of the modelled crater. This is area within the Fuller crater where ice deposit is expected.
Future work will include the investigation of the projectile fate.
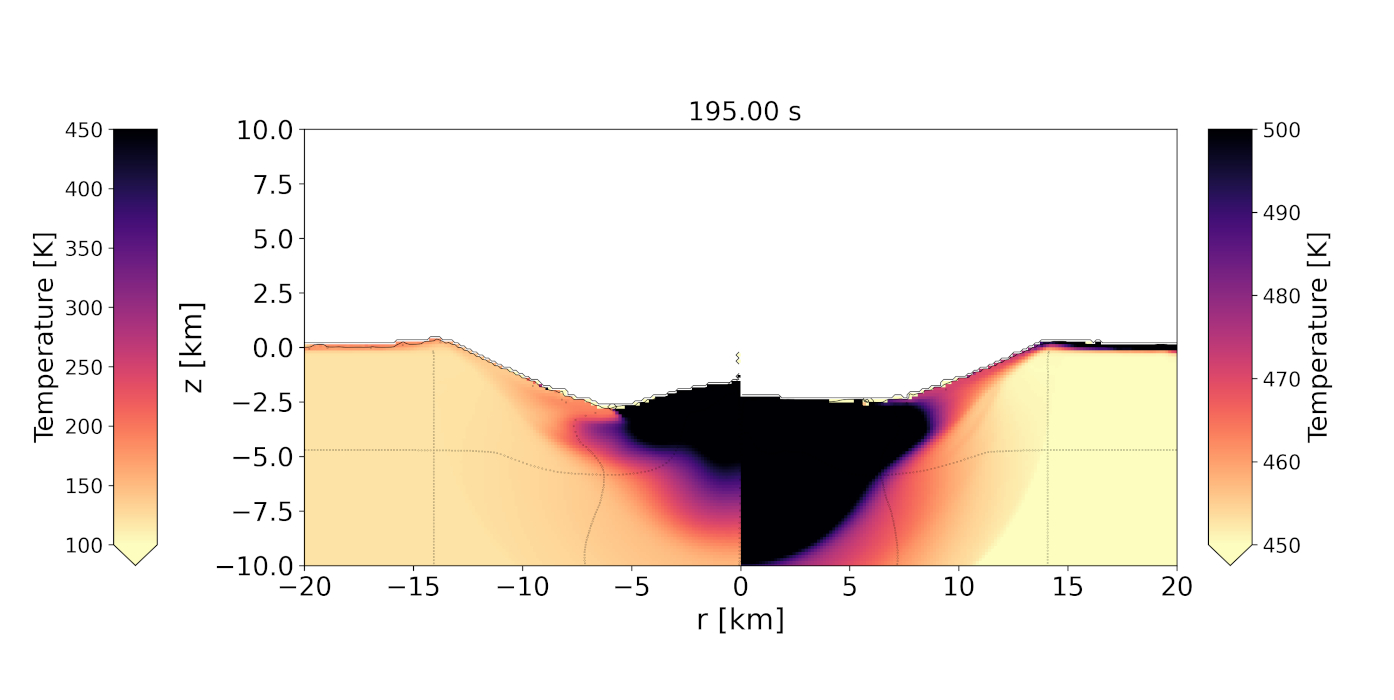
Figure 3. Final stage of the model reproducing Fuller crater (D=27 km) by an impact of a comet of 1.4 km in size striking the surface at 20 km/s. The left and right panels represent the models with a surface temperature of 120 K and 450 K, respectively, in order to compare the cases of an impact occurred on the night or day side.
Acknowledgements.
The study is part of the INAF MINI-GRANTS (2023) “Origin of water ice on Mercury” (CUP C93C23008450001).
References.
[1] Chabot, N.L. et al. (2014) Geology 42, 1051−1054. [2] Deutsch, A.N. et al. (2019) Earth Planet Sci Lett 520, 26−33. [3] Neumann, G.A. et al. (2013) Science 339, 296−300. [4] Paige, D.A. et al. (2013) Science 339, 300−303. [5] Frantseva, K. et al. (2022) Icarus 383, 114980. [6] Ernst, C.M. et al. (2018) J Geophys Res Planets 123, 2628–2646. [7] Bertoli, S., et al. (2023) XVIII CNSP, 02/2023, Perugia, Italy. [8] Pierazzo E. & Melosh H.J. (2000) Meteoritics & Planet Sci 35, 117−130. [9] Ong L. et al. (2010) Icarus 207, 578−589. [10] Stewart, B.D, et al. (2011) Icarus 215, 1−16. [11] Amsden et al. (1980) Los Alamos Nat Lab Rep LA−8095, 101 pp. [12] Collins et al. (2016) iSALE-Dellen manual, figshare. [13] Collins et al. (2004) Meteorit Planet Sci 39, 217−231. [14] Wünnemann et al. (2006) Icarus 180, 514−527. [15] Cambianica, et al. Planet and Space Sci., under rev. [16] Borin, P. et al. (2016) A&A 585, A106.
How to cite: Martellato, E., Bertoli, S., Borin, P., and Cambianica, P.: Numerical modelling of impact craters within the Hermean Permanent Shadowed Regions, Europlanet Science Congress 2024, Berlin, Germany, 8–13 Sep 2024, EPSC2024-1263, https://doi.org/10.5194/epsc2024-1263, 2024.
Introduction:
Lunar impact flashes have been observed from Earth since 1999 [1]. To date, over 600 impact flashes have been detected by individuals as well as multiple observation campaigns [2], including the NASA Lunar Impact Monitoring Program, the MIDAS project, and the NELIOTA project. The record of flashes has been analysed statistically to estimate the current near-Earth meteorite flux and size distribution [3], though the results of such estimates rely on some assumptions about the relationship between the radiative energy of the flashes and impactor velocity and kinetic energy.
Luminous efficiency, the fraction of impactor kinetic energy that is transformed into light emission during the impact process, is a poorly constrained value. Common estimates range over three orders of magnitude, from 10-2 to 10-4 [4]. Recent modelling work produced a detailed model of the radiant process in the impact debris cloud and fit well to the observed flash using calculated impactor properties [5]. Their work builds on previous studies considering the physics of the radiant process, indicating that vaporized material in the instant of impact cannot provide enough thermal radiance to account for impact flash magnitude, and most of the light from impact flashes is created by thermal radiance of droplets of melted ejecta [1]. However, they did not fit their model to the observed diameter and depth of an associated crater.
Method:
We seek to improve the constraints on luminous efficiency by modelling simplified analogues of observed impact flashes with known associated craters. Here, we use the iSALE-Dellen shock physics code [6,7,8] to model the 17 March 2013 lunar impact flash and crater [Fig. 1], adjusting the impact parameters to best replicate the known factors of the impact and match the resultant crater size. Target porosity, modelled by the ε-α-porosity compaction model [8,9], is set at a homogeneous 42% and a vertical impact in a 2D cylindrical model is used for computational efficiency. We use the Drucker-Prager strength model and the ANEOS equation of state to model the lunar regolith. Then, we determine the volume of melted ejecta produced in each impact as a proxy for radiance, and vary velocity-mass balance and target porosity parameters to study the effect on ejected melt volume. Crater data permitting, we will also study additional, recently identified flash-crater pairs [10,11,12].
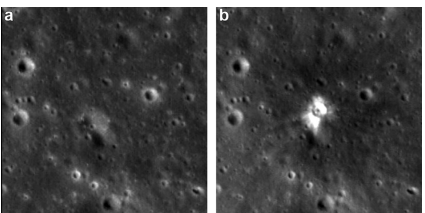
Figure 1: Crater identified with 17 March 2013 impact flash. a: before, b: after. [13]
Results:
We show some preliminary results of our first study models in the plot below. Peak pressure on target material is plotted (in Pa x1e10). Material above the black curve is ejected as the model proceeds. All material is shown in position at t=0. The resolution of this model (10 CPPR) is not sufficient for a detailed analysis of peak pressure and melt volume; 40 CPPR resolution will yield a better result, reducing uncertainty to <10% [14]. Critical shock pressure for melt production in regolith at 42% porosity is estimated at no higher than 24 GPa [14]. Our preliminary model shows only a small sliver of overlap between melt volume and ejecta volume, much lower than the 20-30% of melt ejected in [15], suggesting a low luminous efficiency in this impact.
Figure 2: Peak pressure on target material for modelled 17 March 2013 impact. Material above the black curve is ejected. Material above 24 GPa peak pressure is assumed melted.
Conclusion:
Further study of the details of thermal radiance of the ejected melt will be left to a future study, enabling a connection from impact parameters to luminous efficiency via melt volume. This work could also be expanded through use of 3D models with realistic replication of the estimated impact angles of known impact flash craters, as well as more detailed, layered target rock properties.
References
[1] Yanagisawa, Masahisa et al. (2002), Icarus 159 (1), pp. 31–38. DOI: 10.1006/icar.2002.6931.
[2] Sheward, D. et al. (2024), MNRAS 529 (4), pp. 3828–3837. DOI: 10.1093/mnras/stad2707.
[3] Avdellidou, Chrysa et al. (2021), Planetary and Space Science 200, p. 105201. DOI: 10.1016/j.pss.2021.105201.
[4] Ortiz, J. L. et al. (2000), Nature 405 (6789), pp. 921–923. DOI: 10.1038/35016015.
[5] King, Patrick K. et al. (2022), 16th Hypervelocity Impact Symposium. DOI: 10.1115/HVIS2022-28.
[6] Amsden, A. et al. (1980), LANL, LA8095:101.
[7] Collins, G.S. et al. (2004), Meteoritics & Planetary Science 39:217–231. DOI: 10.1111/j.1945-5100.2004.tb00337.x.
[8] Wünnemann, K. et al. (2006), Icarus 180, pp. 514-527. DOI: 10.1016/j.icarus.2005.10.013.
[9] Collins, G. et al. (2011), Int. J. Imp. Eng., 38:434-439. DOI: 10.1016/j.ijimpeng.2010.10.013,
[10] Sheward, Daniel et al. (2021), Europlanet Science Congress 2021. DOI: 10.5194/epsc2021-590.
[11] Sheward, D. et al. (2022), MNRAS 514 (3), pp. 4320–4328. DOI: 10.1093/mnras/stac1495.
[12] Sheward, Daniel et al. (2024), EGU General Assembly 2024, Abstract EGU24-1216. DOI: 10.5194/egusphere-egu24-1216.
[13] Robinson, Mark S. et al. (2015), Icarus 252, pp. 229–235. DOI: 10.1016/j.icarus.2015.01.019.
[14] Liu, T. et al. (2022), JGR Planets 127 (8), Article e2022JE007264, e2022JE007264. DOI: 10.1029/2022JE007264.
[15] Luther, R. et al. (2017), 48th Annual Lunar and Planetary Science Conference (1964), p. 3012. Bibcode: 2017LPI....48.3012L.
How to cite: Rice, P., Luther, R., and Wünnemann, K.: Modelling Lunar Impact Flashes from Molten Ejecta, Europlanet Science Congress 2024, Berlin, Germany, 8–13 Sep 2024, EPSC2024-560, https://doi.org/10.5194/epsc2024-560, 2024.
1. Introduction
The quantity of space debris—defunct human-made objects in orbit—continues to increase, including old satellites, spent rocket stages, and fragments resulting from disintegration, erosion, and collisions. Space debris poses a significant risk for space travel and satellite operations, as even small pieces, traveling at high velocities, can cause substantial damage or destruction upon colliding with satellites or spacecraft. This growing accumulation increases the risk of collisions, poten tially triggering a cascade effect known as the Kessler Syndrome, which could render certain orbits unusable for future satellites.
Despite the impending threat to space infrastructure, measures to mitigate space debris are insufficiently implemented, primarily due to high associated costs. Furthermore, existing regulations are often more akin to recommendations than mandatory directives. A solution with potential economic benefit is to collect larger objects (e.g. a Ariane 5 upper stage in the geostationary transfer orbit), and to transport this material to the lunar surface, where the metal can be used in future projects [1]. To facilitate recycling, the debris is planned to impact the Moon at velocities ranging from 0.5 − 3.0 km/s. Upon impact, the debris would break down, and the resulting fragments would be collected by moon rovers. In this study, we analyze the effect of impact velocity and target parameters on the fate of the projectile and the resulting crater, using numerical simulations.
2. Methods
In this study, we apply iSALE-2D shock physics code [2-4] to simulate the impact of an Ariane 5 ESC-A upper stage (4540 kg, 5.4 m in diameter, 4.711 m in height [5]) onto lunar regolith at velocities from 0.5 − 3 km/s. A realistic representation with thin walls is computationally expensive as it requires a large model resolution. Here, we consider four representations of the projectile: We represent the Ariane upper stage as 1) a small homogeneous cylinder with the density of aluminum alloy 2219 (ρ=2840 kg/m³), 2) a porous cylinder of the same mass, and a correct volume of the projectile, using the epsilon-alpha porosity compaction model [4], 3) a homogeneous cylinder of the same mass and volume but instead of using the porosity model, we modify the density specified in the equation of state, and 4) a hollow cylinder with resolved walls and end caps. We use a grid spacing of 0.2 and a resolution of 14 cells per projectile radius in vertical and horizontal direction.
The projectile and target are simulated by a Tillotson equations of state [6]. It is designed for high-velocity impact computations and hence capable of handling the relevant pressure ranges for this study. A granular behavior is assumed for the regolith target. Therefore the Drucker-Prager strength model with the strength Y=min(Y0+μp,Ym) is used, where Y0 is the cohesion (yield strength at zero pressure), μ is the coefficient of internal friction for material, Ym is the limiting strength at high pressure and p is pressure. The parameters for the regolith are taken from [7], including porosity model parameters. We apply the Von Mises strength model for the aluminum of the upper stage: Y=Y0. For the porous projectile representation, we derive an elastic threshold based on the Youngs modulus and the yield strength as: ε=315 MPa / 73 GPa=0.004. Both values for this equation are taken from [8].
3. Results
Here, we show results generated using a porous projectile. We observe, as expected, that with increasing kinetic energy, the radius and depth of the crater increase as well (Figure 1). For the slowest impact of 0.5 km/s, the crater grows to ∼ 18 m in diameter, while it reaches ∼ 32 m for an impact at 3 km/s. The faster impact also generates a more heterogeneous pressure distribution (Figure 2).
We find that in the case of the slower impact, the resulting crater is relatively shallow (Figure 2 top panel), with a depth-diameter ratio of 0.17, while it reaches 0.25 for the fastest impact (Figure 2 bottom panel).
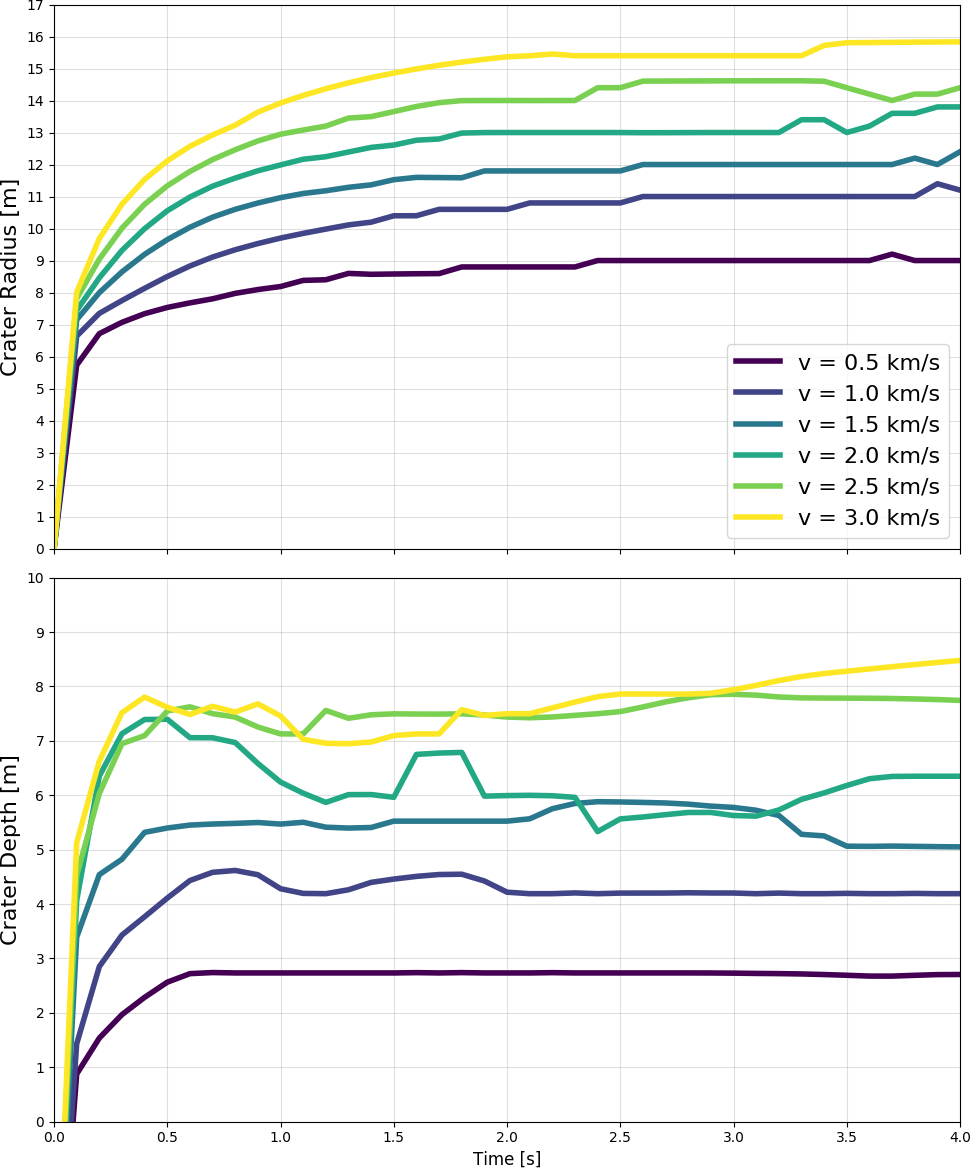
Figure 1: Simulated crater radii and depths from the instant of impact until 4 seconds after impact.

(2a) Impact velocity vimpact = 0.5 km/s .

(2b) Impact velocity vimpact = 3.0 km/s .
Figure 2: Crater snapshot at 4 seconds after impact. The pressure and density are plotted on the left and right halves, respectively.
4. Discussion & Conclusion
The plotted depth in Figure 1 (lower panel) occasionally deviates from the final value, which is likely due to numerical artefacts or residual material close to the symmetry axis. An adjustment of the analysis procedure can reduce this noise.
The study investigates lunar surface recycling of space debris, specifically through the high-velocity impact simulation of an Ariane 5 upper stage on lunar regolith. The method's potential in repurposing space debris for lunar construction is promising, contributing to sustainable lunar exploration efforts. However, anomalies in pressure distribution and crater rim identification suggest simulation refinement.
References
[1] F. Koch. 8th European Conference on Space Debris, 8(1), 2021.
[2] A.A. Amsden, H.M. Ruppel, and C.W. Hirt. Technical Report LA-8095, 5176006, June 1980.
[3] G.S. Collins, H.J. Melosh, and B.A. Ivanov. Meteoritics & Planetary Science, 39(2):217–231, February 2004.
[4] K. Wünnemann, G.S. Collins, and H.J. Melosh. Icarus, 180(2):514–527, February 2006.
[5] R.Lagier et al. User’s Manual, (1), 2021.
[6] J. H. Tillotson. Technical report, July 1962.
[7] R. Luther et al. The Planetary Science Journal, 3(10):227, October 2022.
[8] C.Y. Ho, J.M. Holt, and H. Mindlin. Number Bd. 2. Cindas/Purdue Univ., 1997.
How to cite: Langer, N., Luther, R., Wünnemann, K., Koch, F., and Linke, S.: From Debris to Resource: Simulating High-Velocity Impacts of Space Debris on the Moon, Europlanet Science Congress 2024, Berlin, Germany, 8–13 Sep 2024, EPSC2024-956, https://doi.org/10.5194/epsc2024-956, 2024.
Introduction Recent advancements in computational power and model sophistication have revolutionized the study of hypervelocity impacts on asteroids, enabling the exploration of broader parameter spaces and more intricate asteroid structures [1, 2]. The outcome of such collisions, including crater formation and catastrophic disruption, is intricately linked to the internal structure of asteroids. However, the nature of this relationship remains an open question, necessitating further investigation. The Material Point Method (MPM), renowned for its ability to accurately track interfaces and resolve contact problems, emerges as a powerful tool for numerical simulations in this context [3]. By harnessing the capabilities of MPM, we aim to shed light on the correlation between an asteroid's structural composition and its response to hypervelocity impacts, ultimately contributing to a deeper understanding of the underlying physical processes.
Method Developed from the particle-in-cell numerical method, the Material Point Method (MPM) combines Eulerian and Lagrangian descriptions, making it well-suited for handling boundary conditions and interface problems. By utilizing a dynamic background grid that only creates nodes with mapped material points for efficient computation, we further implement a contact algorithm in our MPM framework that could accurately calculate the real contact and friction force on each interface, and novelly extend the contact correction from two-object to multi-object scenarios.
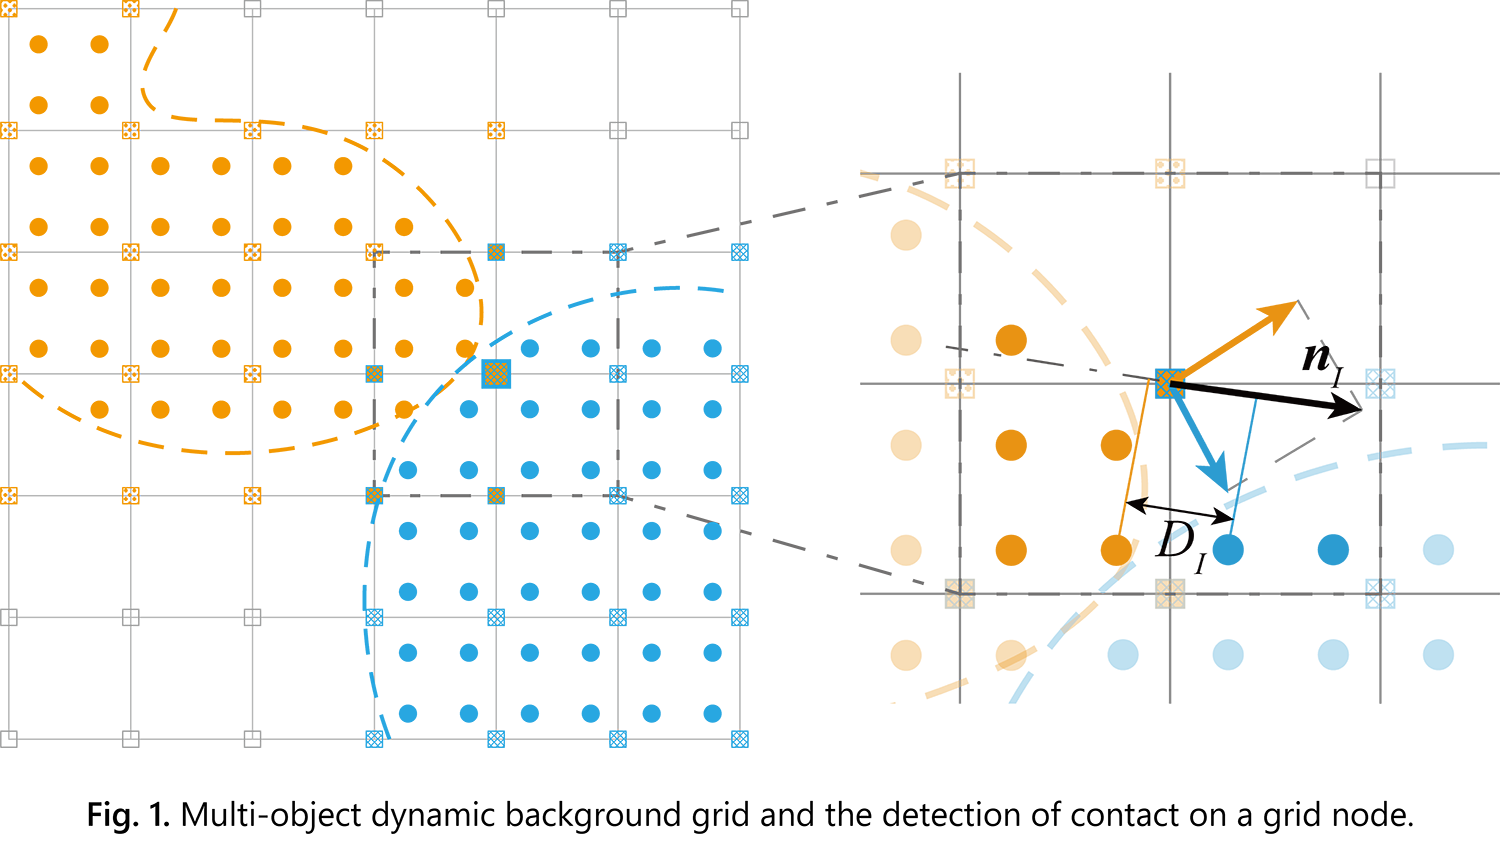
When the contact algorithm is activated, if a background grid node is shared by multiple objects, separate node information will be created for each object, along with the associated material point indices, as illustrated in Fig. 1. The execution of contact correction is triggered by assessing both the distance between objects and their relative motion based on non-penetration constraints. It is implemented by applying contact forces to eliminate penetration and enforce suitable friction conditions. Multi-body contact is resolved by solving a linear system of equations for the unknown contact forces between each pair of interacting objects. This algorithmic enhancement bolsters the capability of our MPM code to precisely simulate hypervelocity impacts on asteroids with intricate internal structures.
Simulation and Discussion In this study, we conduct numerical simulations of artificial hypervelocity impacts on asteroids to quantitatively investigate the distinct dynamic responses of rubble-pile asteroids compared to monolithic, homogeneous ones. We employ material parameters of typical basaltic rocks in our simulations [4]. The impact scenarios and results for rubble-pile asteroids are illustrated in Fig. 2. Considering the crucial role of the catastrophic disruption threshold in understanding the evolutionary history of small celestial bodies and designing asteroid impact defense missions, as well as the availability of numerical values for specific asteroid sizes from previous research [5], we aim to quantify the influence of porosity and internal interfaces on impact disruption mechanisms by calculating the catastrophic disruption threshold for rubble-pile asteroids with various configurations.
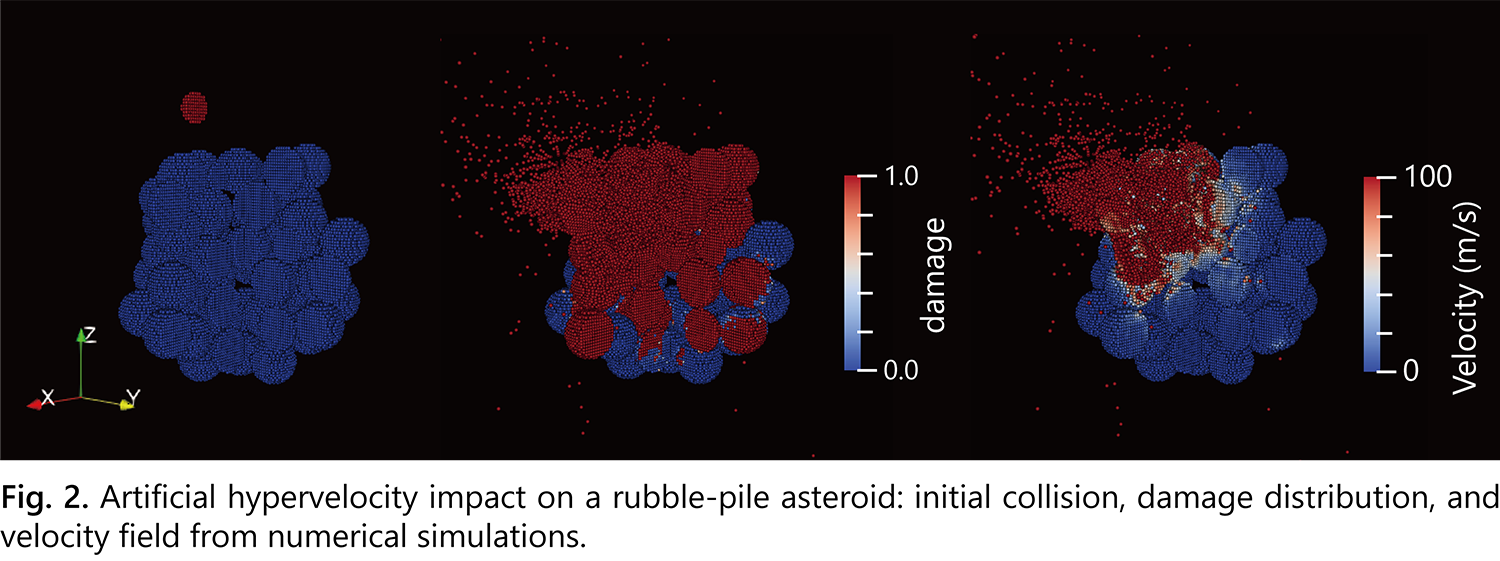
Our simulation results demonstrate the significant impedance effect of internal interfaces on shock wave propagation, leading to a substantially higher catastrophic disruption threshold for rubble-pile asteroids compared to monolithic asteroids of the same strength. This finding suggests that the presence of a rubble-pile structure enhances the resistance of asteroids to catastrophic disruption, which has important implications for understanding their fragmentation and reassembly processes throughout their evolutionary history.
Furthermore, the quantitative analysis of the catastrophic disruption threshold for different rubble-pile configurations provides valuable insights into the role of porosity and internal structure in the impact response of asteroids. These findings contribute to the development of more accurate models for asteroid evolution and can inform the design of future asteroid impact defense strategies. Additionally, the results of this study have the potential to facilitate the calibration of asteroid ages based on their structural properties and impact history, enhancing our understanding of the chronology of asteroids in the solar system.
Acknowledgment X.Y. and J.L. acknowledge support from the National Natural Science Foundation of China under Grant 12372047. X.Y. acknowledges support from the National Natural Science Foundation of China under Grant 62227901. P.M. acknowledges support from the French space agency CNES and from the French National Centre for Scientific Research (CNRS) through the exploratory research program of the Mission for Transversal and Interdisciplinary Initiatives.
References [1] Raducan, S. D. et al. (2024). PSJ. 5(3). [2] Jutzi, M. et al. (2022) Nat. Commun. 13(1), 7134. [3] Yan, X. et al. (2023) ACM Conference. [4] Jutzi, M. (2015) P&SS. 107(1), 3–9. [5] Benz, W. et al. (1999) Icar. 142, 5–20.
How to cite: Yan, X., Zhou, W., Liu, Y., Michel, P., and Li, J.: Quantifying the effect of asteroid structure on hypervelocity impact outcomes with the Material Point Method, Europlanet Science Congress 2024, Berlin, Germany, 8–13 Sep 2024, EPSC2024-1111, https://doi.org/10.5194/epsc2024-1111, 2024.
Introduction: Large craters and basins that are present on the lunar surface are remants of its early impact history. The relative ages of geological surfaces can be determined with crater size-frequency distribution (CSFD) measurements using a production function (PF), since the impact record on the lunar surface is related to time. Widely used PFs were developed by Neukum (1983) and Neukum et al. (2001) [1,2] and are valid for crater diameters between 0.01–300 km. However, to understand the earlier history of the Moon, when larger impacts were more abundant, an extension of the valid crater diameter range to larger diameters would be beneficial. It could provide input for understanding the number of impactor populations [e.g., 1-4] and the stability of the impact rate on the Moon [e.g., 1,2,5,6]. However, the precise determination of the main basin rim diameter, especially for multi-ring basins, is challenging due to their complex and degraded morphology.
Method: The diameters of large craters and basins were measured based on topographic (~100 m/pixel) and gravity data. We used the Lunar Reconnaissance Orbiter (LRO) Wide Angle Camera (WAC) image mosaic [7], LRO Lunar Orbiter Laser Altimeter Digital Elevation Model (LOLA DEM) [8], and the WAC DEM color-shaded relief map [9,10]. In addition, the following geophysical data were used: Gravity Recovery and Interior Laboratory (GRAIL) [11] data, a crustal thickness map (Crustal Thickness – Model 1) [12], and a Bouguer anomaly map [11].
In order to have a consistent measurement of the main basin rim diameter, we follow the approach of Neumann et al. (2015) [13]. They [13] compared the Bouguer anomaly, which reflects changes in the subsurface and/or crustal thickness, with well-preserved basin structures. They suggest that double the diameter of the Bouguer anomaly is consistent with the main or reference rim for multi-ring basins.
The ArcGIS CraterTools add-in [14] was used to perform the CSFD measurements, which were then further analyzed with Craterstats2 [15]. The count area is the entire Moon, but due to significant differences between mare and highlands areas, we subdivide the count area "Entire Moon" into "Highlands" and "Mare".
Results & Discussion: We identified 311 craters and basins with diameters between 100-1250 km over the entire Moon. We do not include the South Pole Aitken (SPA) basin as it is unclear which topographic ring is its reference rim and it is assumed to have formed in an even earlier era of lunar basins [16]. The CSFD measurements (Figure 1) of the entire Moon and the highlands are consistent up to diameters of 250 km. However, while the highlands distribution progresses relatively smoothly towards large basin diameters, the CSFD of the entire Moon shows a "step" between 400-700 km. The CSFD of the mare areas is significantly different from the two other areas. Craters <200 km are less abundant than on the other two areas, and craters and basins >250 km are more abundant. The CSFD measurements for the entire Moon and the lunar highlands are better represented by the PF of [2] using the valid crater diameter range of 100-300 km. The mare areas could not be fitted with either PF.
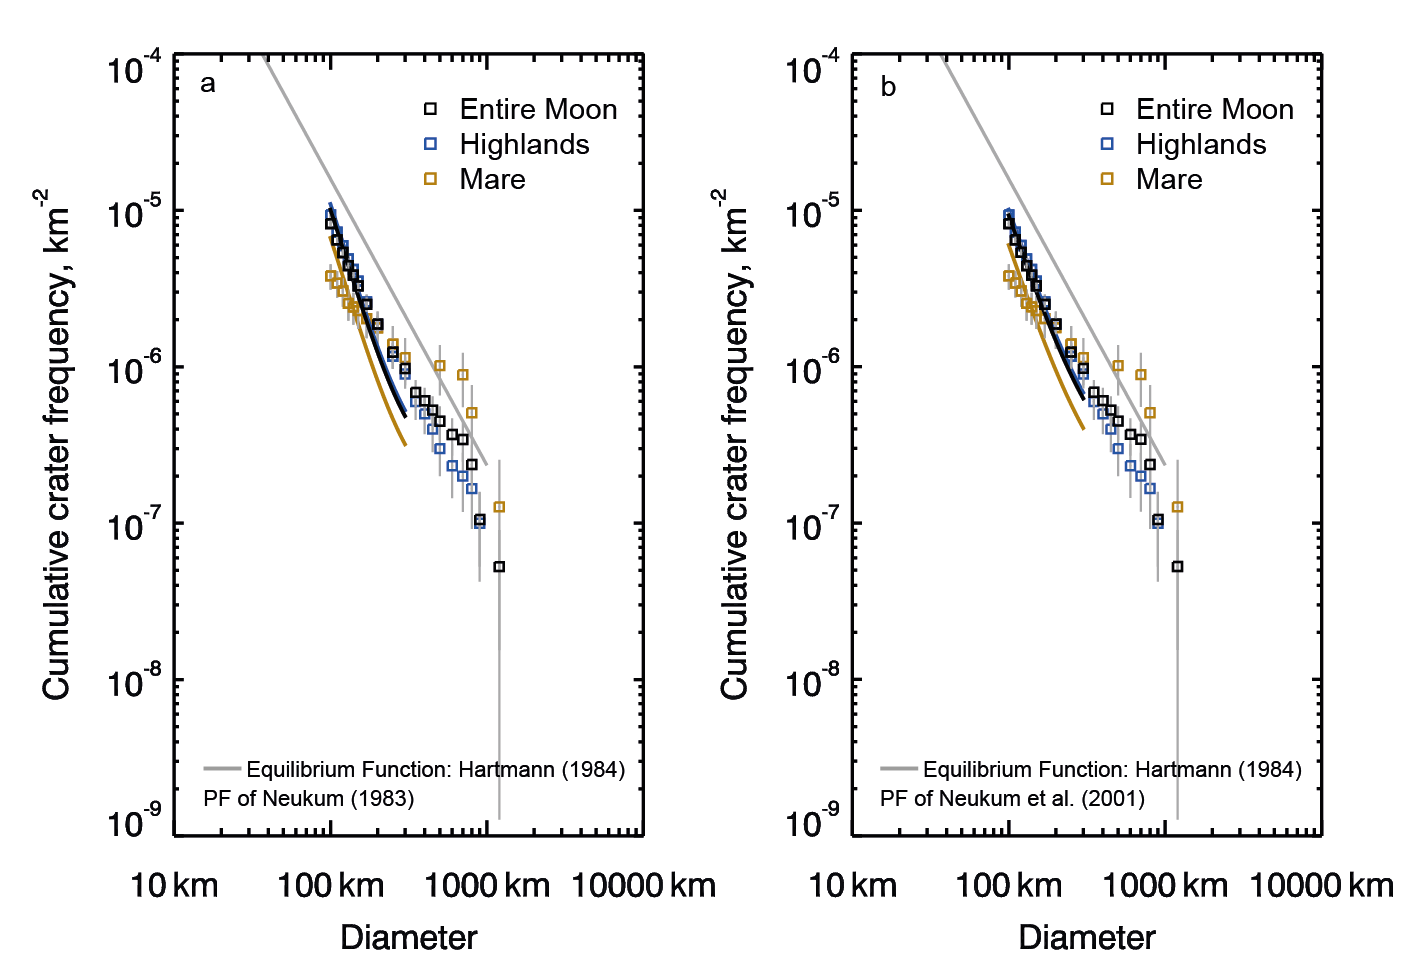
Figure 1: Cumulative CSFD plots for large craters and basins compared with existing PFs (black and blue curves) (a) [1] and (b) [2] in the valid crater diameter range of 100-300 km. The gray line represents the equilibrium function of [17].
The significant difference between the CSFDs on highlands and mare areas may result from:
(1) lava flooding [18,19], causing an incomplete identification of basins on the mare areas
(2) asymmetries in cratering rate, e.g. due to the rotation and inclination of the Moon [20,21]
(3) larger basin diameters resultant on the lunar nearside due to a different subsurface temperature and crustal thickness [16]
Conclusion: The CSFD measurements indicate that large craters and basins are still in production and, therefore, an extension of PFs for craters and basins from 300-1250 km could be possible. This extented crater diameter range would allow to draw conclusions about the number of impactor populations and the stability of the impact rate in the early lunar history. However, the influence of resurfacing processes on mare units compared to the highlands is not yet entirely understood and a more detailed analysis of the mare regions is necessary.
Acknowledgments: This Project is funded by the Deutsche Forschungsgemeinschaft (DFG, German Research Foundation) – Project-ID 263649064 – TRR 170.
References: [1] Neukum G. (1983) Habil. Thesis LMU, Munich. [2] Neukum G. et al. (2001) Space Sci. Rev., 96, 55. [3] Strom R.G. et al. (2005) Science, 309(5742), 1847-1850. [4] Head J.W. et al. (2010) Science, 329(5998), 1504-1507. [5] Guinness E.A. and Arvidson R.E. (1977) Proc. Lunar Sci Conf., 8, 3475-3494. [6] Bottke W.F. et al. (2005) Icarus, 179(1), 63-94. [7] Robinson M.S. et al. (2010) Space Sci. Rev. 150, 81-124. [8] Smith D.E. et al. (2010) Space Sci. Rev., 150, 209-241. [9] Scholten F. et al. (2012) JGR, 117(E12). [10] Smith D.E. et al. (2010) GRL, 37(18). [11] Zuber M.T. et al. (2013) Science, 339(6120), 668-671. [12] Wieczorek M.A. et al. (2013) Science, 339, 671-675. [13] Neumann G.A. et al. (2015) Sci. Adv., 1(9), e1500852. [14] Kneissl T. et al. (2011) PSS, 59(11-12), 1243-1254. [15] Michael G. et al. (2016) Icarus, 277, 279-285. [16] Miljković K. et al. (2013) Science, 342(6159), 724-726. [17] Hartmann W.K. (1984) Icarus, 60(1), 56-74. [18] Evans A.J. (2016) Geophys. Res. Lett., 43, 2445-2455. [19] Evans A.J. (2018) JGR, 123, 1596-1617. [20] Wiesel W. (1973) Icarus, 15(3), 373-383. [21] Le Feuvre M. and Wieczorek M.A. (2011) Icarus, 214(1), 1-20.
How to cite: Oetting, A., Iqbal, W., Heyer, T., Schmedemann, N., Head, J., Michael, G., Hiesinger, H., and van der Bogert, C.: Evaluation of large craters and basins for lunar production functions, Europlanet Science Congress 2024, Berlin, Germany, 8–13 Sep 2024, EPSC2024-372, https://doi.org/10.5194/epsc2024-372, 2024.
Introduction: The determination of the minimum velocity (v) required for impact ejecta to form secondary craters (secondaries) constitutes a pivotal parameter in elucidating various aspects of impact dynamics, including the extent of mixing between primary ejecta and secondary-excavated local materials, the volumetric proportions of primary ejecta capable of forming secondaries, etc. Nonetheless, there exists a notable scarcity of information regarding this parameter. Typical secondaries formed on terrestrial bodies exhibit distinctive morphologies (e.g., herringbone-shaped tertiary ejecta) consistent with clustered impact origin [1–3]. Modelling impacts of clustered fragments in porous target recorded formation of craters at velocities as low as ~20 m/s [4]. However, the application of v derived from laboratory simulations to terrestrial bodies is not straightforward due to that the cratering efficiency of low-velocity impacts is strongly correlated to surface gravities and target properties. Considering the influence of actual planetary surface conditions on the formation of secondaries, investigations into the diameter-range distribution of continuous chains of secondaries have been employed to deduce the size-velocity distribution of impact ejecta that are capable to form secondaries [5–7]. These works suggest that secondaries can originate from ejecta with velocities as low as ~50 m/s on the Moon [6], ~200 m/s on Mars [5], and ~300 m/s on Mercury [7]. However, comprehensive observations of secondaries occured nearest to the rims of their parent craters are not conducted yet on either the Moon or terrestrial bodies.
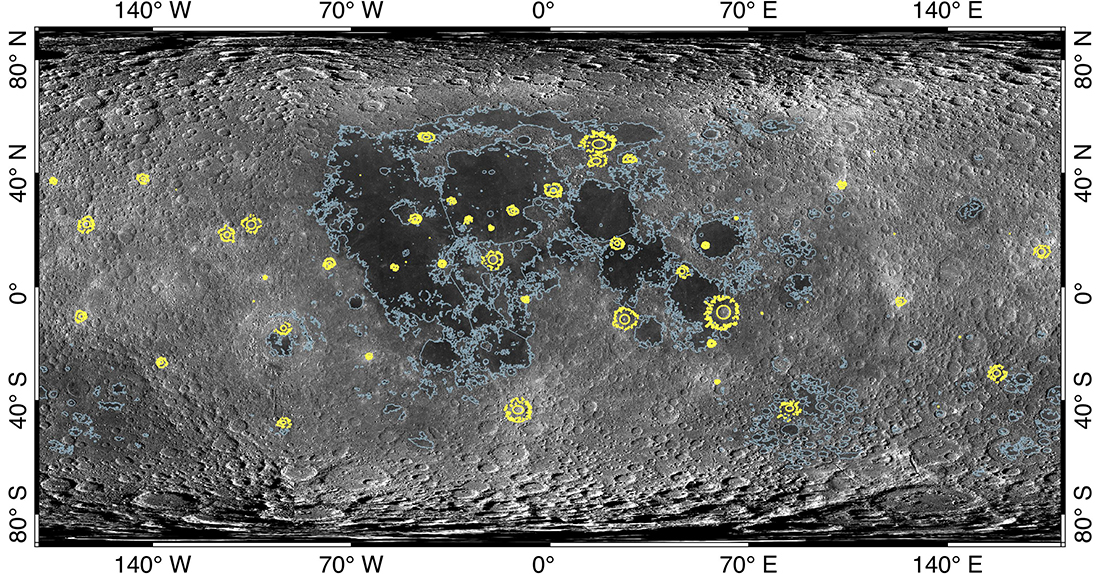
Fig. 1. Mapping example of nearest secondaries (yellow dots) on the Moon. Grey polygons outline the lunar mare regions [8].
Methods: In this work, using regional and global optical images and topographical data, we conduct a systematic mapping (53 craters with rim-to-rim diameter D=0.4–140 km on the Moon, 35 craters with D=23–122 km on Mercury and 43 craters with D=11–213 km on Mars) of the nearest secondaries surrounding relatively young primary craters that have diverse diameter sizes and target properties on the Moon, Mercury, and Mars (e.g., Fig. 1). Through comprehensive documentation of radial occurrence distances (L) and rim-to-rim diameters (d) pertaining to nearest secondaries, we derive estimations for the minimum v under ballistic flight and corresponding equivalent sizes of ejecta requisite for the formation of secondaries.
Preliminary Results: We found that in the vicinity of young craters with similar rim-to-rim diameters on terrestrial bodies, the radial occurrence distances (L) and rim-to-rim diameters (d) of the nearest secondaries are statistically comparable, irrespective of the target properties and the surface gravities (Fig. 2a–c), with the exception of smaller secondaries on Mars, where high-dispersion effect of water/ice on ejecta fragments may account for such variation. Ejecta with velocities exceeding ~25 m/s are capable of forming secondaries around craters with diameters less than 0.5 km, with surface gravity identified as the principal determinant (Fig. 2d). Nevertheless, encircling larger primary craters, ejecta launched at higher velocities constitute continuous ejecta deposits, indicating that potential secondaries are not preserved due to destruction by subsequent landing ejecta. These relationships (L vs. D, d vs. D and v vs. D) can function as predictive tools for determining the positions of possible nearest secondaries on Earth and Venus, and offering valuable insights into the formation conditions of self-secondaries and tertiary craters.
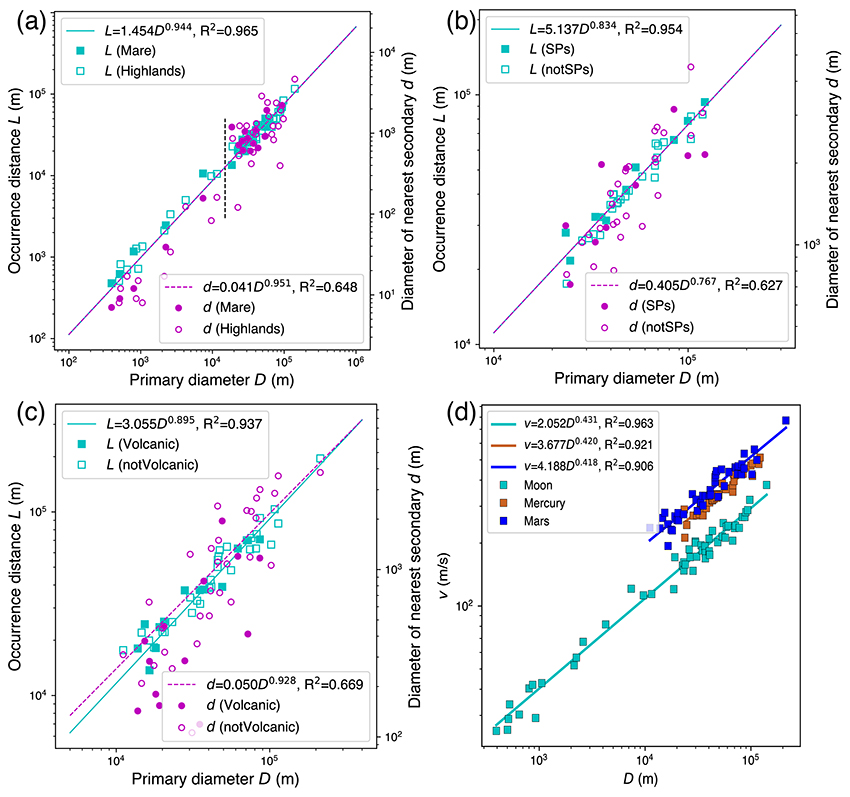
Fig. 2. Locations and sizes of the nearest secondaries around young craters with different target properties (i.e., lunar mare/highlands, mercurian smooth plains (SPs)/not SPs, Martian volcanic units/not volcanic units) on the Moon (a), Mercury (b), Mars (c), and the minimum secondary-forming velocities on these bodies (d).
Acknowledgments: This research is supported by the National Natural Science Foundation of China (423B2205; 42241108; 42273040; 62227901), the Strategic Priority Research Program of Chinese Academy of Science (XDB41000000) and China Scholarship Council (202306380194).
References:
[1] Oberbeck, V. R. & Morrison, R. H. Laboratory simulation of the herringbone pattern associated with lunar secondary crater chains. The Moon 9(3–4), 415–455 (1974).
[2] Xiao, Z. Size-frequency distribution of different secondary crater populations: 1. Equilibrium caused by secondary impacts: equilibrium caused by secondaries. J. Geophys. Res. Planets 121, 2404–2425 (2016).
[3] Xu, R., Xiao, Z., Luo, F., Wang, Y. & Cui, J. Untrackable distal ejecta on planetary surfaces. Nature Communications 14(1), 1173 (2023).
[4] Schultz, P. H. & Gault, D. E. Clustered impacts: Experiments and implications. J. Geophys. Res. 90, 3701–3732 (1985).
[5] Vickery, A. M. Size-velocity distribution of large ejecta fragments. Icarus 67, 224–236 (1986).
[6] Singer, K. N., Jolliff, B. L. & McKinnon, W. B. Lunar Secondary Craters and Estimated Ejecta Block Sizes Reveal a Scale‐Dependent Fragmentation Trend. JGR Planets 125, e2019JE006313 (2020).
[7] Xiao, Z. et al. Comparisons of fresh complex impact craters on Mercury and the Moon: Implications for controlling factors in impact excavation processes. Icarus 228, 260–275 (2014).
[8] Hiesinger, H., Head, J. W., Wolf, U., Jaumann, R. & Neukum, G. Ages and stratigraphy of lunar mare basalts: A synthesis. Recent advances and current research issues in lunar stratigraphy 477, 1–51 (2011).
How to cite: Xu, R., Xiao, Z., Wang, Y., Luo, F., and Ma, Y.: Minimum velocity of forming secondary craters on terrestrial bodies, Europlanet Science Congress 2024, Berlin, Germany, 8–13 Sep 2024, EPSC2024-477, https://doi.org/10.5194/epsc2024-477, 2024.
Comparative planetological studies suggest that subsurface fluidization during ejecta emplacement may play a significant role in the formation of double-layered ejecta (DLE) craters, not only on Mars but potentially on other planetary bodies like Ceres or Ganymede. On Mars, DLE crater formation likely involved water or water-ice in the near-surface substrate. For the formation process it is hypothesized that volatile-rich rock debris flows driving the outer layer's emplacement and the inner layer moving as a translational slide.
This process results in two superimposed ejecta morphologies with striated surfaces, rampart, and moat structures. Although morphological features, especially the ejecta blankets, have largely been destroyed for most terrestrial impact structures, recent studies have revealed that Lonar crater in India, Ries crater in Germany, and Bosumtwi crater in Ghana possess ejecta ramparts similar to Martian DLE impact craters.
In this study we can show the typical striated DLE morphologies to be preserved in the subsurface contact of the different ejecta layers for the Ries crater and suggest that this might be the case for other terrestrial DLE craters as well, as long as multiple layers can be found. In a recent field study, we were able to confirm the presence of two distinct ejecta layers at least for Lonar crater in India, similar to the Ries crater in Germany. Additionally, we conducted a detailed study involving drone photogrammetry, rock magnetics, micro-fracture network analysis, and geophysical investigations using a 100 MHz bi-static ground-penetrating radar (GPR) system at Lonar. These findings were compared to similar observations made for the ejecta of the Ries crater in Germany, where additional electric resistivity tomography (ERT) corroborates the findings of the GPR.
By studying terrestrial analogs, such as Lonar crater, we aim to constrain boundary conditions for DLE crater formation on other planets, specifically regarding the volatile content of the affected crust. Lonar, with its smaller diameter compared to Martian DLE craters, offers valuable insights into DLE formation variability. Moreover, Lonar can serve as an analogue laboratory for Martian DLE craters in basalt regions such as Hesperia Planum. Lastly, our findings shed light on the temporal variability of landforms in connection to the formation conditions required for DLE craters on Mars, which mostly occur at mid-latitudes and scarcely in the southern hemisphere, mirroring past climatic evolution for both Ries and Lonar crater.
How to cite: Wilk, J., Agarwal, A., and Dey, G.: Unraveling Double-Layered Ejecta: Lessons from Lonar Crater and Beyond, Europlanet Science Congress 2024, Berlin, Germany, 8–13 Sep 2024, EPSC2024-1138, https://doi.org/10.5194/epsc2024-1138, 2024.
JAXA’s Martian Moon eXploration (MMX) sample return mission aims to solve the long-debated origin of Martian moons Phobos and Deimos [1].
This will be the first attempt to sample an object that either formed in the outer solar system and implanted [2,3] into the terrestrial planet region by a major dynamical process (the first origin scenario); or formed from a large impact and subsequently accumulated material from two, very possibly compositionally different, bodies, i.e. Mars and the impactor (the second scenario). In either scenario, impact processes by asteroids, meteoroids as well as Martian eject have altered the surfaces of the Martian moons and require investigation to study several aspects such as the crater formation and exposure of fresh sub-surface material, the comminution of surface boulders and regolith production, and the delivery of exogenous materials. To provide a frame for the MMX data interpretation, a laboratory experimental campaign is proposed simulating the impact processes on Phobos.
We will present the preliminary results of our laboratory investigation of impact experiments using Phobos simulant materials at the Impact Lab of the University of Kent.
Acknowledgements: We acknowledge CNES and ESA-OSIP funding for initiating this work.
References:
1. Usui et al. Space Science Reviews 216, Issue 4, article id.49 (2020).
2. Levison et al. Nature 460, Issue 7253, pp. 364-366 (2009).
3. Vokrouhlicky, Bottke, Nesvorny. The Astronomical Journal 152, Issue 2, article id. 39, 20 pp. (2016).
How to cite: Avdellidou, C., Finch, E., Spathis, V., Tandy, J., Wozniakiewicz, P., Alesbrook, L., and Burchell, M.: Experimental investigation of impact cratering on Phobos, Europlanet Science Congress 2024, Berlin, Germany, 8–13 Sep 2024, EPSC2024-1002, https://doi.org/10.5194/epsc2024-1002, 2024.
Traditional strain estimation techniques, such as the Fry and the Rf/Phi method, have been extensively used in tectonically deformed rocks [1]. However, their applicability in impact rocks has not been explored yet. An essential difference between tectonic and impact cratering-led deformation is that the former causes strain rates in the order of 10-15-10-6 s-1 [2], while the latter leads to a much higher strain rate, ~10-2-106 s-1 [3]. Furthermore, peak pressures in tectonic deformation are in the order of hundreds of megapascals [4], whereas, in the case of naturally shocked rocks, the shock pressures are in the range of gigapascals [5].
To address this, an impact cratering experiment was carried out on a quartzite block to investigate the efficacy of these traditional and spectroscopic tools in determining strain in weakly shocked rocks (Fig. 1). A basalt projectile of diameter 6.18mm was accelerated to a velocity of ~5km/s and impacted a quartzite block, Taunus quartzite from Germany.
The block was sawed through the crater centre. Twelve cores were recovered from the target surface and the sawed (sub-) surface each. Each cylinder was bisected in half to produce 24 specimens, each from the target and subsurface. Specimens 5.1 to 5.24 were from the target surface, whereas the subsurface specimens were labelled 6.1 to 6.24. Specimens 5.1 to 5.12 and 6.1 to 6.12 were from the top half of the cylindrical core obtained from the target surface and subsurface, respectively. Similarly, 5.13 to 5.24 and 6.13 to 6.24 were from the lower half of the cylindrical core obtained from the target surface and the subsurface, respectively.
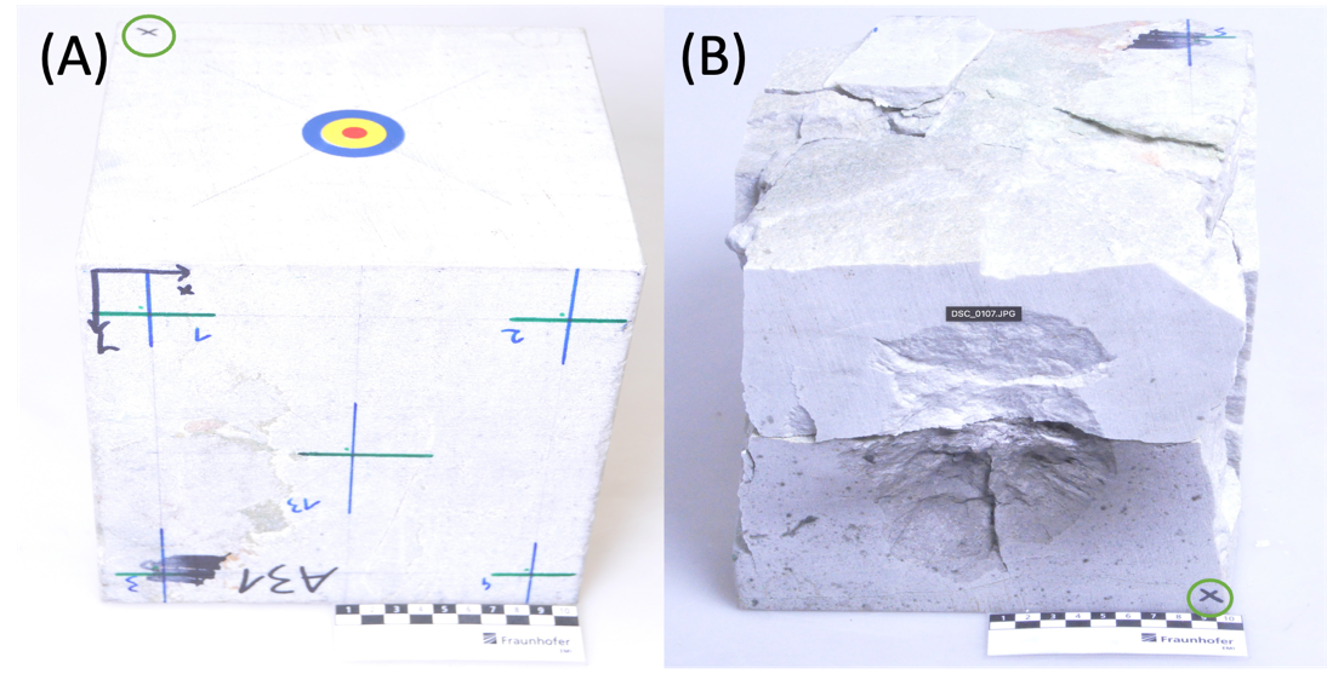
Figure 1: Photographs of the Taunus quartzite block (edge length 20 cm) (A) before and (B) after the impact experiment. The block was split into several pieces after the experiment. The top/target surface is marked with “Top” and “X” inside a green circle. Note the different orientations of the block in the two images.
Strain analysis was carried out using three methods: (1) Fry, (2) Rf/Phi, and (3) X-ray Diffractometry (XRD) in the impacted Taunus quartzite. These results were then compared to simulated strains in the transient stage from hydrocode modelling (Fig. 2). Radial fractures were observed on the target surface but not in the subsurface in the thin section images (Fig. 3). Results demonstrably suggest that the strain measured using the three methods is similar to the results from the hydrocode simulations. Furthermore, these techniques are sensitive enough to capture strain imparted at shock pressures as low as 0.23 GPa (obtained from hydrocode modelling) at the transient crater stage (at 25 µs post impact).
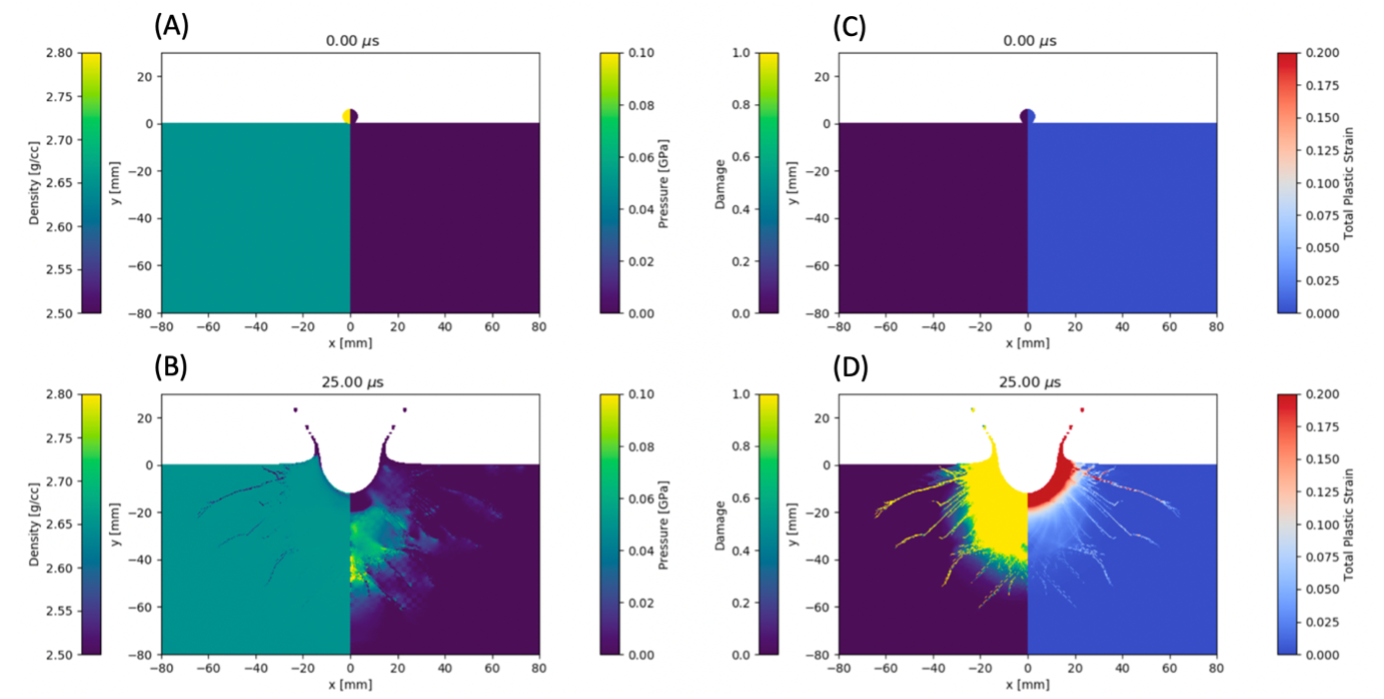
Figure 2: Results from hydrocode simulation. (A-B) show pressure and density distribution, and (C-D) show damage and total plastic strain at 0 ms and 25 ms. Simulation is run till the end of the transient cratering stage and before the arrival of the reflected wave from the free surface.
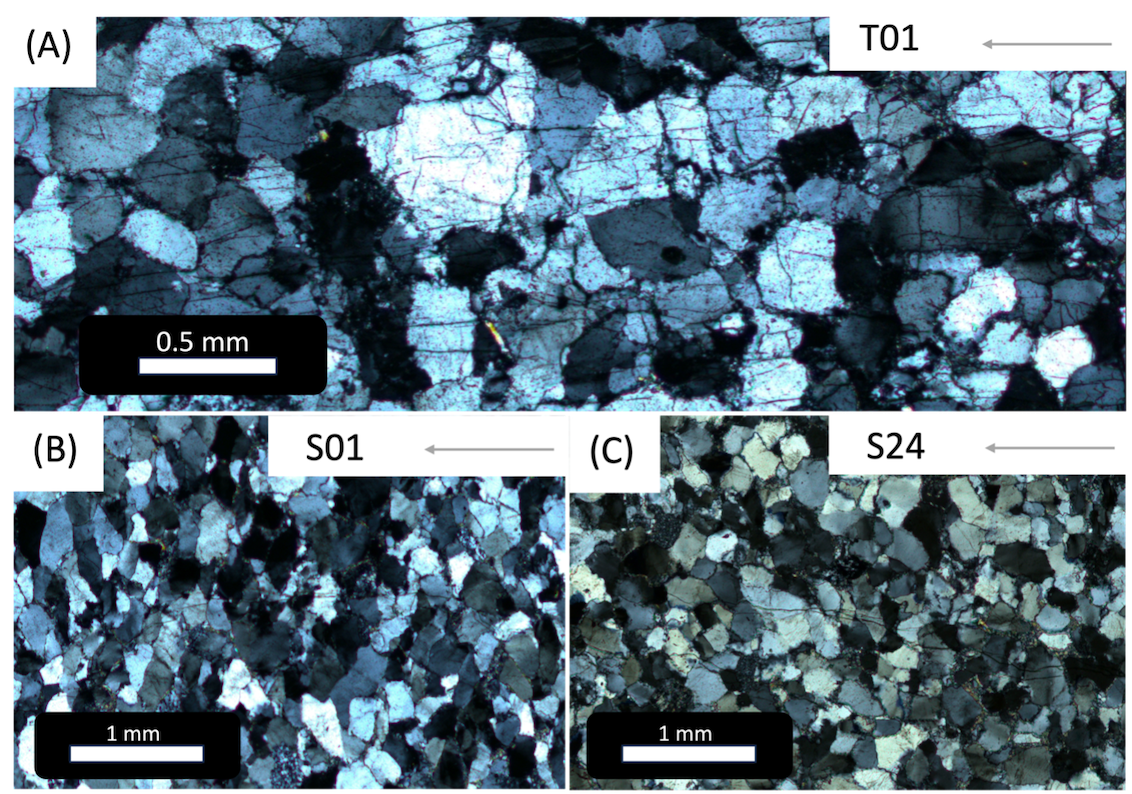
Figure 3: Thin section images from the experiment. The arrows indicate the direction of the point of impact. (A) Sample T01 is on the target surface and closest to the point of impact, (B) sample S01 is on the subsurface and just below the point of impact, whereas (C) sample S24 is the point farthest away from the point of impact. Note the radial tensile fractures in the target surface in (A) (parallel to the arrow indicating the direction of the impact point) and their absence in the subsurface (B and C).
However, caution is advised while using Fry and Rf/Phi methods, as grain fracturing and pulverisation may affect the grain centre distribution and grain shape, thus leading to anomalous results. The use of the lattice technique, XRD, can be investigated further to understand the accuracy and efficacy in low-strain conditions.
Acknowledgements:
We thank the Dept. of Earth Sciences at the Indian Institute of Technology-Kanpur for microscopy and XRD facilities. The authors are also grateful to Dr. Auriol Rae for his input and help on the hydrocode simulation. We are also thankful to Dr. Gaurav Joshi for his suggestions. Yashwant Singh helped in the Fry analysis.
References:
[1] Joshi, G., et al. (2017). Microstructures and strain variation: Evidence of multiple splays in the North Almora Thrust Zone, Kumaun Lesser Himalaya, Uttarakhand, India. Tectonophysics 694, 239–248.
[2] Pfiffner, O. A., et al. (1982). Constraints on geological strain rates: Arguments from finite strain states of naturally deformed rocks, J. Geophys. Res., 87(B1), 311–321.
[3] Ramesh, K. T. (2008). High Rates and Impact Experiments. In: Sharpe, W. (eds) Springer Handbook of Experimental Solid Mechanics. Springer Handbooks. Springer, Boston, MA.
[4] Vaughan-Hammon, J. D., et al. (2021). Alpine peak pressure and tectono-metamorphic history of the Monte Rosa nappe: evidence from the cirque du Véraz, upper Ayas valley, Italy. Swiss J Geosci 114, 20.
[5] Engelhardt, W. V., et al. (1969). Shock induced planar deformation structures in quartz from the Ries crater, Germany. Contr. Mineral. and Petrol. 20, 203–234 (1969).
How to cite: Das, R., Agarwal, A., Ojha, A., Kenkmann, T., and Poelchau, M.: Efficacy of classical and spectroscopic techniques for strain quantification in weakly shocked rocks: Results from experimentally impacted Taunus quartzite, Europlanet Science Congress 2024, Berlin, Germany, 8–13 Sep 2024, EPSC2024-437, https://doi.org/10.5194/epsc2024-437, 2024.
Introduction
Meteorites are commonly divided into two principal groups: chondrites, which represent unmelted accretionary aggregates, and achondrites, which are products of melting and planetary differentiation [1]. The coexistence of chondrites and achondrites is traditionally interpreted as the result of a spatial and/or temporal dichotomy in the population of planetesimals in the early solar system [2–4], and it is consequently envisaged by meteorite classification schemes that no single planetary body could be the parent body of both chondritic (i.e., unmelted) and achondritic (i.e., melted) meteorites. Yet, evidence of protracted accretion and partial differentiation of planetary bodies exists in the meteorite inventory, as recently illustrated for the parent body of the IIE iron meteorites [5]. While initially refuted based on the view that hypervelocity impacts did not facilitate widespread melting of cold planetesimals [6], hypervelocity impacts onto chondritic parent bodies during early time steps of solar system history, when heat-producing decay of short-lived radionuclides was ongoing, might have governed partial differentiation of chondritic planetary bodies [7–9]. A few individual H chondrites such as Pultusk [10] and Gao-Guenie [11], several meteorites recovered from LaPaz Icefield [12], and anomalous achondrites such as Dar al Gani 896 [13] might indeed show direct evidence of this process. However, it has remained unclear if hypervelocity impacts could have facilitated partial planetary differentiation as envisaged, for example, for the asteroid 6 Hebe [7]. Here we report on the H5 melt breccia Boutel Fil (b), which next to unmelted domains of H5 chondrite composition contains abundant achondritic domains of impact-melt origin in which metals and silicates separated in the liquid state.
Results
Boutel Fil (b) was found while searching for meteorites in the Boutel Fil strewn field, Chari-Baguirmi, Chad. It was recognized because it looks strikingly different from the fresh LL6 Boutel Fil chondrite individuals that form the strewn field. It is also distinct from the nearby Djermaia H3–6 chondrite. Petrographic analysis revealed that Boutel Fil (b) is a partly fusion-crusted, chondritic melt breccia composed of H5 regions in abundant melt rock matrix (Fig. 1A). The H5 regions are crosscut by shock melt veins and contain partly flattened chondrules with a mean diameter of about 0.3 mm (Fig. 2A). Olivine in the chondrules is Fa18.1.
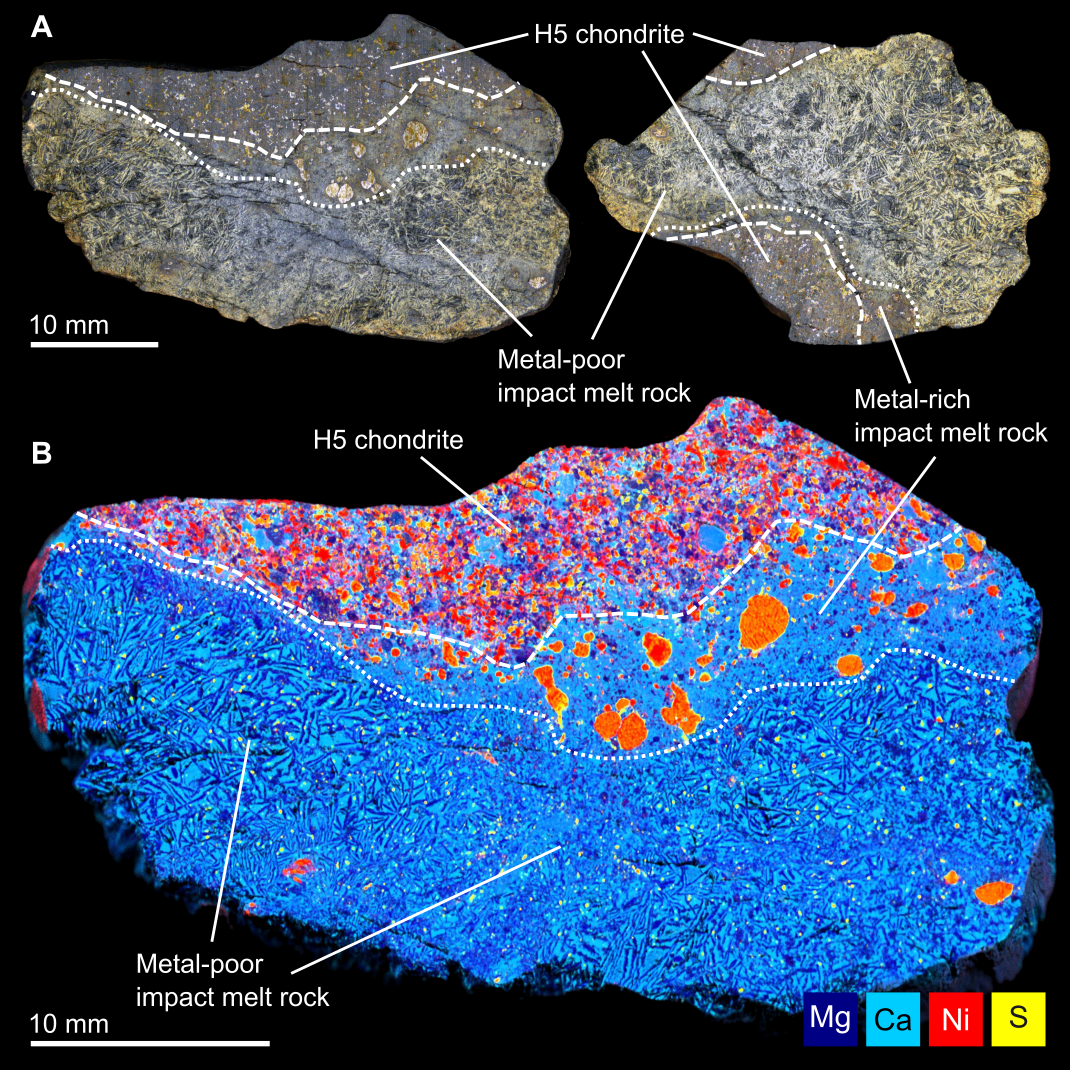
Fig. 1 Boutel Fil (b). A Overview images of two different slices of the meteorite. B µXRF element distribution map of one of the meteorite sections, showing the distribution of Mg, Ca, Ni, and S.
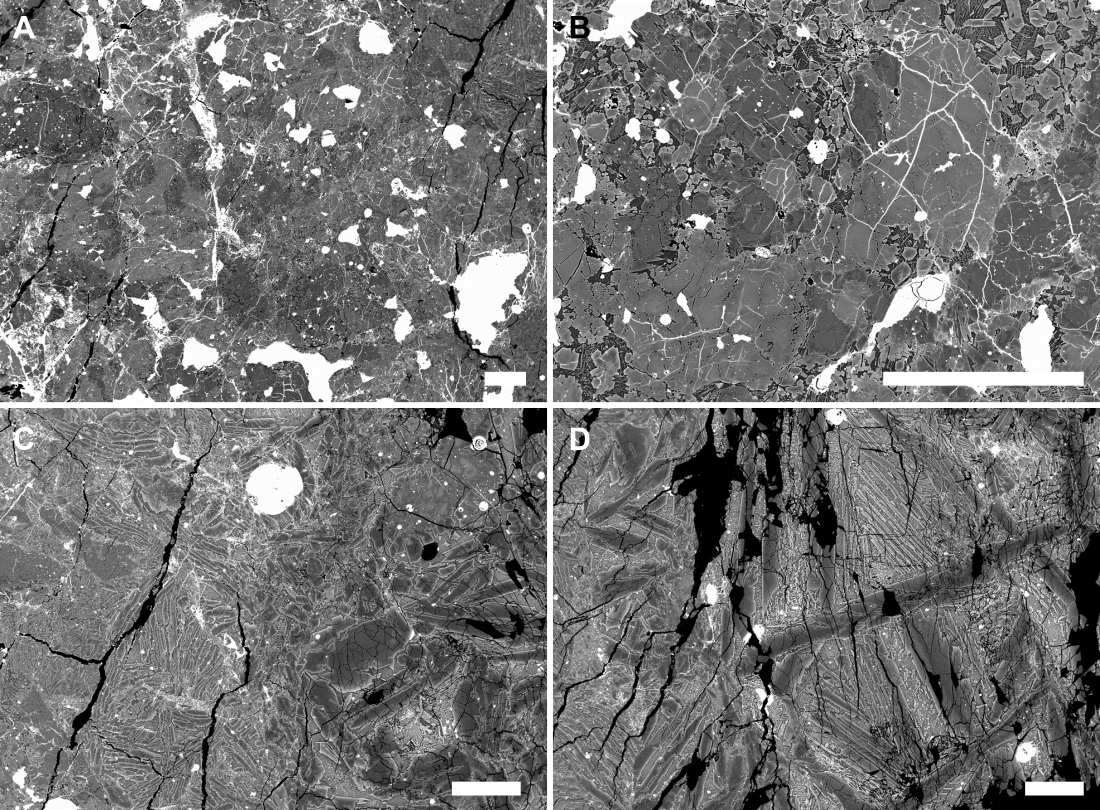
Fig. 2 Backscattered electron images of the different domains in Boutel Fil (b). A Unmelted H5 domain with chondrules and shock veins. B Fine-grained, metal-rich impact melt rock with zoned olivine and low-Ca pyroxene, interstitial mesostasis, and metal blebs and veins. C Transition between the fine-grained, metal-rich impact melt rock (left) and the coarse-grained, metal-poor impact melt rock (right). D Coarse-grained, metal-poor impact melt rock with zoned olivine quench crystals and interstitial mesostasis. Scale bars are 100 µm.
The unmelted H5 regions transition into a metal-rich, fine-grained melt rock composed of zoned olivine, low-Ca pyroxene, interstitial mesostasis, and large FeNi metal–sulfide blebs between <1 and ≤10 mm across (Figs. 1 and 2B). Adjacent to this metal-rich melt rock, a distinctly metal-poor, coarse-grained melt rock exists that is composed of large, normally zoned quench crystals of olivine (Fa8.2–37.5; average: Fa18.7) and mesostasis (Figs. 1 and 2C, D). Small sulfide blebs occur in the coarse-grained melt rock, whereas FeNi metal blebs are almost absent (Fig. 1B).
Major-element abundances of the H5 regions, obtained by micro X-ray fluorescence (µXRF) analysis using a defocused beam spot size of 200 µm, are chondritic. In contrast, the metal-poor, coarse-grained melt rock is significantly depleted in siderophile and chalcophile elements (Ni, Co, S, and Fe) and enriched in lithophile elements (Cr, Mn, Si, Mg, Na, and Al) compared to the H5 regions; the FeNi metal blebs have a complementary composition. In addition, the composition of the metal-poor, coarse-grained melt rock is remarkably similar to anomalous achondrite Dar al Gani 896 [13], which is interpreted as the silicate portion of an impact melted, metal–silicate segregated H chondrite precursor.
Discussion
We interpret Boutel Fil (b) as an impact melt breccia that formed in an impact event large and energetic enough to facilitate bulk melting of the H5 regions, which required peak pressures in excess of 70–80 GPa [14]. Agreeing with hypotheses of [13], we attribute metal–silicate segregation in the liquid state either to velocity differences between dense metal and lighter silicate impact melts during transient crater formation and/or to gravitational settling of dense metal liquids. Interestingly, the metal droplets in the metal-rich, fine-grained melt rock portion of Boutel Fil (b) have sizes that would be commensurate with the gravitational settling scenario envisaged by [13]. Rapid cooling of impact melt close to the relatively cold H5 regions, as evidenced by smaller grain sizes compared with the coarse-grained melt rock regions (Figs. 1 and 2), likely arrested metal droplets before complete segregation. We conclude that Boutel Fil (b) and Dar al Gani 896 demonstrate that hypervelocity impacts must be considered as potential drivers of (partial) planetary differentiation, likely predominantly during early stages of solar system history.
References
[1] Krot A. N. et al. (2014) Treatise on Geochemistry, edited by Holland H. H. and Turekian K. K, 1:1–63.
[2] Mason B. (1967) American Scientist 55:429–455.
[3] Hevey P. J. and Sanders I. S. (2006) Meteoritics & Planetary Science 41:95–106.
[4] Scott E. R. D. (2006) Icarus 185:72–82.
[5] Maurel C. (2020) Science Advances 6:eaba1303.
[6] Keil K. et al. (1997) Meteoritics & Planetary Science 32:349–363.
[7] Gaffey M. J. and Gilbert S. L. (1998) Meteoritics & Planetary Science 33:1281–1295.
[8] Elkins-Tanton L. T. (2012) Annual Review of Earth and Planetary Sciences 40:113–39.
[9] Ciesla F. J. et al. (2013) Meteoritics & Planetary Science 48:2559–2576.
[10] Krzesińska A. (2017) Meteoritics & Planetary Science 52:2305–2321.
[11] Schmieder M. et al. (2016) Meteoritics & Planetary Science 51:1022–1045.
[12] Wittmann A. et al. (2010) Journal of Geophysical Research 115:E07009.
[13] Folco L. et al. (2004) Geochimica et Cosmochimica Acta 68:2379–2397.
[14] Stöffler D. et al. (2018) Meteoritics & Planetary Science 53:5–49.
How to cite: Hamann, C., Rice, P., and Greshake, A.: Hypervelocity collisions as drivers of planetary differentiation: Evidence from the Boutel Fil (b) H chondrite impact melt breccia, Europlanet Science Congress 2024, Berlin, Germany, 8–13 Sep 2024, EPSC2024-826, https://doi.org/10.5194/epsc2024-826, 2024.
Please decide on your access
Please use the buttons below to download the supplementary material or to visit the external website where the presentation is linked. Regarding the external link, please note that Copernicus Meetings cannot accept any liability for the content and the website you will visit.
Forward to presentation link
You are going to open an external link to the presentation as indicated by the authors. Copernicus Meetings cannot accept any liability for the content and the website you will visit.
We are sorry, but presentations are only available for users who registered for the conference. Thank you.
Please decide on your access
Please use the buttons below to download the supplementary material or to visit the external website where the presentation is linked. Regarding the external link, please note that Copernicus Meetings cannot accept any liability for the content and the website you will visit.
Forward to session asset
You are going to open an external link to the asset as indicated by the session. Copernicus Meetings cannot accept any liability for the content and the website you will visit.
We are sorry, but presentations are only available for users who registered for the conference. Thank you.