OPC applications
TP1 | Mercury Science and Exploration
EPSC2022-595 | Posters | TP1
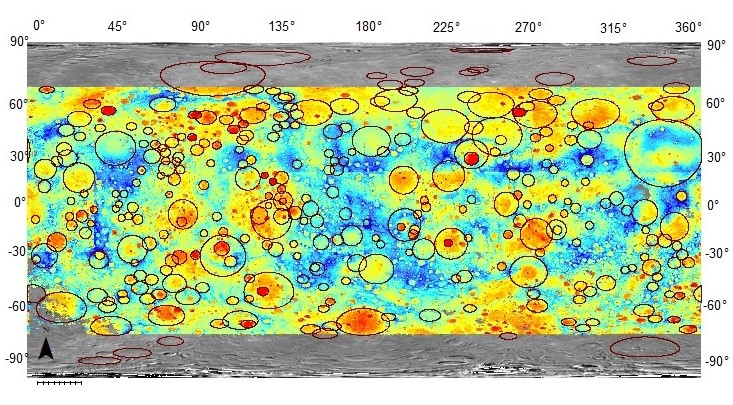
Classification of Mercury’s Impact Basins, Based on Topography- and Gravity Signatures in MESSENGER DataMon, 19 Sep, 18:45–20:15 (CEST) | Poster area Level 1 | L1.12


EPSC2022-624 | Posters | TP1
Definition of scientific targets of interest for BepiColombo in the eastern Eminescu (H9) quadrangleMon, 19 Sep, 18:45–20:15 (CEST) | Poster area Level 1 | L1.11
EPSC2022-890 | Posters | TP1
Micro-meteoroids impact vaporization (MMIV) as source for Ca and CaO exosphere along Mercury’s orbitMon, 19 Sep, 18:45–20:15 (CEST) | Poster area Level 1 | L1.7
EPSC2022-934 | Posters | TP1
The core flow induced by Mercury’s libration: density stratification and magnetic fieldsMon, 19 Sep, 18:45–20:15 (CEST) | Poster area Level 1 | L1.8
TP2 | Paving the way to the decade of Venus
EPSC2022-941 | Posters | TP2
Could Acidithiobacillus ferrooxidans be analogs of microorganisms potentially inhabiting Venus clouds?Mon, 19 Sep, 18:45–20:15 (CEST) | Poster area Level 1 | L1.24
TP3 | Forward to the Moon: The Science of Exploration
EPSC2022-923 | Posters | TP3
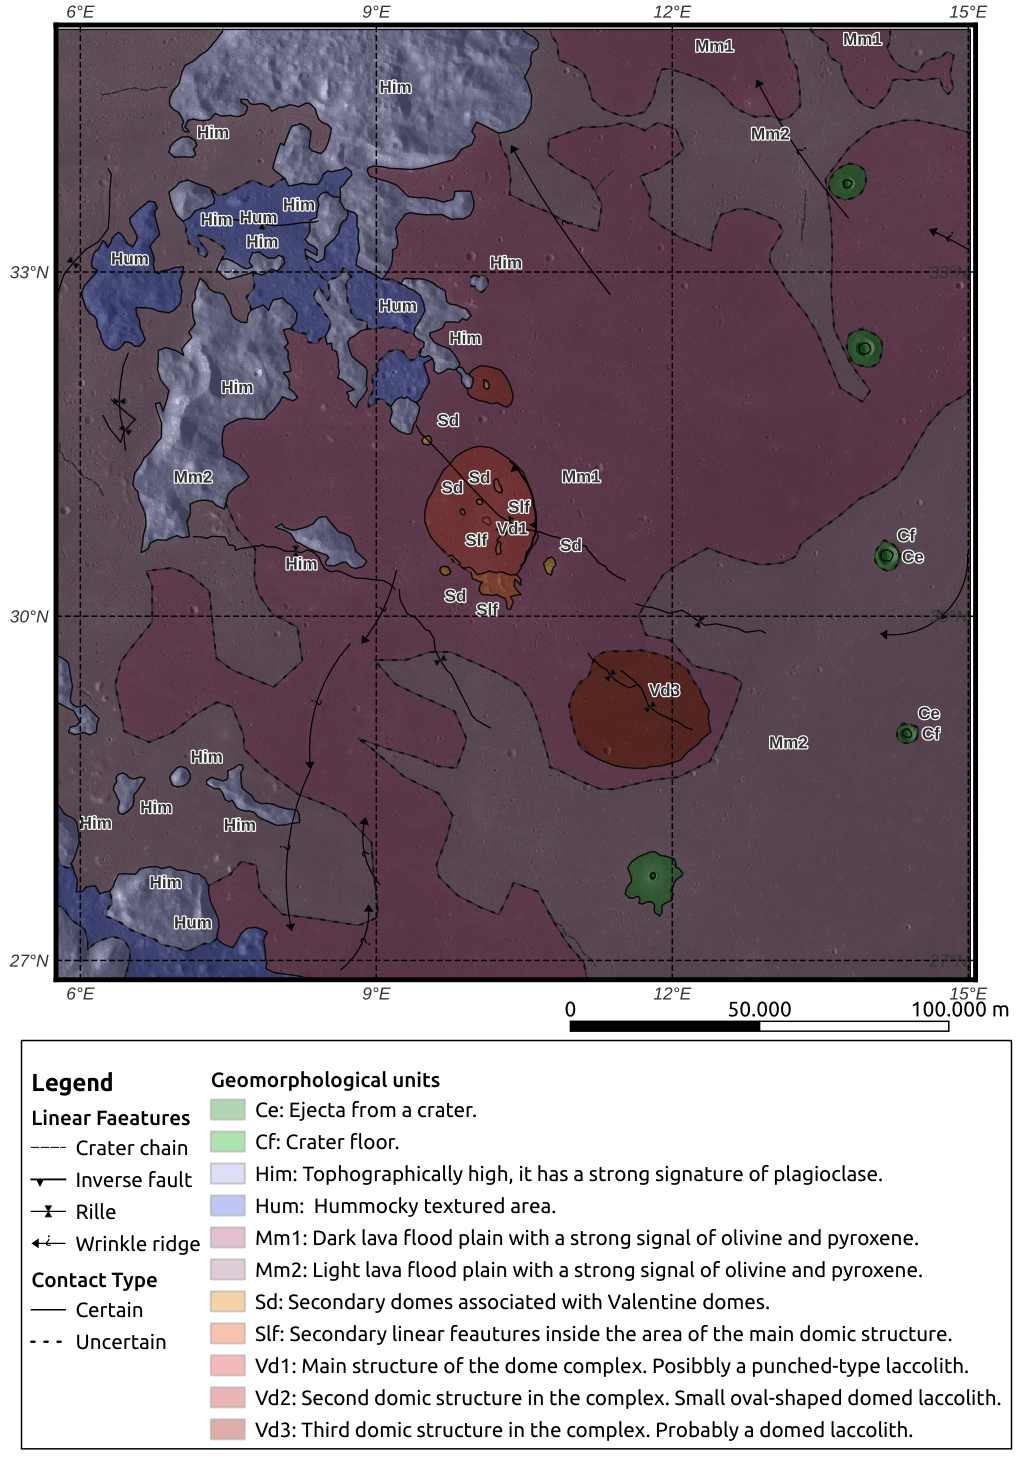
Geomorphologic mapping of the Valentine Domes in the Moon, intrusive domes, and their mineral resource potentialMon, 19 Sep, 18:45–20:15 (CEST) | Poster area Level 1 | L1.35
EPSC2022-992 | Posters | TP3
The Negative Ions at the Lunar Surface (NILS): first dedicated negative ion instrument on the Chang’E-6 mission to the Moon.Mon, 19 Sep, 18:45–20:15 (CEST) | Poster area Level 1 | L1.38
TP4 | Mars Surface and Interior
EPSC2022-222 | Posters | TP4
Clay and sulfate-bearing terrains in Northern Meridiani Planum, Mars: constraining the characteristics of Mars’ early climate at the Noachian-Hesperian boundaryThu, 22 Sep, 18:45–20:15 (CEST) | Poster area Level 1 | L1.3

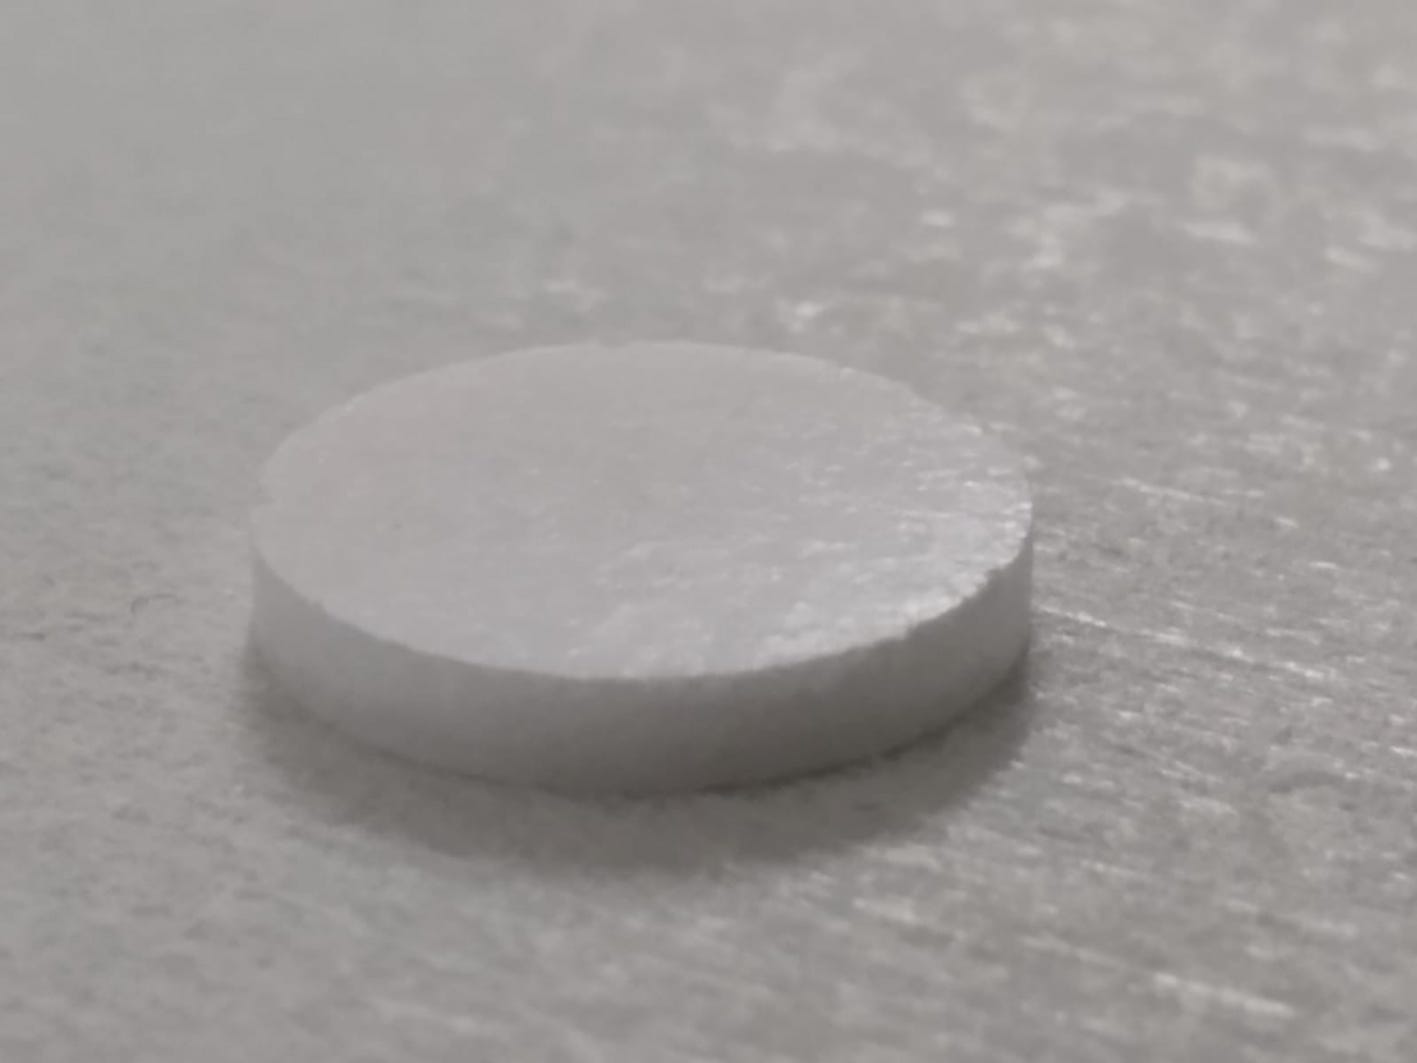
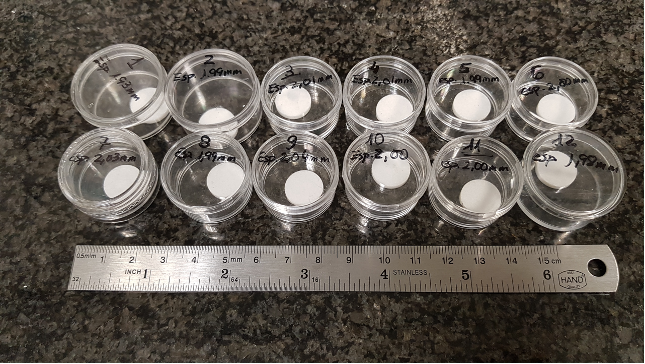
EPSC2022-467 | Posters | TP4
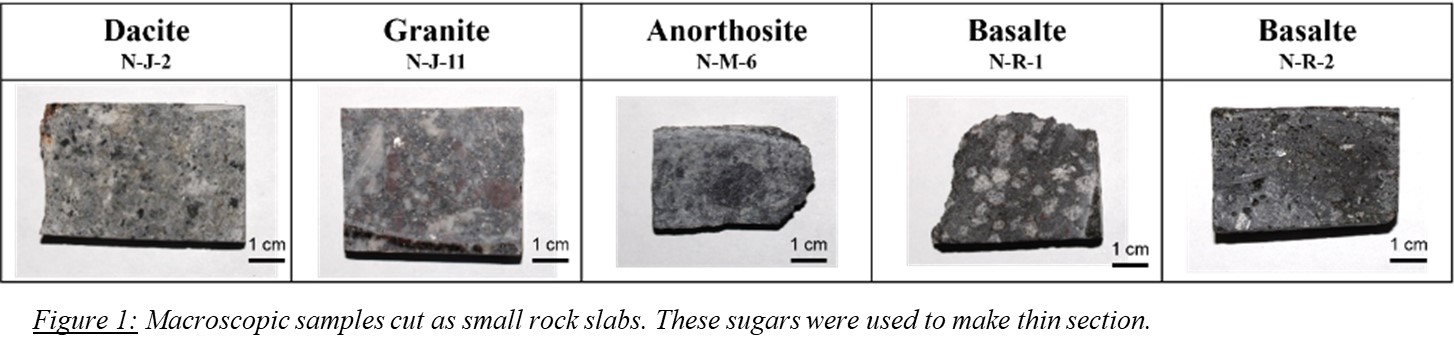
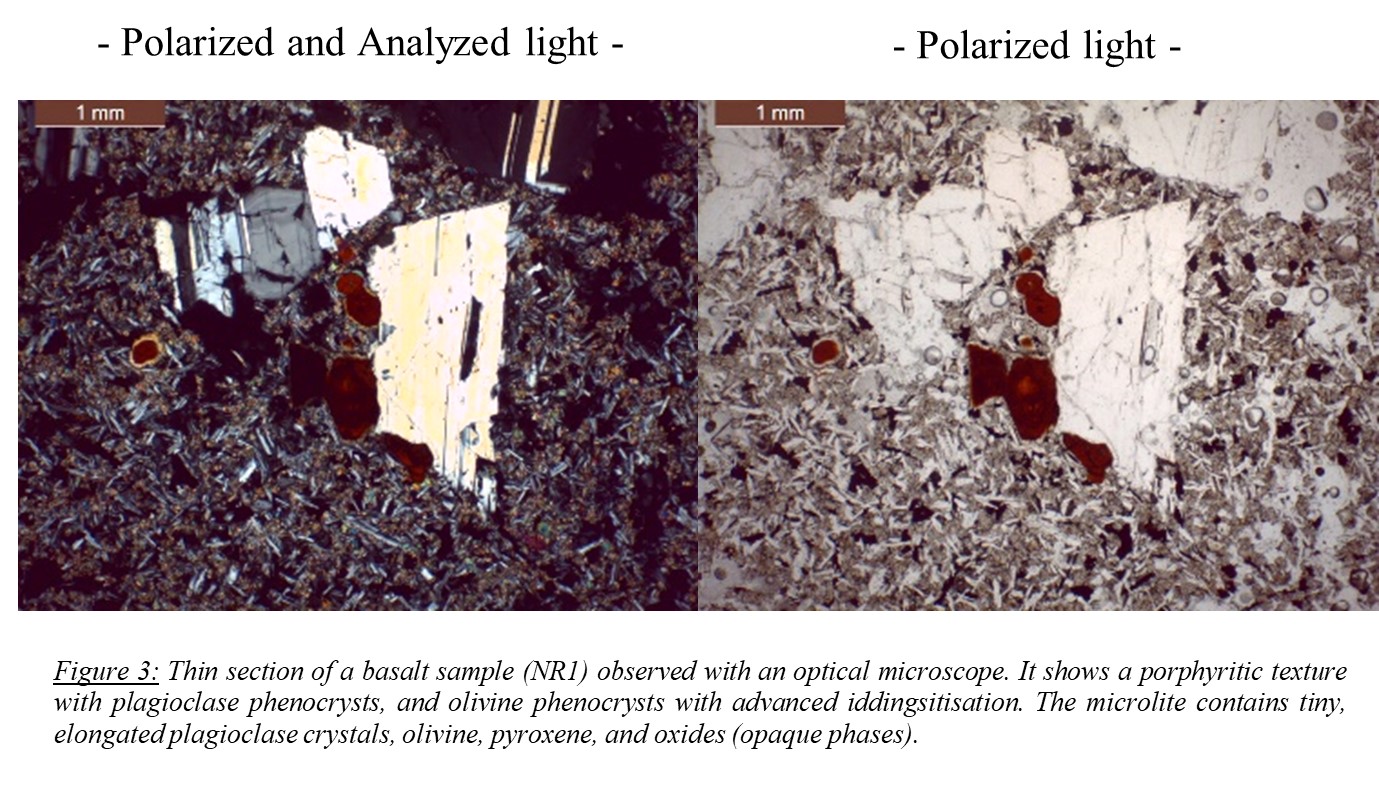
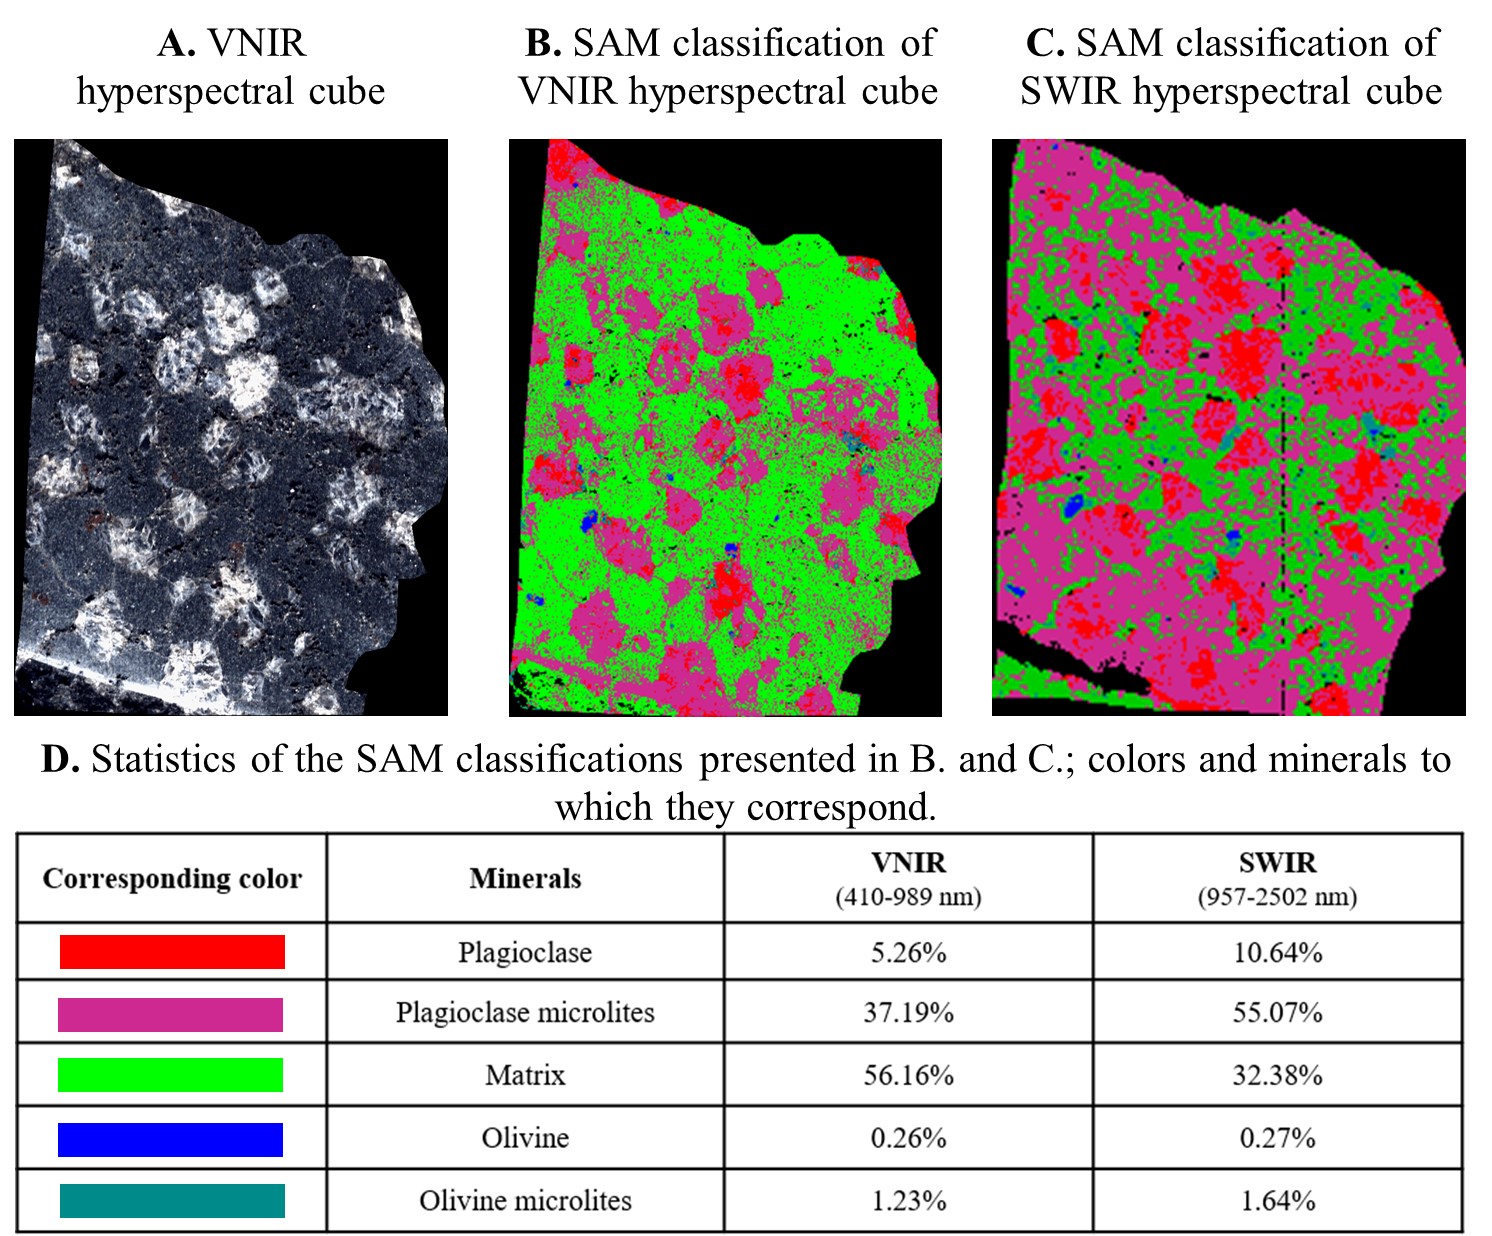
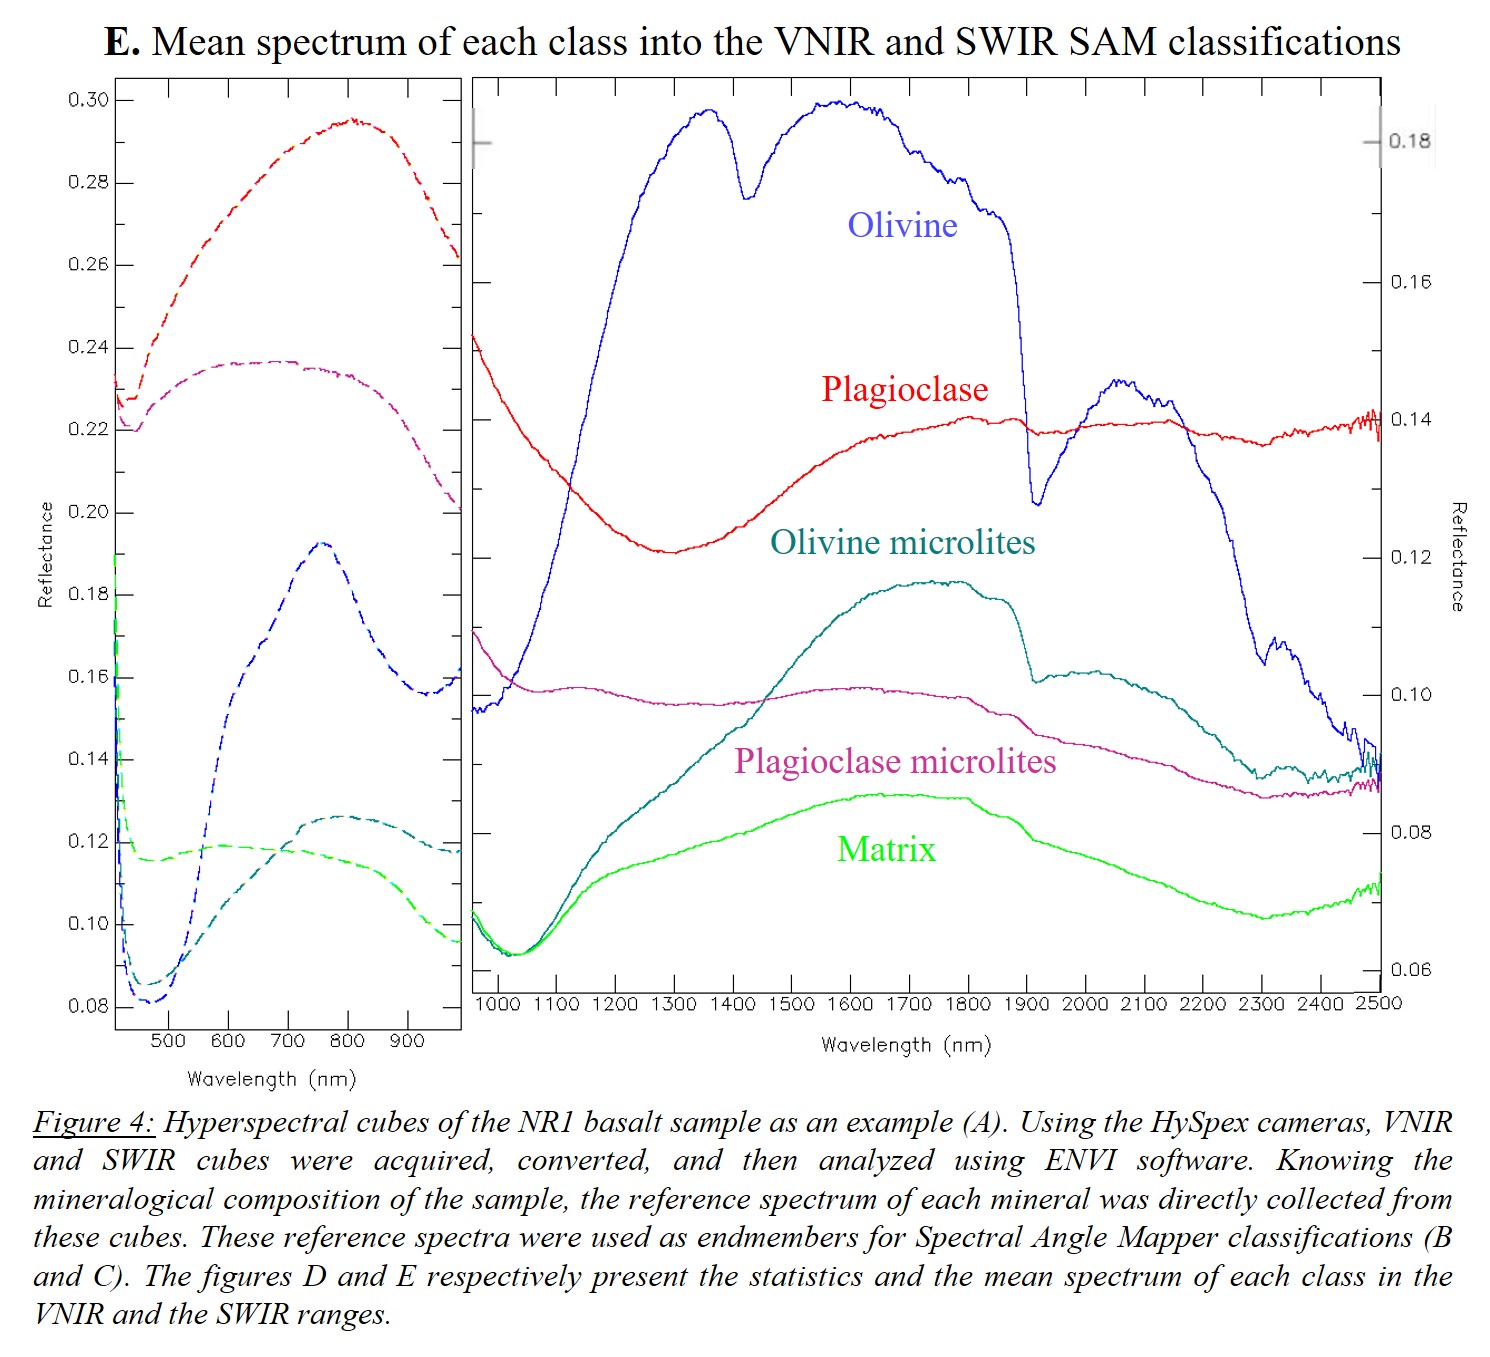
Reflectance spectroscopy and optical microscopy laboratory analyses of terrestrial feldspathic rocks as analogs to MarsThu, 22 Sep, 18:45–20:15 (CEST) | Poster area Level 1 | L1.21

EPSC2022-549 | Posters | TP4
Reconstruction of Northwestern Terra Cimmeria WatershedsThu, 22 Sep, 18:45–20:15 (CEST) | Poster area Level 1 | L1.12
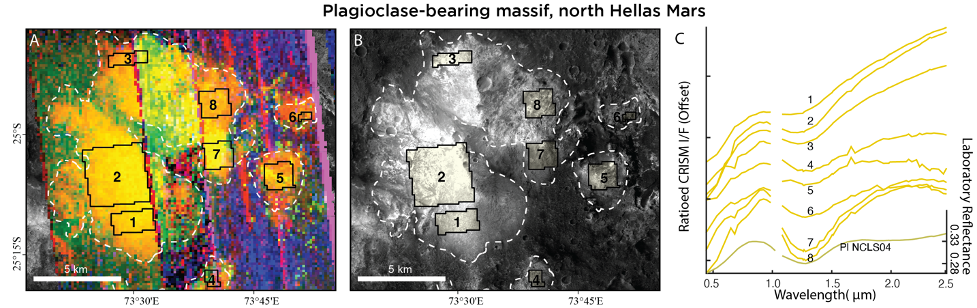
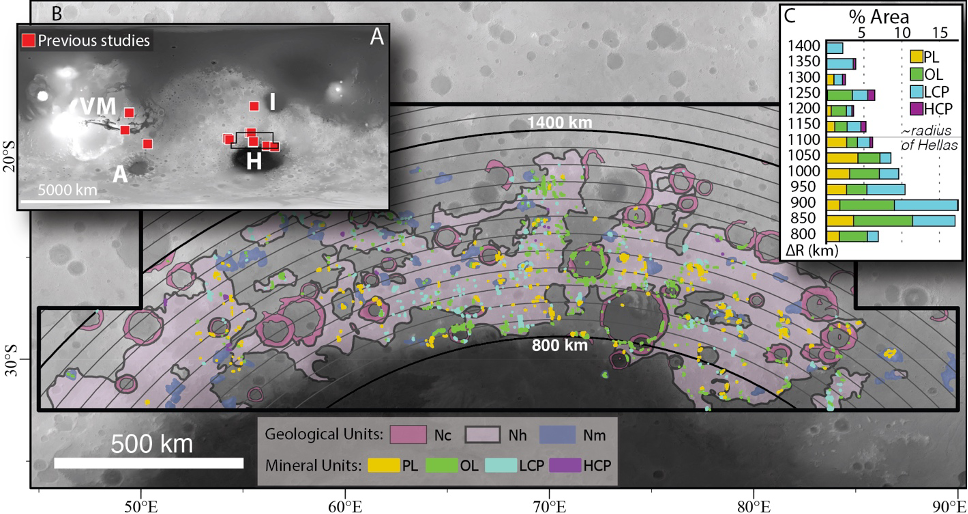
EPSC2022-736 | Posters | TP4
Mars uplifted massifs: unique and extensive samples of ancient crust.Thu, 22 Sep, 18:45–20:15 (CEST) | Poster area Level 1 | L1.11
TP5 | Mars Science and Exploration
EPSC2022-753 | Posters | TP5
CO distributions retrieved from TGO NOMAD SO using multiple ordersThu, 22 Sep, 18:45–20:15 (CEST) | Poster area Level 1 | L1.37
EPSC2022-784 | Posters | TP5
Improving the Polyethylene Terephtalate (PET) perfomances, for the RAX Verification Target for MMX missionThu, 22 Sep, 18:45–20:15 (CEST) | Poster area Level 1 | L1.26
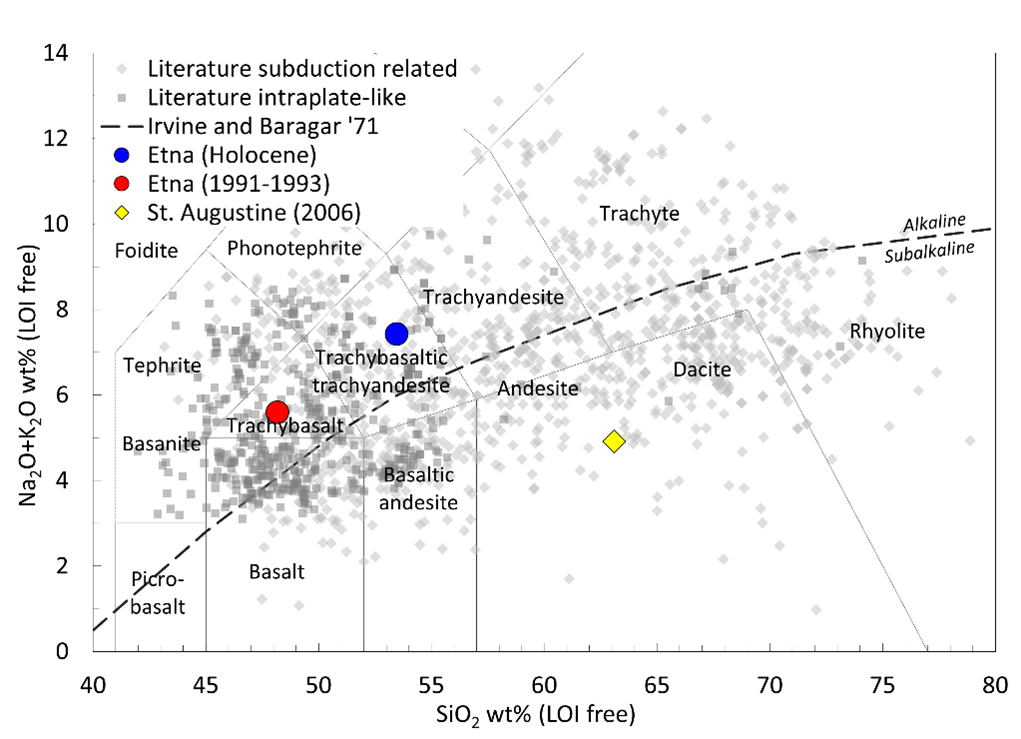
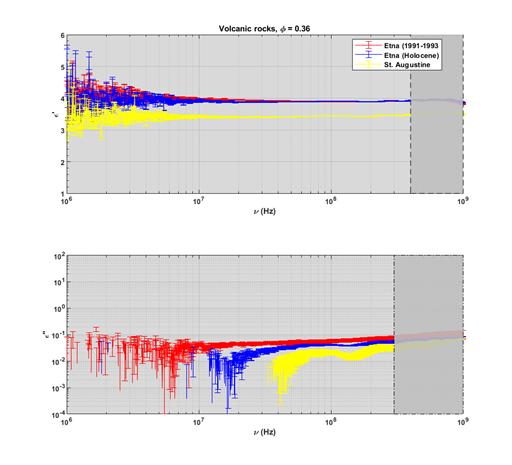
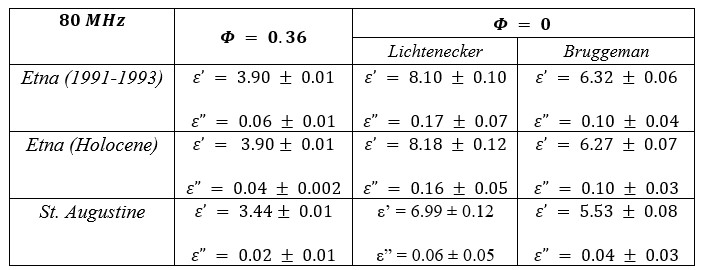
EPSC2022-956 | Posters | TP5
Electromagnetic and geochemical characterization of volcanic rock samples in the framework of radar exploration of terrestrial planetsThu, 22 Sep, 18:45–20:15 (CEST) | Poster area Level 1 | L1.29


TP6 | Martian dust and clouds: from lab to space
EPSC2022-946 | Posters | TP6
Evaluation of the capability of ExoMars-TGO NOMAD infrared nadir channel for water ice clouds detection on MarsMon, 19 Sep, 18:45–20:15 (CEST) | Poster area Level 1 | L1.46
TP12 | Planetary Seismology and Geophysics
EPSC2022-816 | Posters | TP12
Site Effect Study based on Magnitude 4~5 InSight MarsquakesMon, 19 Sep, 18:45–20:15 (CEST) | Poster area Level 1 | L1.56
EPSC2022-846 | Posters | TP12
Reprocessing Apollo seismic dataMon, 19 Sep, 18:45–20:15 (CEST) | Poster area Level 1 | L1.58
TP13 | Planetary Dynamics: Shape, Gravity, Orbit, Tides, and Rotation from Observations and Models
EPSC2022-1118 | Posters | TP13
A parametric level-set approach to the global gravity inversion of small bodiesMon, 19 Sep, 18:45–20:15 (CEST) | Poster area Level 1 | L1.66
TP14 | Impact Processes in the Solar System
EPSC2022-828 | Posters | TP14
Refinement of the Lunar Production Function - The CSFD-Slope of Small Crater Diameters on Ejecta BlanketsThu, 22 Sep, 18:45–20:15 (CEST) | Poster area Level 1 | L1.71


EPSC2022-851 | Posters | TP14
Impact generated modification of the mineralogy at Oxia PlanumThu, 22 Sep, 18:45–20:15 (CEST) | Poster area Level 1 | L1.60
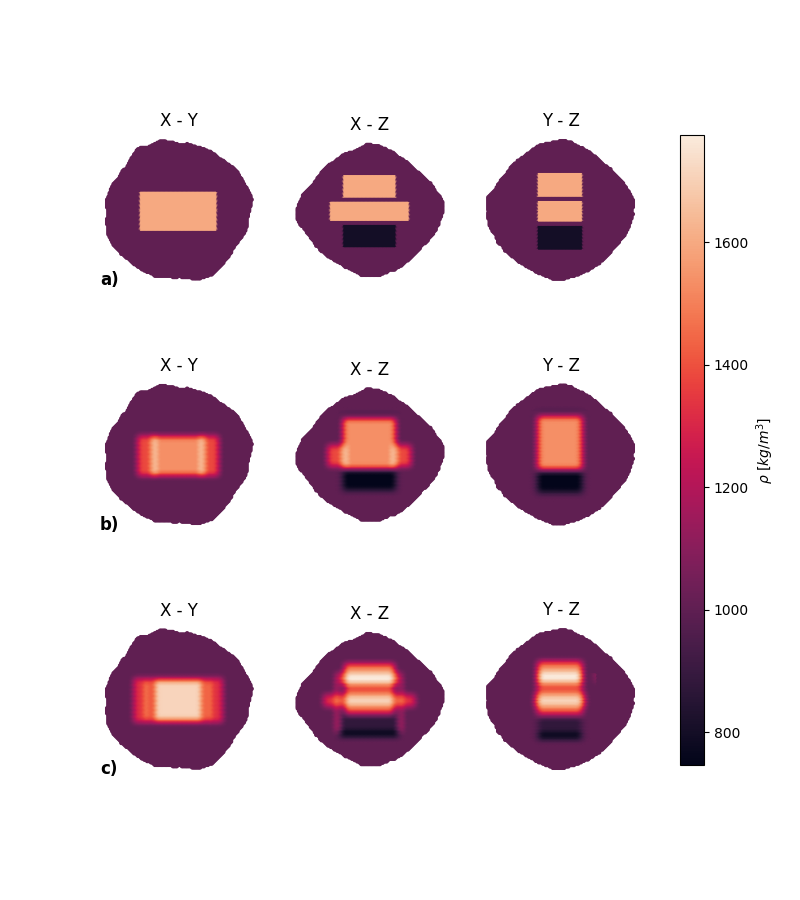
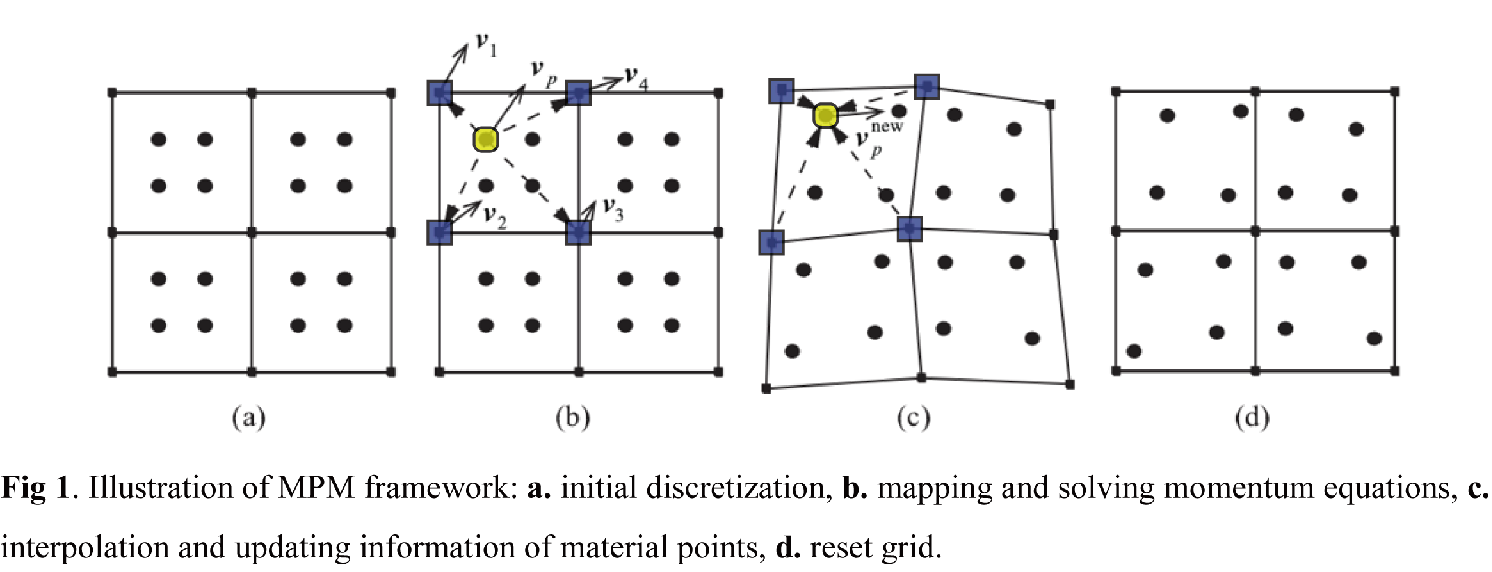
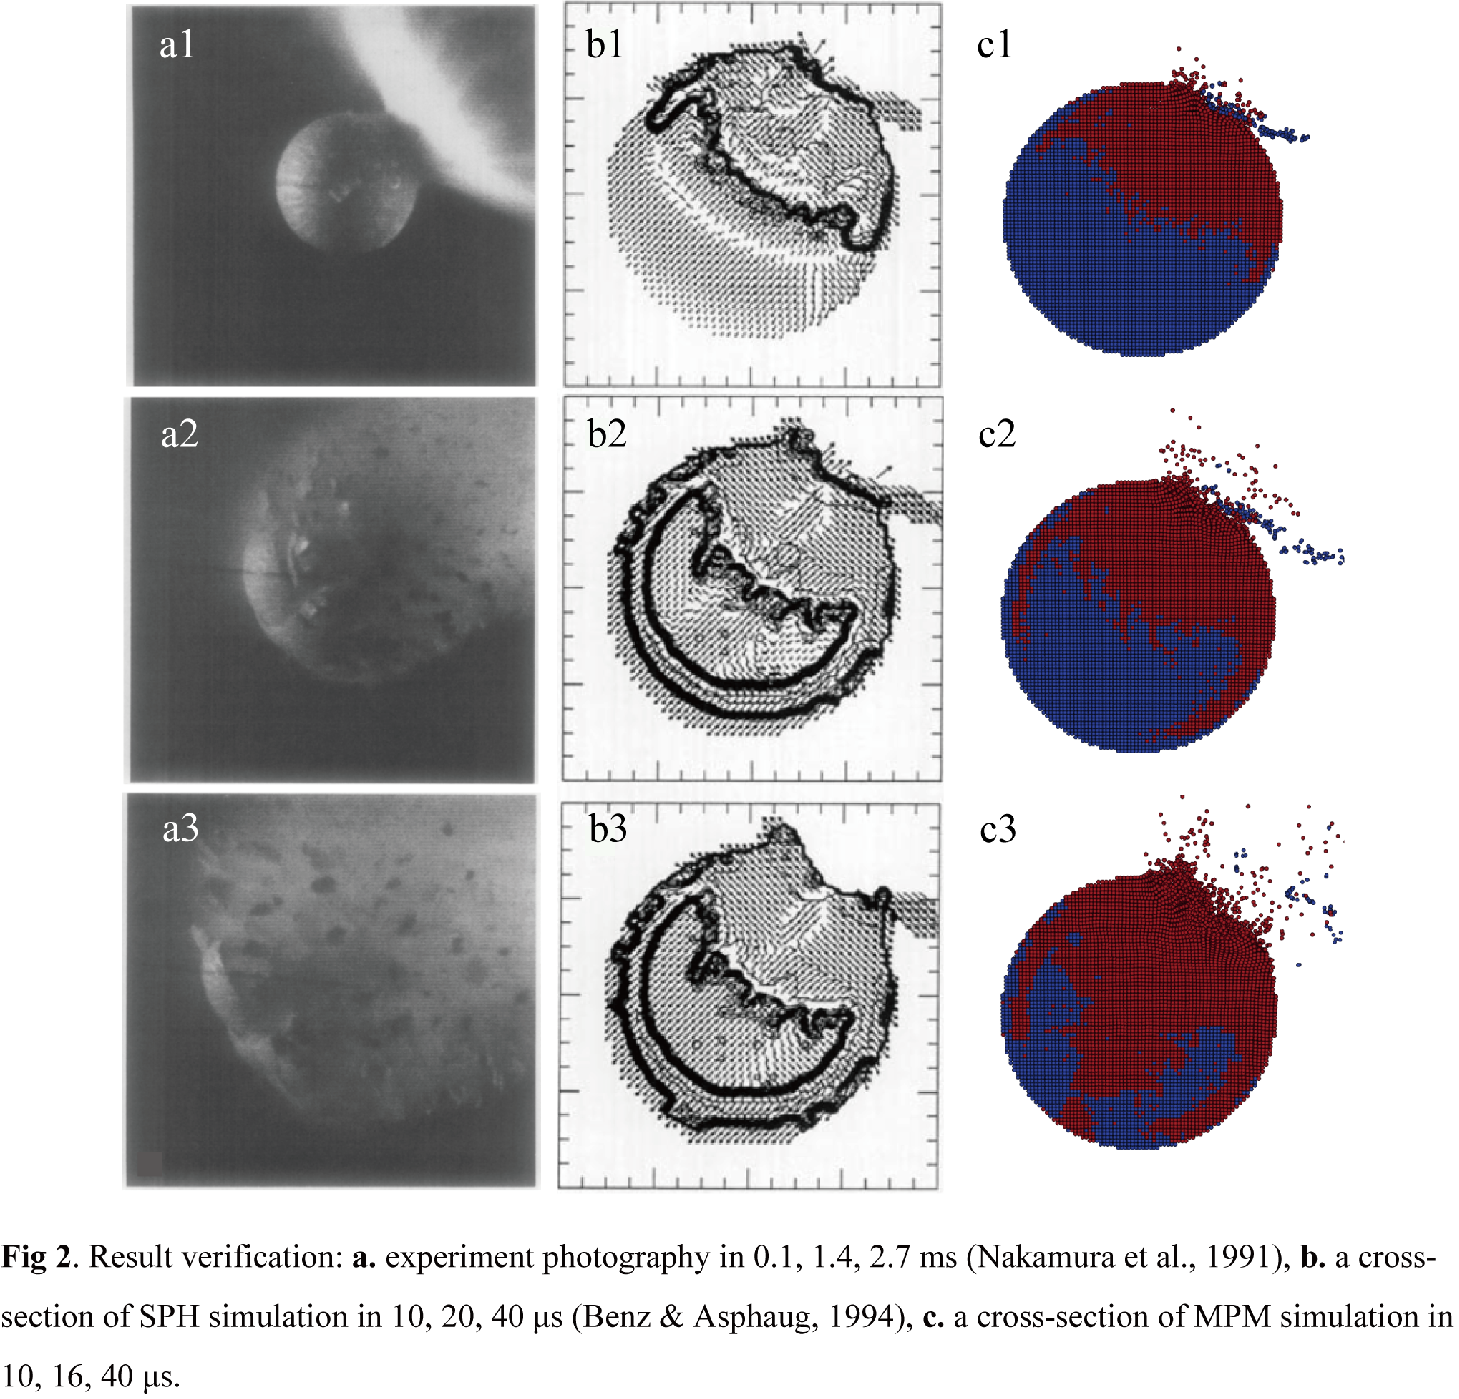
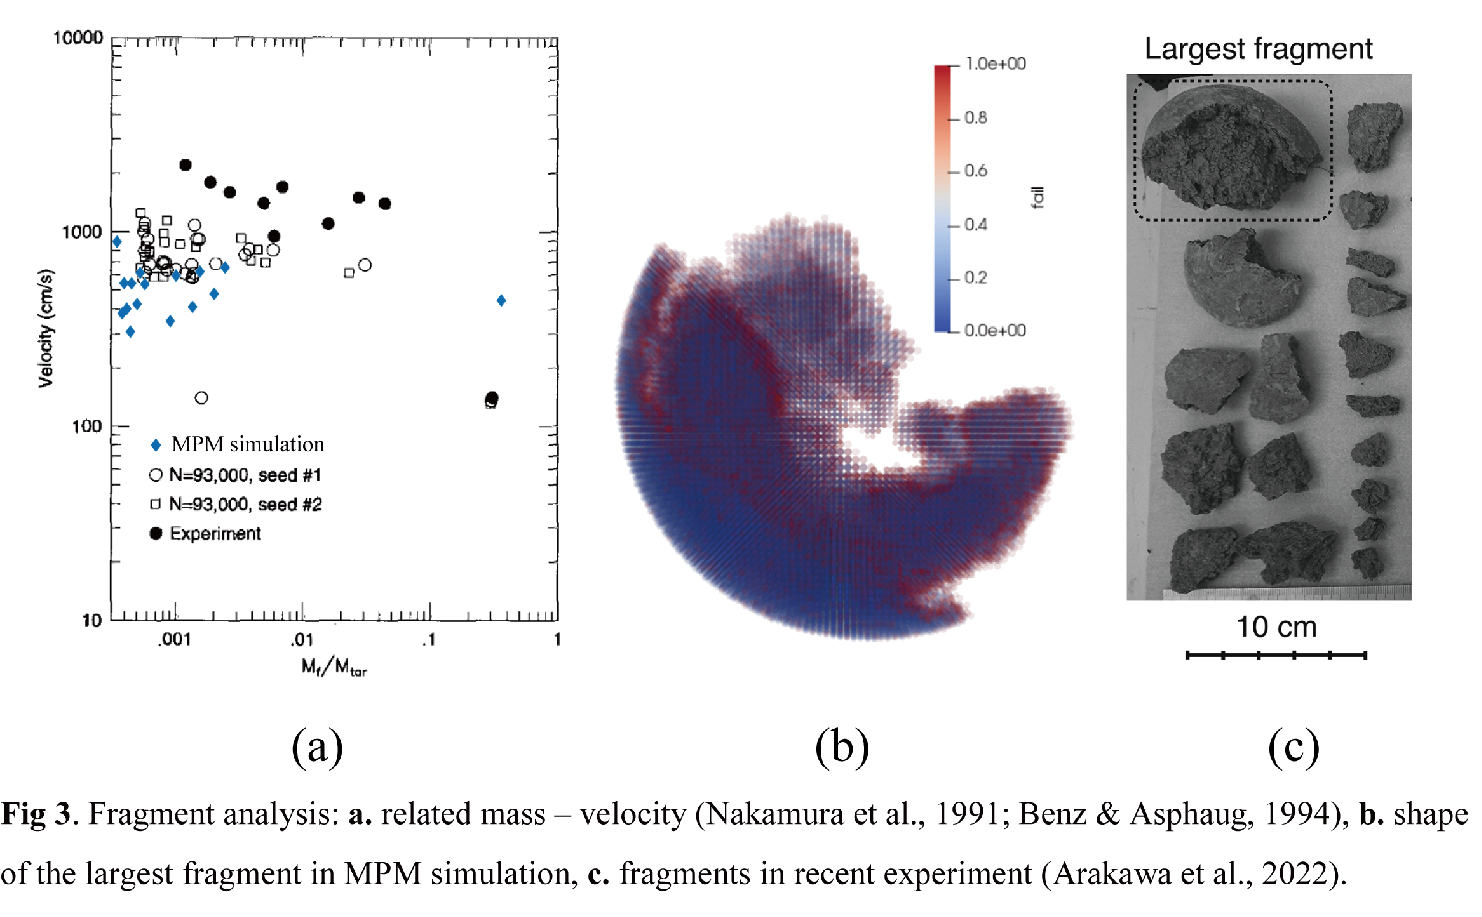
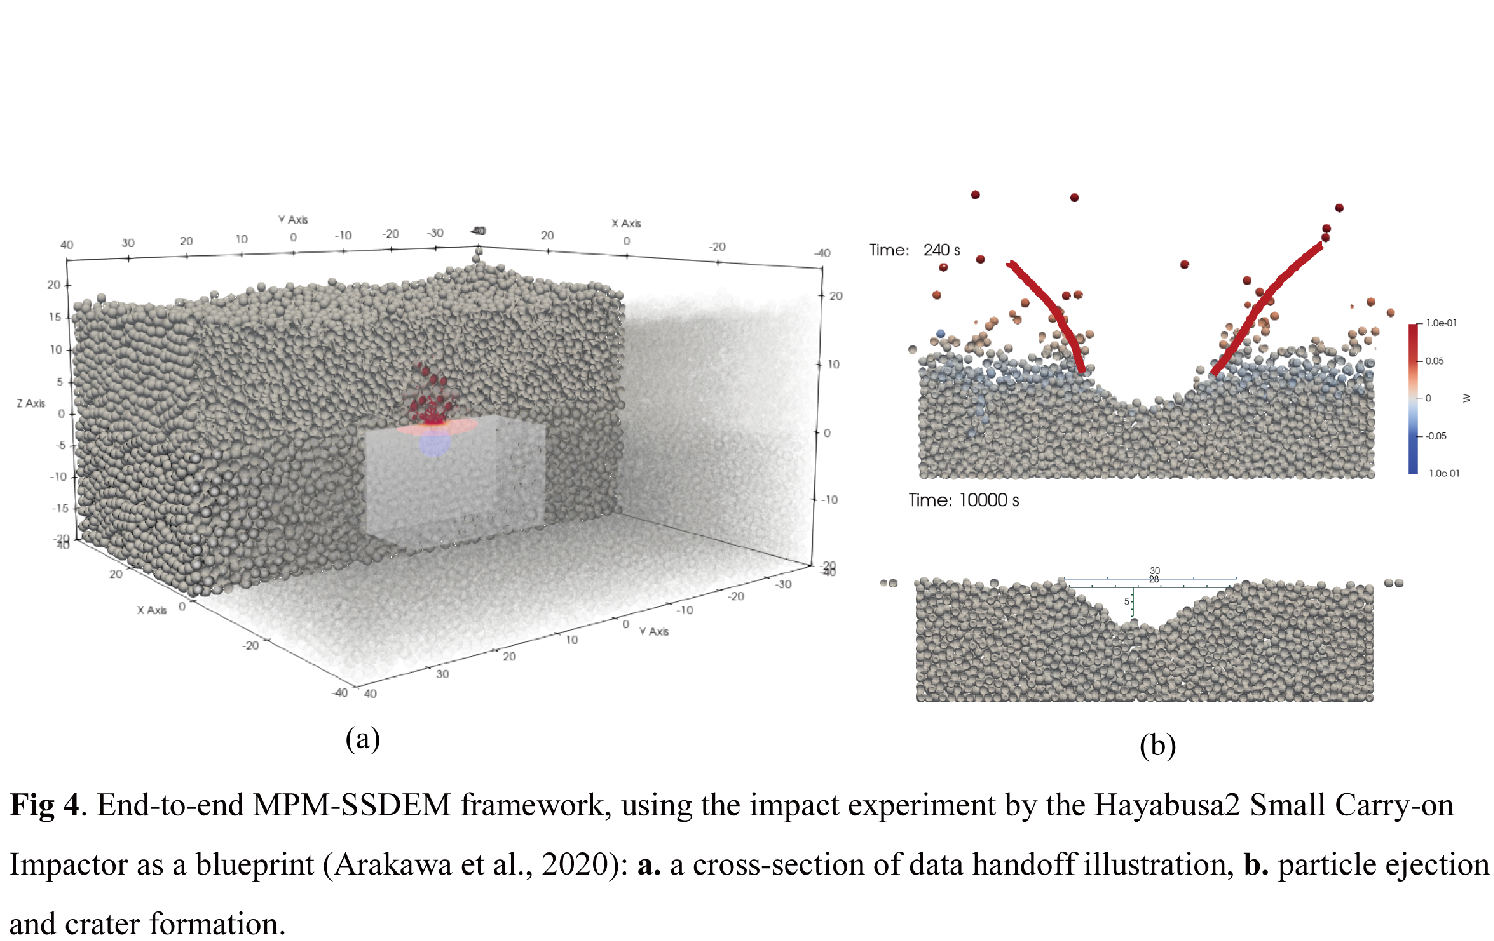
EPSC2022-1064 | Posters | TP14
Hypervelocity impact simulation on asteroids with MPM frameworkThu, 22 Sep, 18:45–20:15 (CEST) | Poster area Level 1 | L1.66
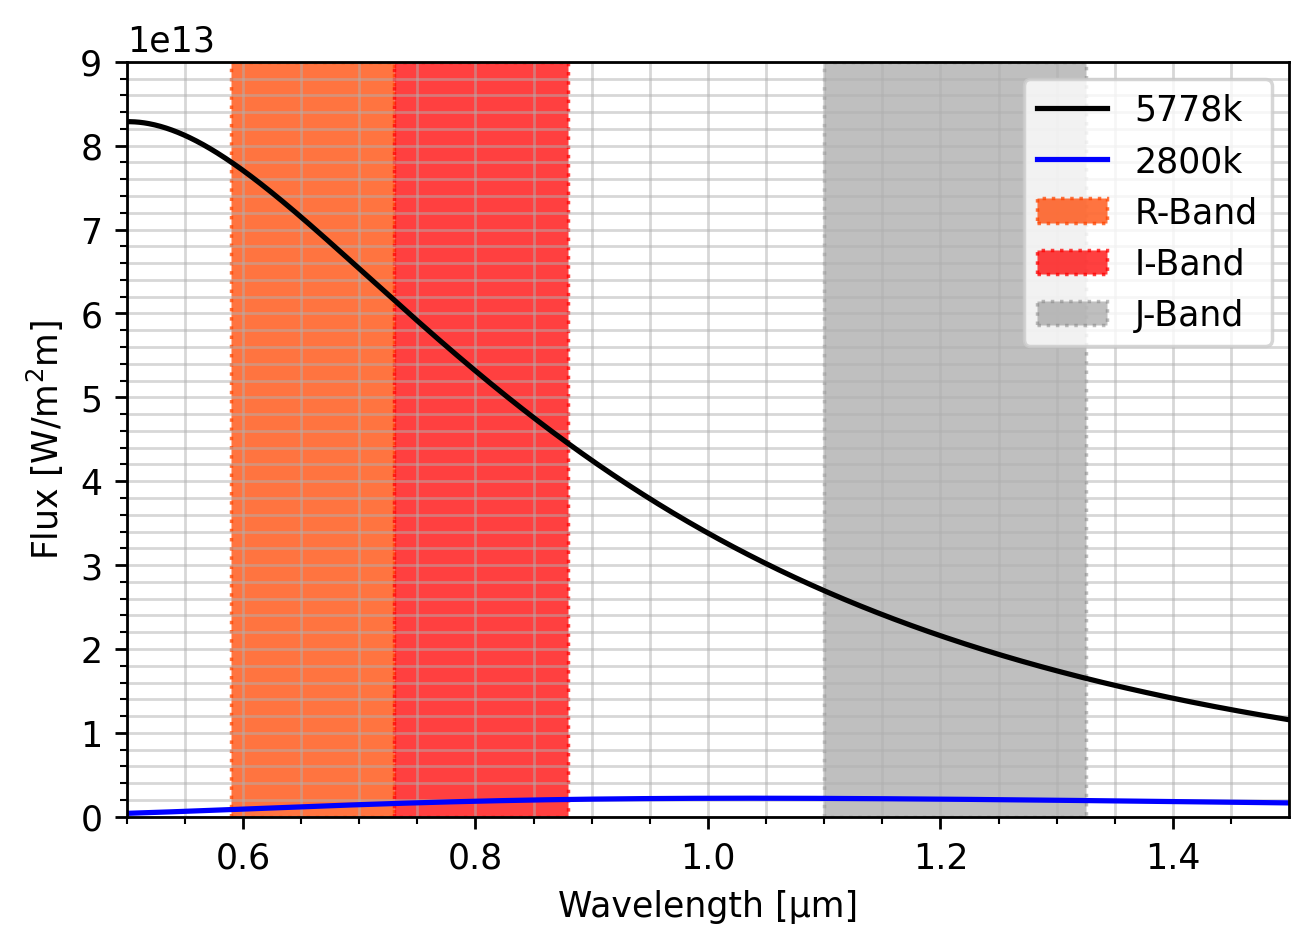
EPSC2022-1077 | Posters | TP14 | MI
J-Band Measurements for All-Hours Lunar Impact Flash ObservationsThu, 22 Sep, 18:45–20:15 (CEST) | Poster area Level 1 | L1.68


TP15 | Astrobiology
EPSC2022-121 | Posters | TP15
Exploration of Methodologies to Investigate Bacterial Survival in Planetary ImpactsMon, 19 Sep, 18:45–20:15 (CEST) | Poster area Level 1 | L1.69


EPSC2022-544 | Posters | TP15
Abiotic clathrite synthesis from CO2-clathrate under ocean world conditionsMon, 19 Sep, 18:45–20:15 (CEST) | Poster area Level 1 | L1.76
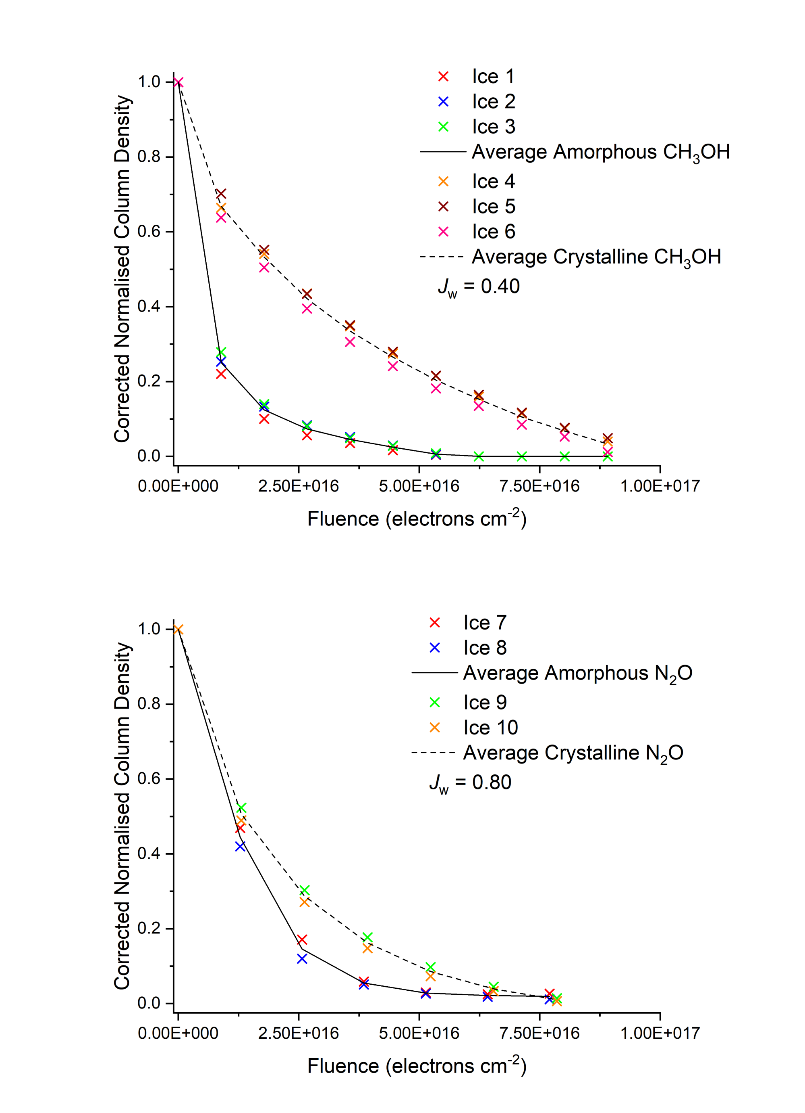
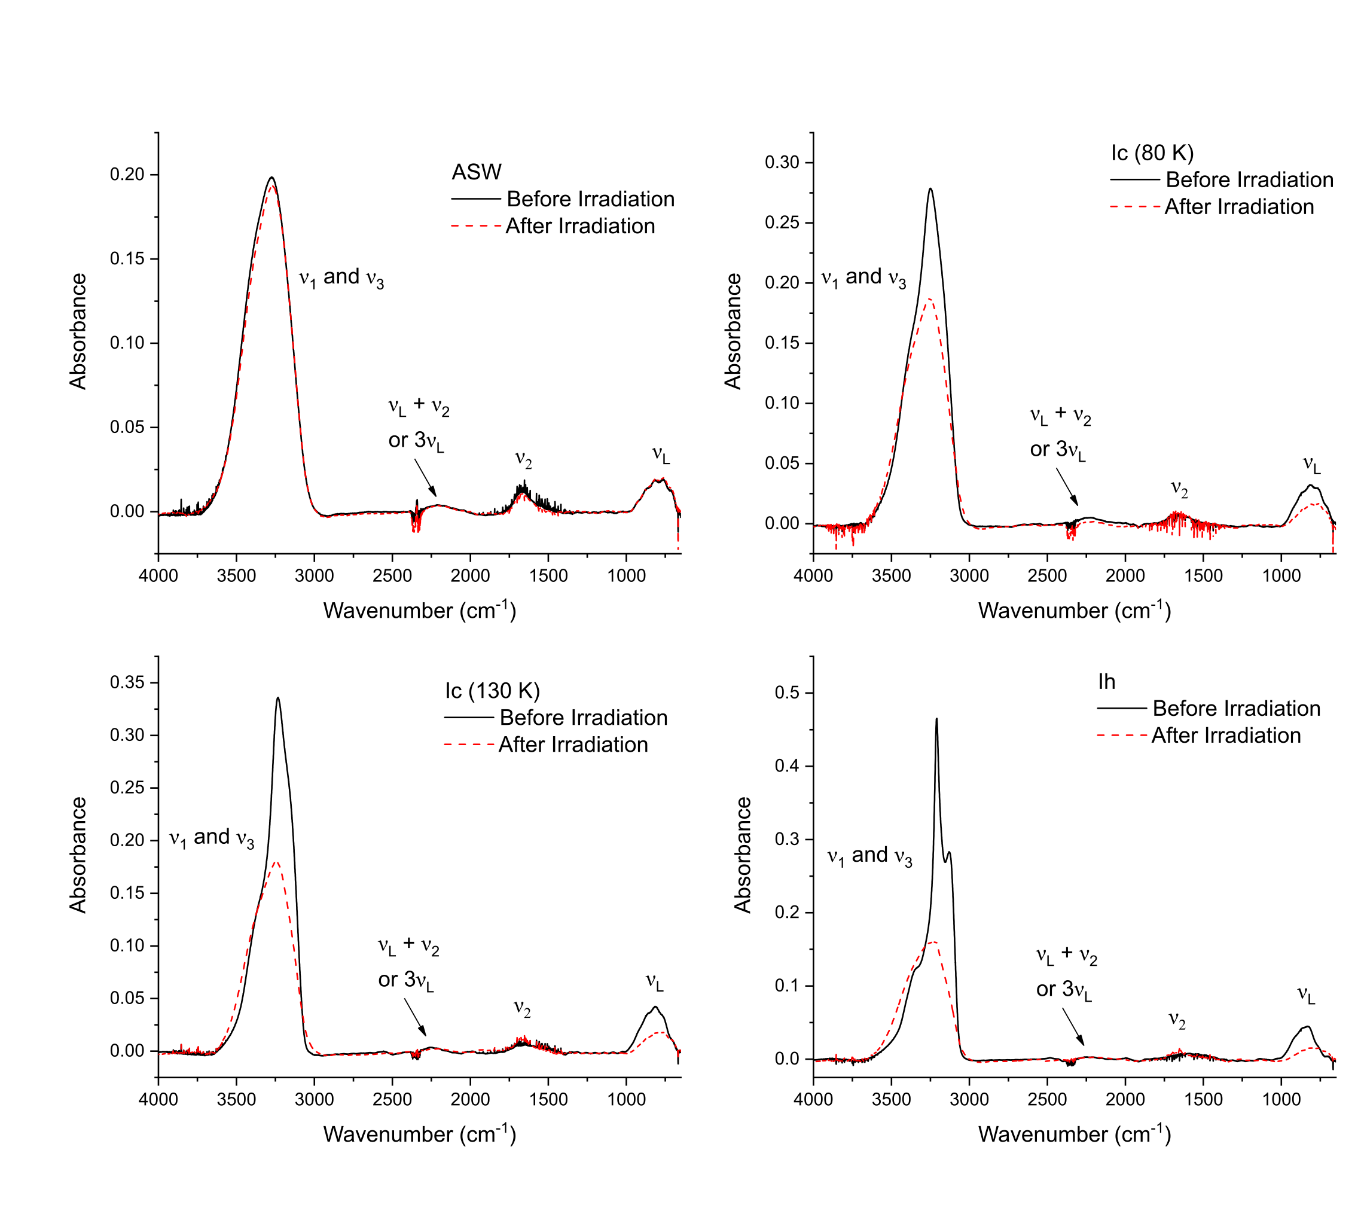
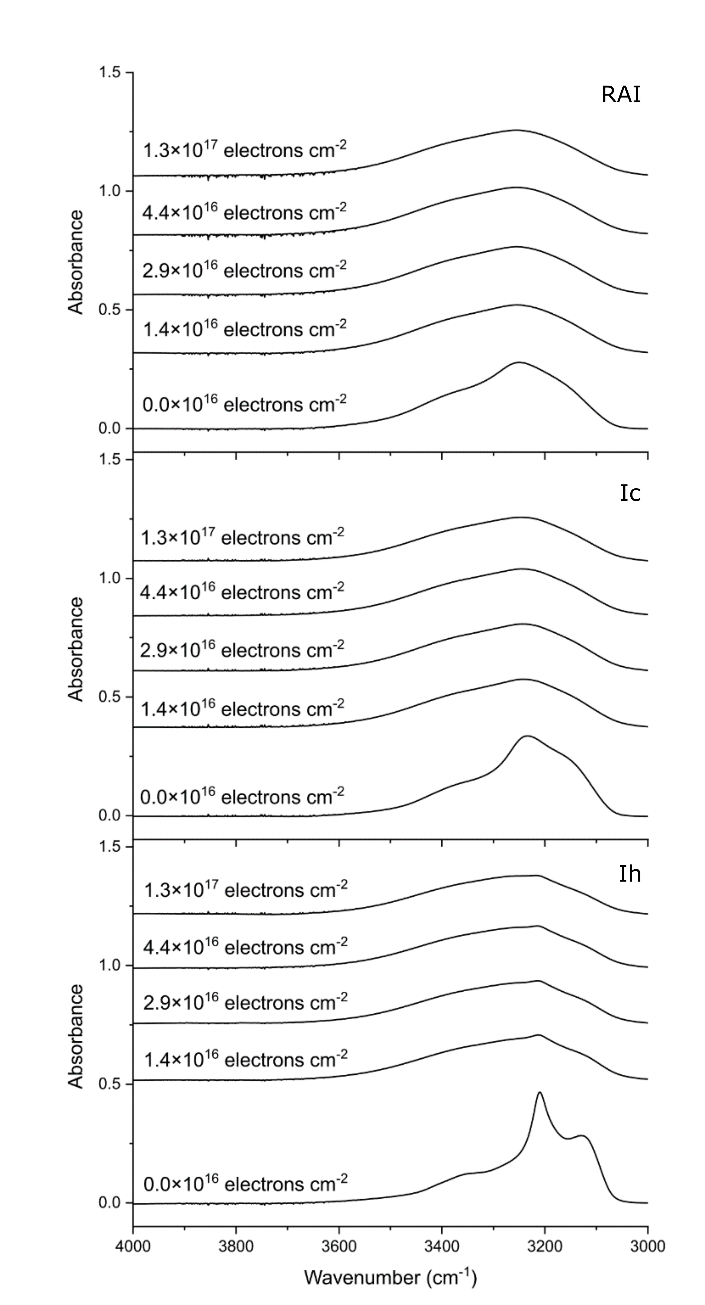
EPSC2022-832 | Posters | TP15
The Effect of the Solid Phase Adopted by Astrophysical Ices on their Radiation Chemistry and Physics: Implications for the Synthesis of Prebiotic MoleculesMon, 19 Sep, 18:45–20:15 (CEST) | Poster area Level 1 | L1.79
EPSC2022-1133 | Posters | TP15
Simulating the Thermodynamic Landscape of Hydrogen Cyanide-Derived PolymersMon, 19 Sep, 18:45–20:15 (CEST) | Poster area Level 1 | L1.80
EPSC2022-1139 | Posters | TP15
Potential long-term habitable conditions on planets with primordial H-He atmospheres.Mon, 19 Sep, 18:45–20:15 (CEST) | Poster area Level 1 | L1.81
TP17 | Planetary field analogues for Space Research
EPSC2022-611 | Posters | TP17
Introducing the First Greek Martian and Lunar SimulantsMon, 19 Sep, 18:45–20:15 (CEST) | Poster area Level 1 | L1.88

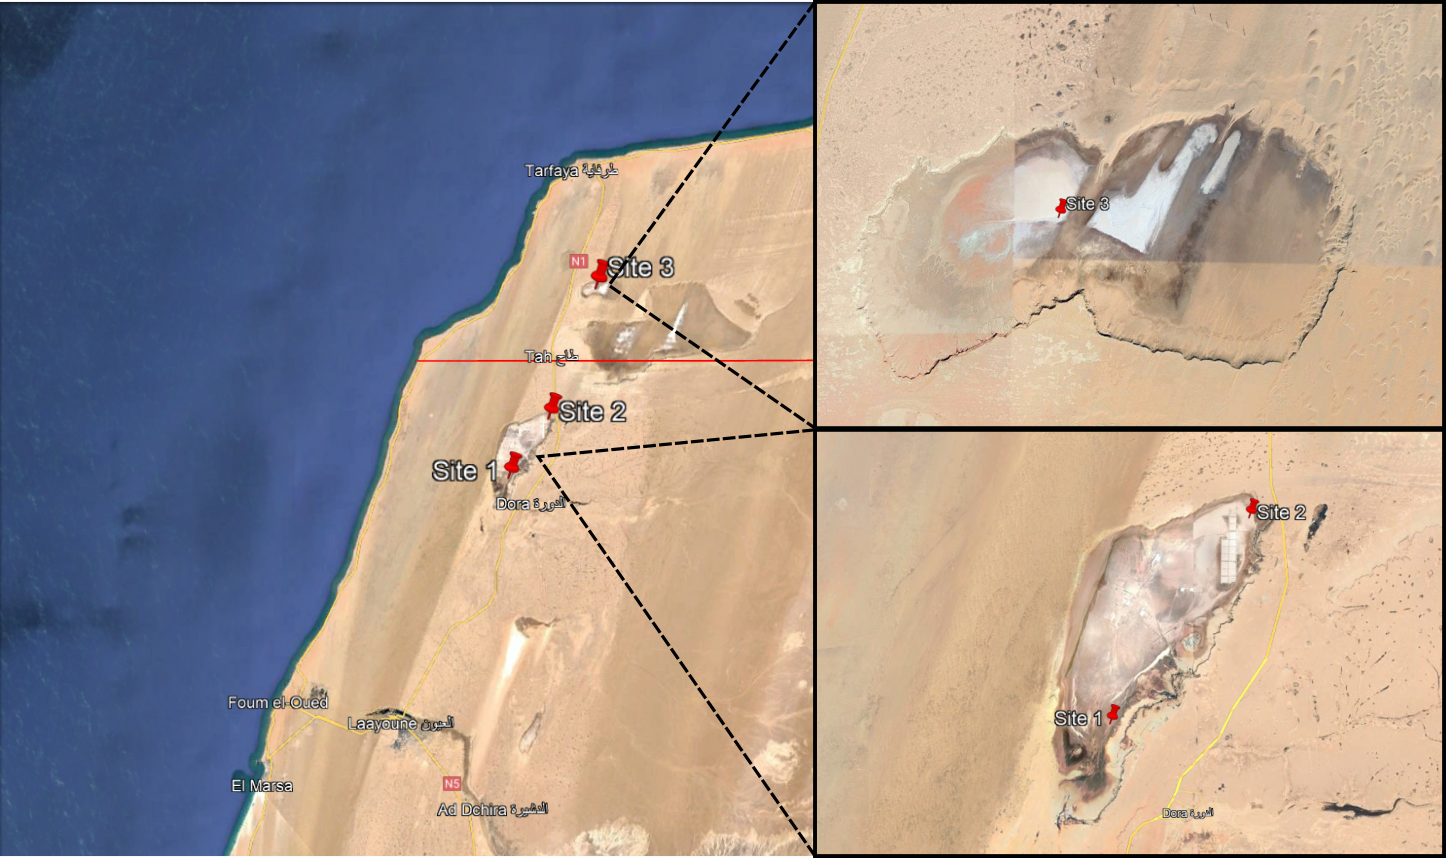
EPSC2022-1043 | Posters | TP17
Western Sahara salt plains as a potential novel Mars analogueMon, 19 Sep, 18:45–20:15 (CEST) | Poster area Level 1 | L1.92
TP18 | Ionospheres of unmagnetized or weakly magnetized bodies
EPSC2022-527 | Posters | TP18
Investigating the Global Dust Storm in Mars Year 28 with Mars ExpressThu, 22 Sep, 18:45–20:15 (CEST) | Poster area Level 1 | L1.84
OPS2 | Exploration of Titan
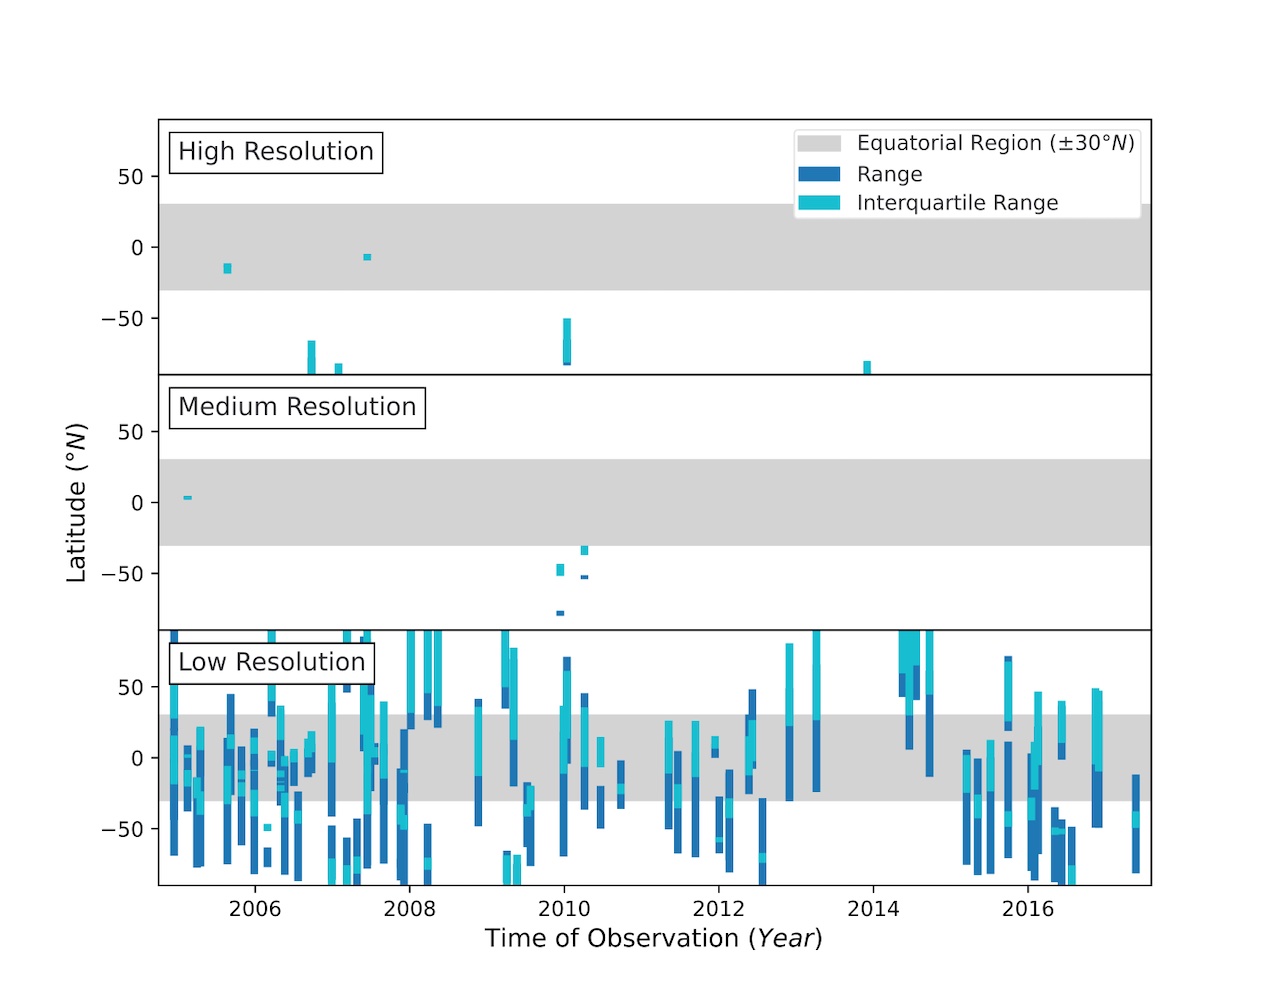
EPSC2022-463 | Posters | OPS2
Stratospheric HCN and Evolution of a Mixing Barrier in Titan’s Equatorial Region from Low-Resolution Cassini/CIRS SpectraMon, 19 Sep, 18:45–20:15 (CEST) | Poster area Level 1 | L1.117
OPS4 | Jupiter and Giant Planet System Science: New Insights From Juno
EPSC2022-632 | Posters | OPS4
Comparing atmospheric models of Jupiter, can we reduce the degeneracy of this problem?Thu, 22 Sep, 18:45–20:15 (CEST) | Poster area Level 1 | L1.96

EPSC2022-932 | Posters | OPS4
Studying the dynamics of Jupiter using a 3D general circulation model constrained by radio occultation measurementsThu, 22 Sep, 18:45–20:15 (CEST) | Poster area Level 1 | L1.99
EPSC2022-1053 | Posters | OPS4
Deriving mixing ratios of heavier neutral species in Saturn's ionosphere from light ion measurementsThu, 22 Sep, 18:45–20:15 (CEST) | Poster area Level 1 | L1.100
OPS5 | Outer Planet Moons: Environments and Interactions
EPSC2022-1 | Posters | OPS5
Influence of Europa’s Time-Varying Electromagnetic Environment on Magnetospheric Ion Precipitation and Surface WeatheringThu, 22 Sep, 18:45–20:15 (CEST) | Poster area Level 1 | L1.103
EPSC2022-931 | Posters | OPS5
DSMC Simulations of Io’s atmosphereThu, 22 Sep, 18:45–20:15 (CEST) | Poster area Level 1 | L1.102
MITM5 | Machine Learning in Planetary Sciences
EPSC2022-680 | Posters | MITM5
Exploring the diversity in pyroclastic deposits and volcanic vents on Mercury with machine learning techniquesThu, 22 Sep, 18:45–20:15 (CEST) | Poster area Level 1 | L1.116
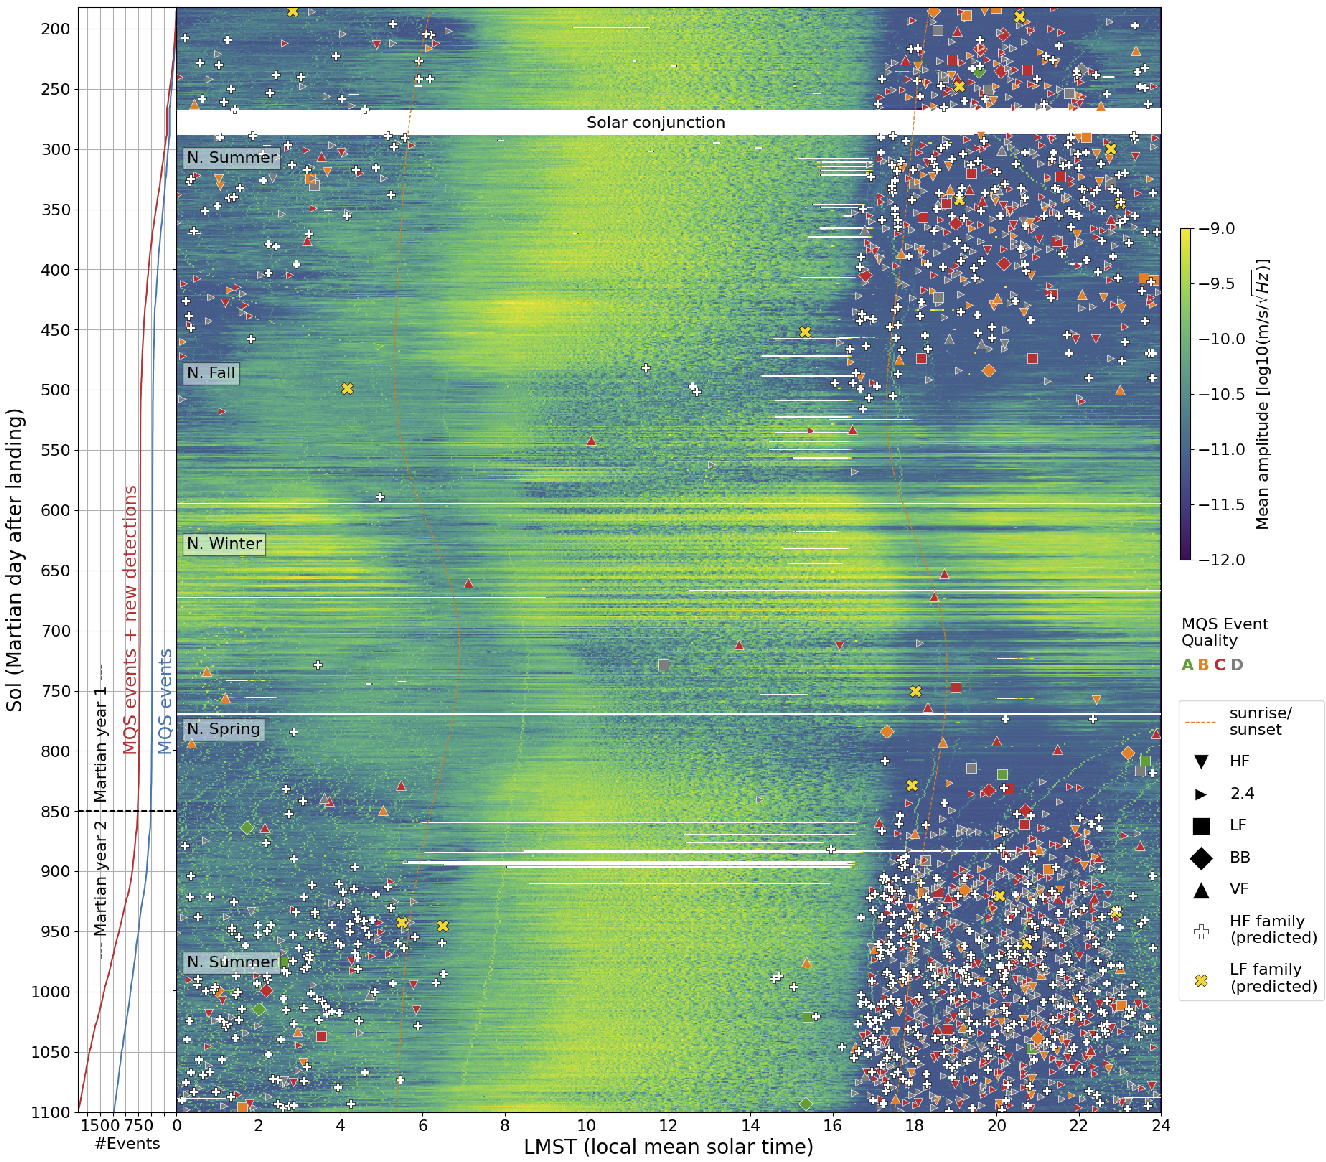
EPSC2022-1066 | Posters | MITM5
A Deep Marsquake CatalogueThu, 22 Sep, 18:45–20:15 (CEST) | Poster area Level 1 | L1.117
MITM6 | Planetary space weather
EPSC2022-867 | Posters | MITM6
Monitoring Earth Using Radio Wave Phase ImagerThu, 22 Sep, 18:45–20:15 (CEST) | Poster area Level 1 | L1.120
MITM12 | Planetary Missions, Instrumentations, and mission concepts: new opportunities for planetary exploration
EPSC2022-1091 | Posters | MITM12
Mutual impedance experiments as a diagnostic for magnetized space plasmasThu, 22 Sep, 18:45–20:15 (CEST) | Poster area Level 1 | L1.138
SB1 | Asteroid observations and modelling: properties and evolution of individual objects, families, and populations
EPSC2022-958 | Posters | SB1
Models and physical properties of asteroids from optical and infrared dataMon, 19 Sep, 18:45–20:15 (CEST) | Poster area Level 2 | L2.16
EPSC2022-1000 | Posters | SB1
Asteroid reference phase functions from the ATLAS photometryMon, 19 Sep, 18:45–20:15 (CEST) | Poster area Level 2 | L2.19
SB2 | Small bodies from the active Main Belt to the Oort cloud and beyond
EPSC2022-161 | Posters | SB2
Non-gravitational parameters of the comet 45P/Honda-Mrkos-PajdusakovaMon, 19 Sep, 18:45–20:15 (CEST) | Poster area Level 2 | L2.33
SB4 | Computational astrophysics and numerical models of small bodies and planets
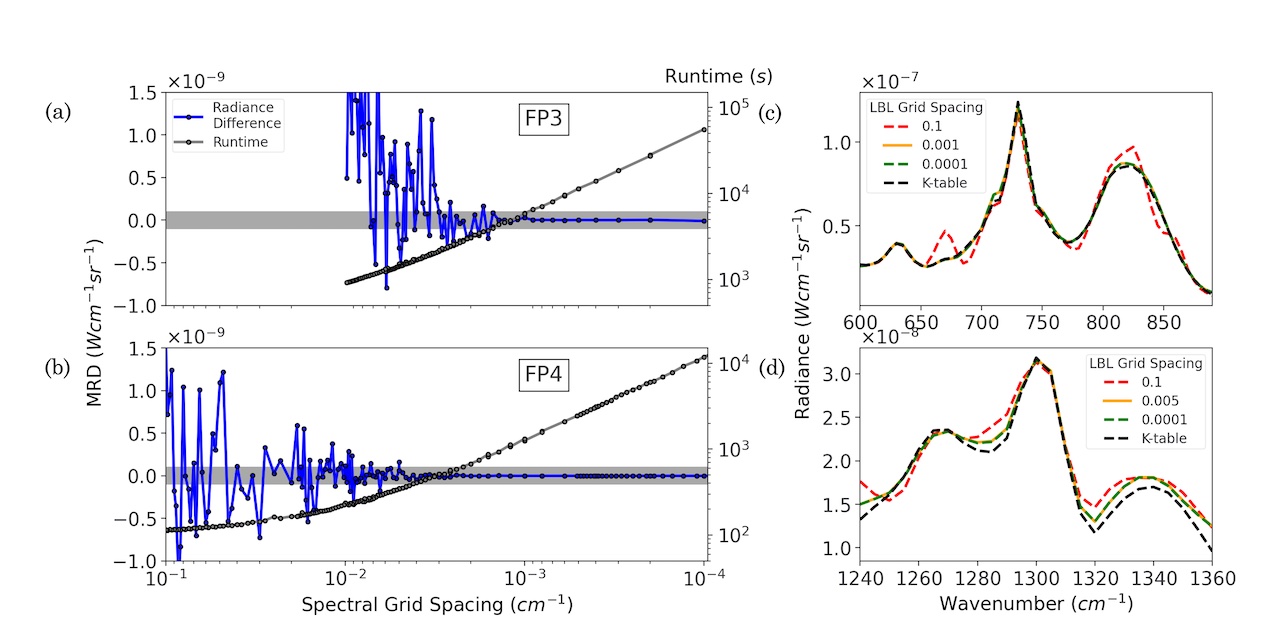
EPSC2022-783 | Posters | SB4
Time efficient modelling of cometary dust environments to support future cometary mission planning and operationsThu, 22 Sep, 18:45–20:15 (CEST) | Poster area Level 2 | L2.1
SB5 | Tools for characterizing planetary and small bodies surfaces, atmospheres, and dust particles (Imagery, photometry, spectroscopy, spectrophotopolarimetry)
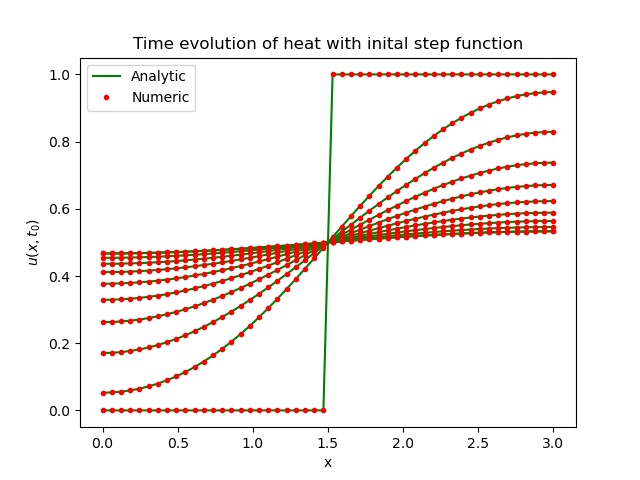
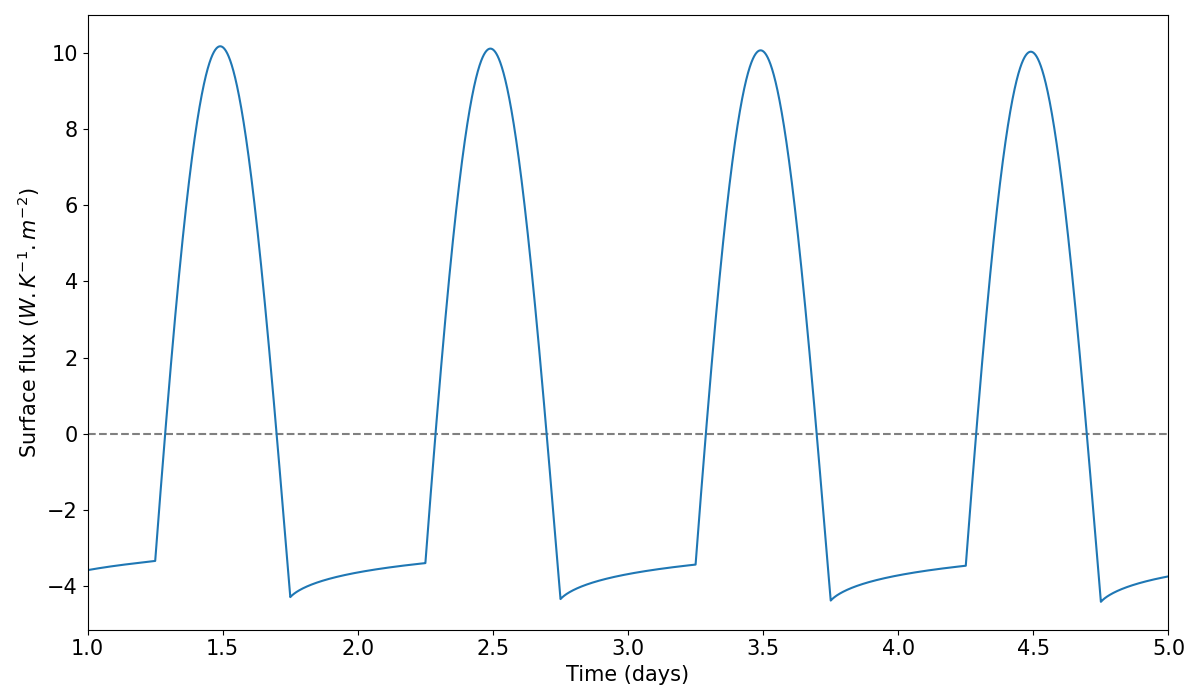
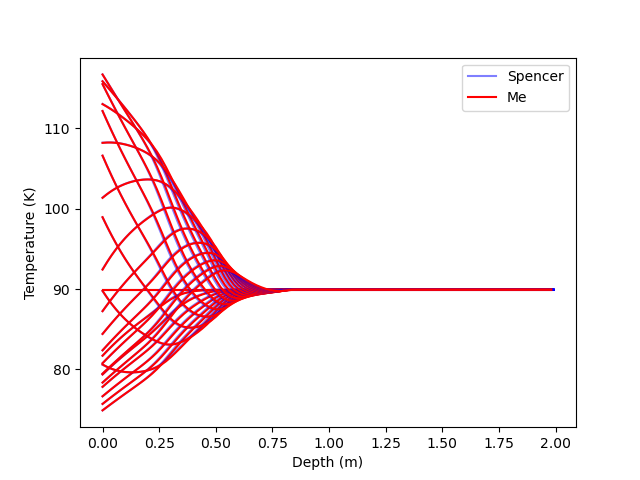
EPSC2022-592 | Posters | SB5
Numerical modeling of thermal wave in layered icy surfaceThu, 22 Sep, 18:45–20:15 (CEST) | Poster area Level 2 | L2.11

SB7 | Laboratory measurements of returned Hayabusa2 samples, meteorites and planetary analogues
EPSC2022-827 | Posters | SB7
Testing the applicability of NEWTON Susceptometer for fast and in-situ determination of the magnetic susceptibility, in meteorite samples and a Martian terrestrial analogue.Thu, 22 Sep, 18:45–20:15 (CEST) | Poster area Level 2 | L2.22
SB8 | Surface and interiors of small bodies, meteorite parent bodies, and icy moons: thermal properties, evolution, and structure
EPSC2022-178 | Posters | SB8
Penetrometry in Microgravity- From Brie to BennuThu, 22 Sep, 18:45–20:15 (CEST) | Poster area Level 2 | L2.26
SB9 | Latest Science Results in Planetary Defence
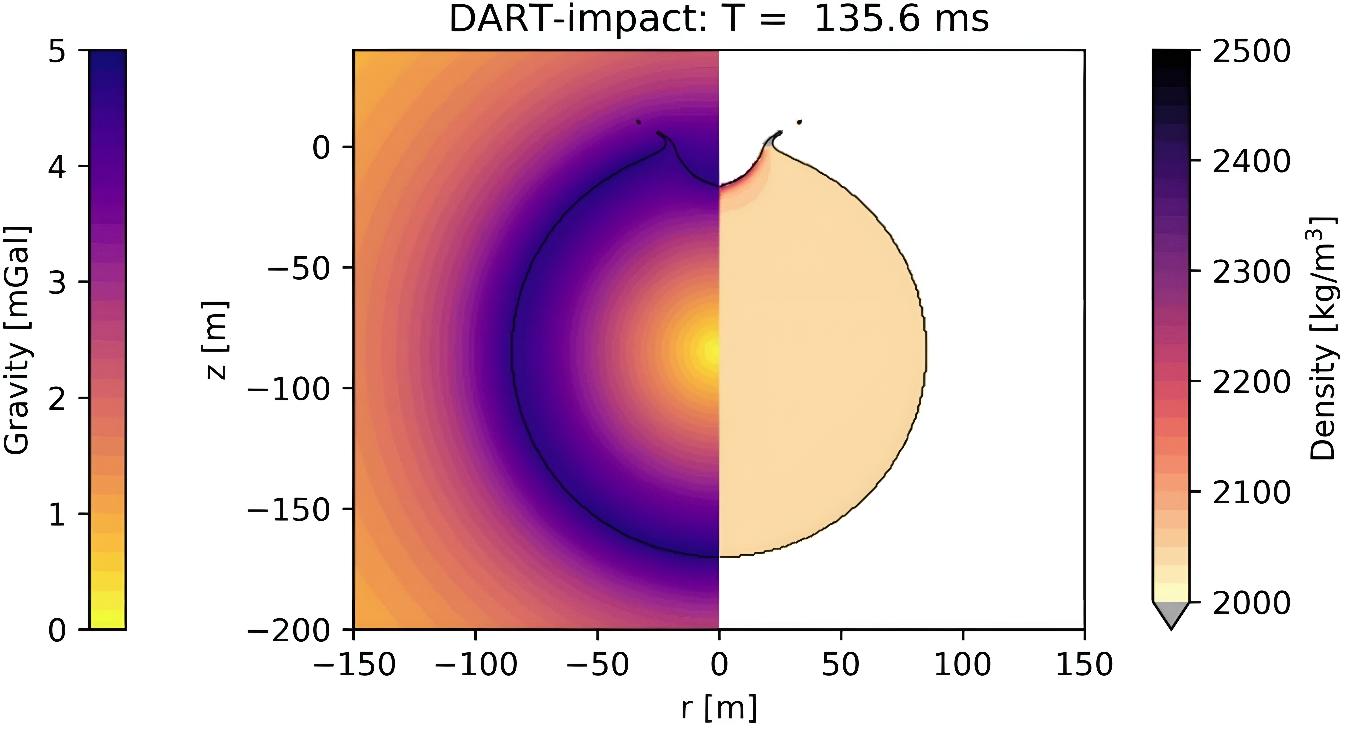
EPSC2022-404 | Posters | SB9
Hypervelocity impact simulations of DART on asteroid Dimorphos: Impact-generated porosity and gravity anomaliesMon, 19 Sep, 18:45–20:15 (CEST) | Poster area Level 2 | L2.47
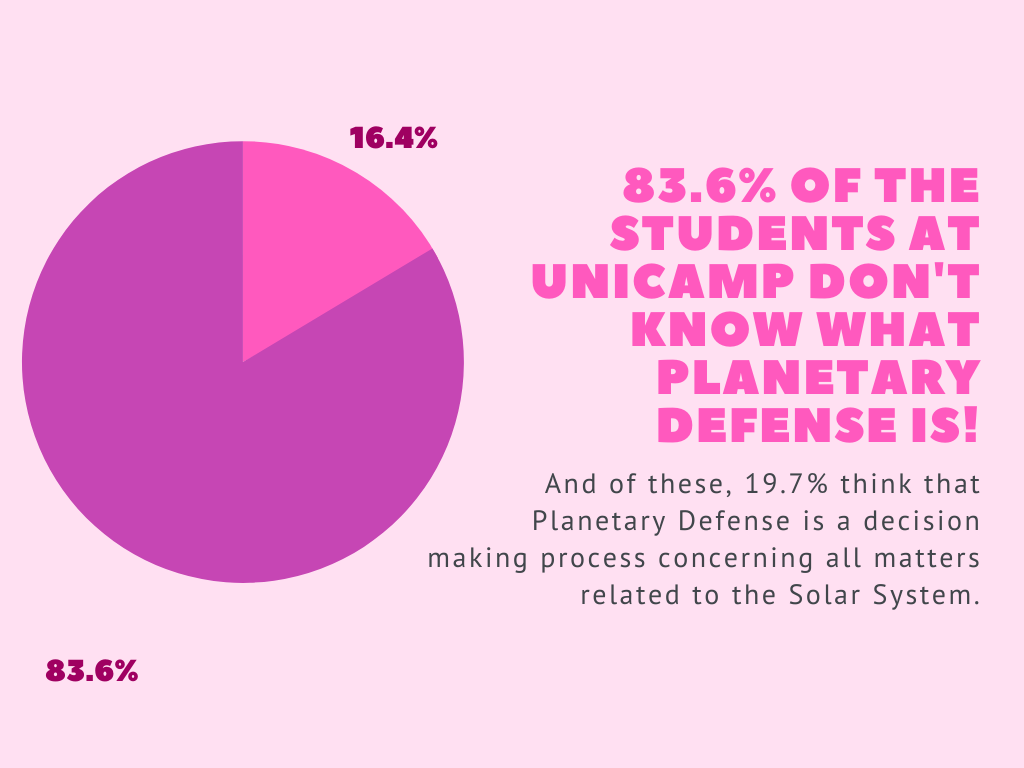
EPSC2022-682 | Posters | SB9
Planetary Defense: Public Perception and How to CommunicateMon, 19 Sep, 18:45–20:15 (CEST) | Poster area Level 2 | L2.48
EXOA1 | Formation, evolution, and stability of extrasolar systems
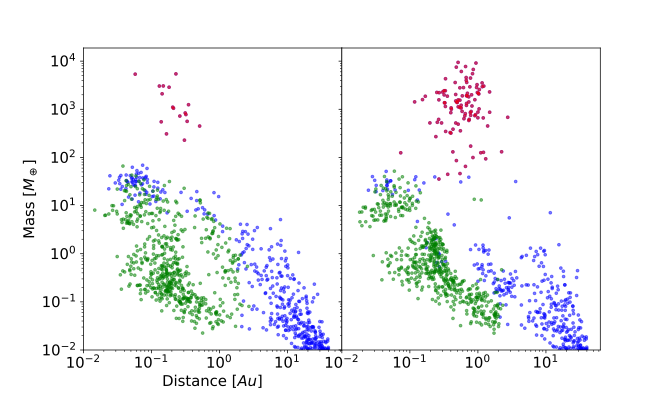
EPSC2022-135 | Posters | EXOA1
A population level study on the influence of planetesimal fragmentation on planet formationMon, 19 Sep, 18:45–20:15 (CEST) | Poster area Level 2 | L2.51
EPSC2022-1104 | Posters | EXOA1
Impact of growing planets on the evolution of protoplanetary disksMon, 19 Sep, 18:45–20:15 (CEST) | Poster area Level 2 | L2.57
EXOA2 | The hidden newly born planets
EPSC2022-942 | Posters | EXOA2
A Spiral arm or a Vortex in the outer disk of PDS-70 ?Mon, 19 Sep, 18:45–20:15 (CEST) | Poster area Level 2 | L2.63
EXOA4 | Interiors and Atmospheres of Rocky Planets: Formation, Evolution and Habitability
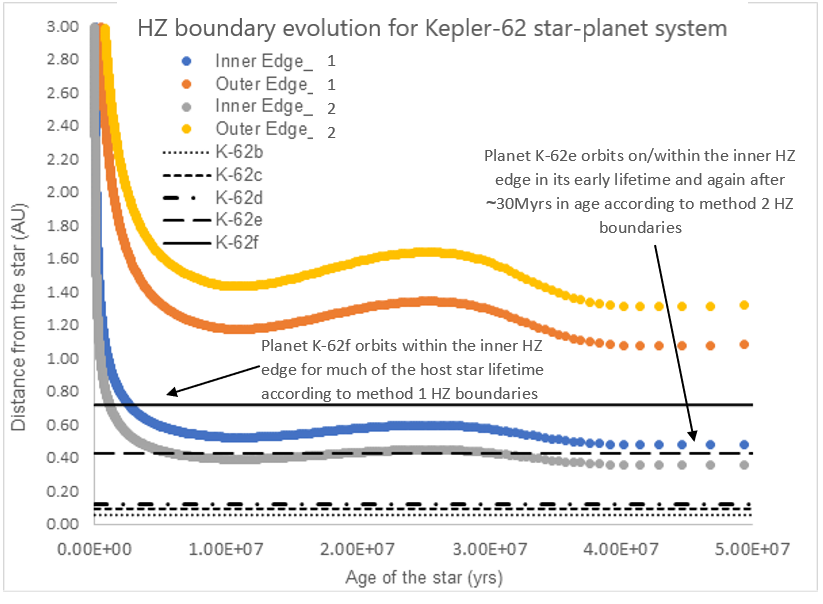
EPSC2022-369 | Posters | EXOA4
Characterising the Potential for Planetary Habitability: A Study of the Temporal Evolution of Exoplanet Habitable ZonesMon, 19 Sep, 18:45–20:15 (CEST) | Poster area Level 2 | L2.67

EPSC2022-585 | Posters | EXOA4
Critical factors for plate tectonics on rocky planetsMon, 19 Sep, 18:45–20:15 (CEST) | Poster area Level 2 | L2.71
EPSC2022-830 | Posters | EXOA4
The stability of benzene in planetary atmospheresMon, 19 Sep, 18:45–20:15 (CEST) | Poster area Level 2 | L2.69
EXOA5 | Devolatilization During Rocky (Exo)planet Formation: Mechanisms, Simulations, and Observations
EPSC2022-581 | Posters | EXOA5
ICAPS: Dust aggregate properties and growth derived from Brownian translation and rotation from the ballistic to the diffusive limitMon, 19 Sep, 18:45–20:15 (CEST) | Poster area Level 2 | L2.75

EXOA7 | Future instruments to detect and characterise extrasolar planets and their environment
EPSC2022-791 | Posters | EXOA7
Climate change drives degradation of future observations with ground-based telescopesThu, 22 Sep, 18:45–20:15 (CEST) | Poster area Level 2 | L2.45
EXOA9 | Towards better understanding planets and planetary systems diversity
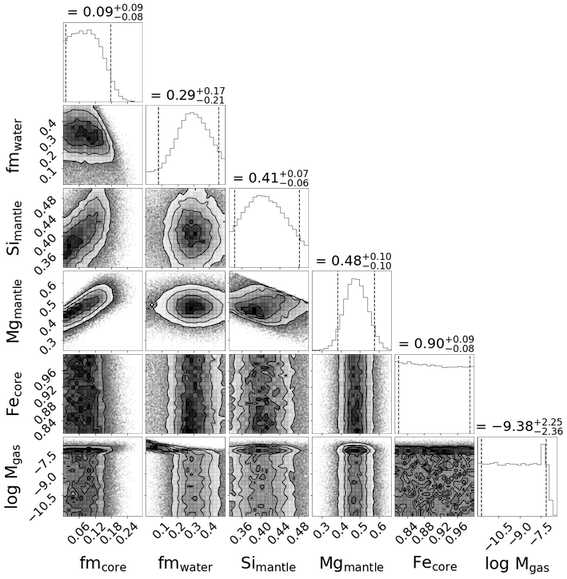
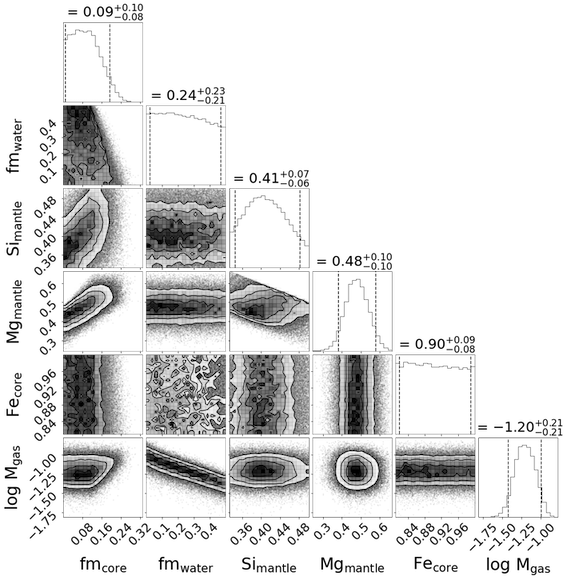
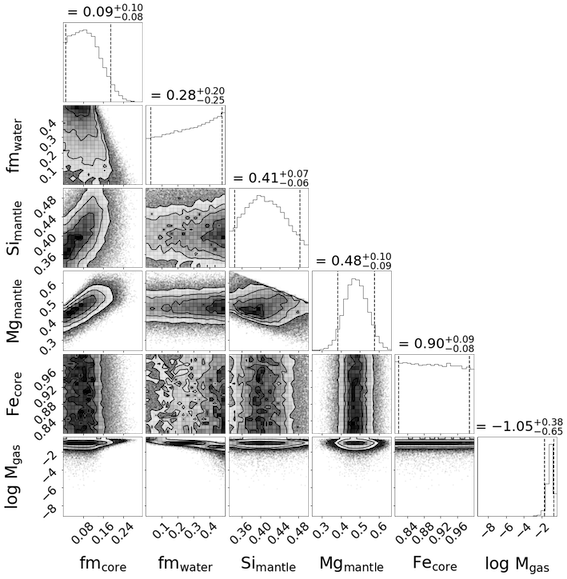
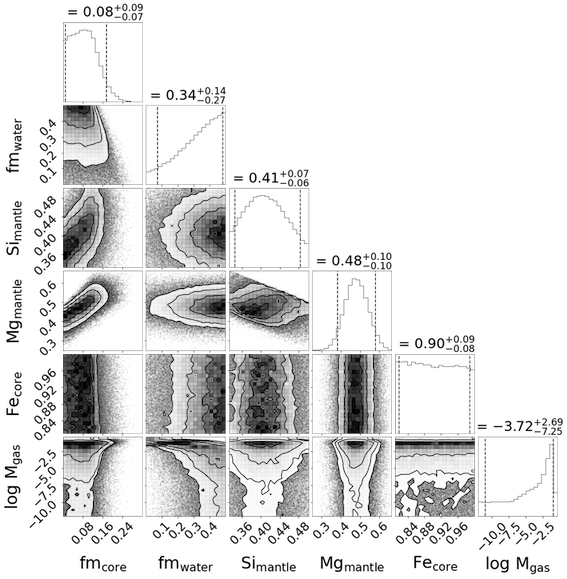
EPSC2022-320 | Posters | EXOA9
A Neural Network Based Approach to Modelling the Internal Structure of Transiting Exoplanets and Its Application to Planets Observed by the CHEOPS MissionThu, 22 Sep, 18:45–20:15 (CEST) | Poster area Level 2 | L2.58
EPSC2022-499 | Posters | EXOA9
A Search for Long-Period Transiting Exoplanets with TESS and CHEOPSThu, 22 Sep, 18:45–20:15 (CEST) | Poster area Level 2 | L2.61
EXOA15 | Habitability and biosignatures for the search for life in our Solar system
EPSC2022-537 | Posters | EXOA15
Responses of a desert cyanobacterium to prolonged exposure to perchlorate: implications for the habitability of Mars and In-Situ Resource UtilizationThu, 22 Sep, 18:45–20:15 (CEST) | Poster area Level 2 | L2.70
EPSC2022-550 | Posters | EXOA15
Perchlorate stress responses of Haloferax volcanii and implications on the habitability of MarsThu, 22 Sep, 18:45–20:15 (CEST) | Poster area Level 2 | L2.71
EPSC2022-692 | Posters | EXOA15
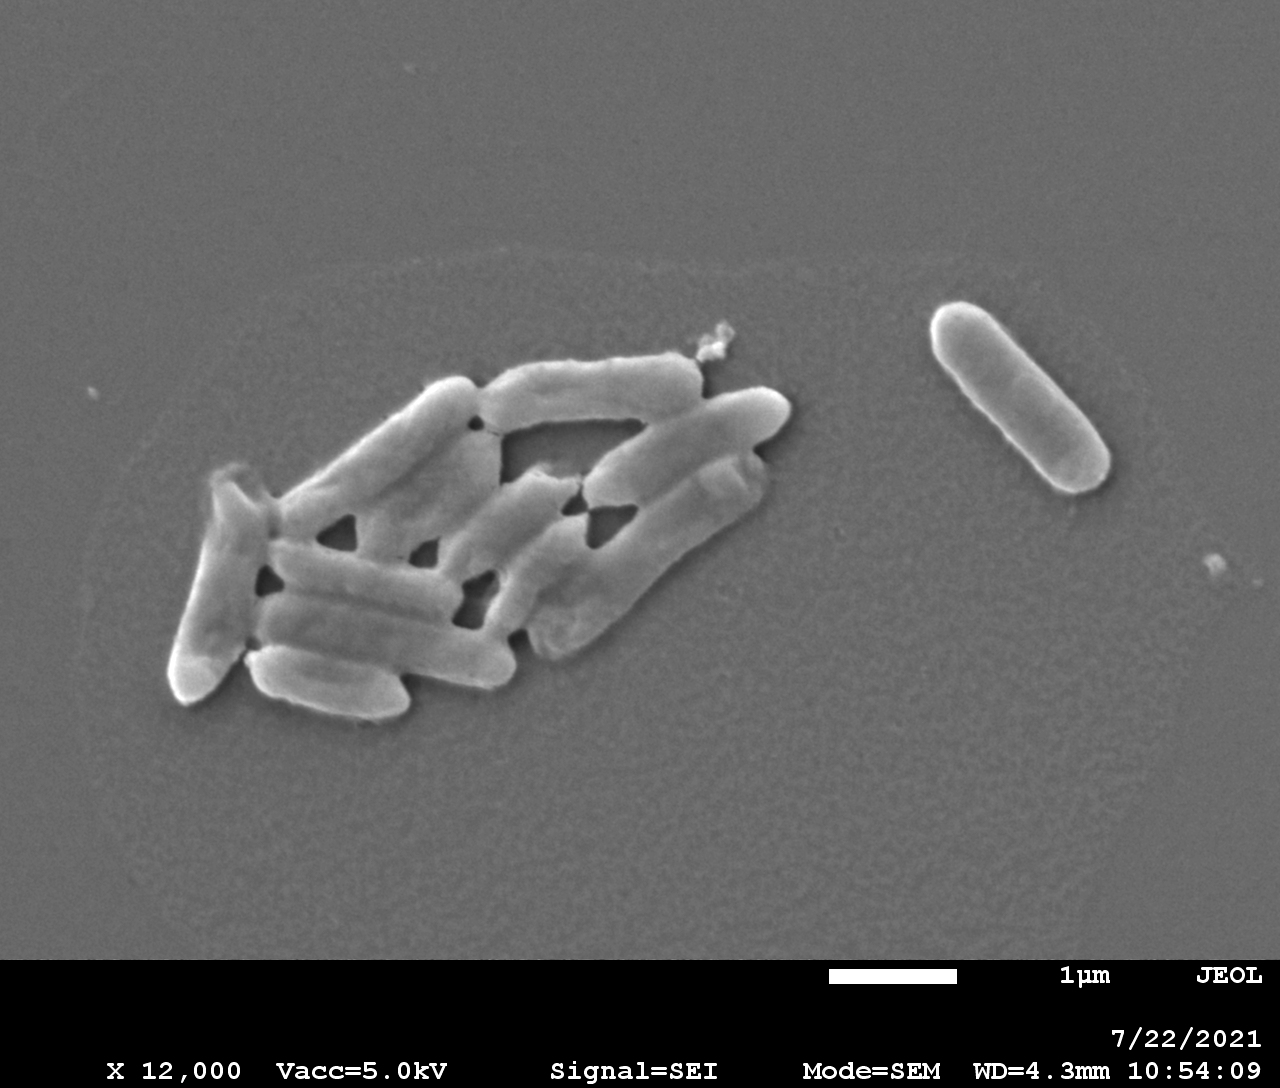
Perchlorate-induced stress responses of Escherichia coli and their implications for the habitability of MarsThu, 22 Sep, 18:45–20:15 (CEST) | Poster area Level 2 | L2.72
EPSC2022-952 | Posters | EXOA15
Lipidomics Based Microbial Ecology Snapshot of Ophiolitic RocksThu, 22 Sep, 18:45–20:15 (CEST) | Poster area Level 2 | L2.74
ODAA5 | Tools, resources and opportunities for education initiatives in planetary science and astronomy
EPSC2022-1172 | Posters | ODAA5
Chasing Comets in the Land of Dragons/Chwilotwyr Comedau yn Wlad y Dreigiau: Pro-Am-Schools collaboration to engage students in STEM in Wales.Thu, 22 Sep, 18:45–20:15 (CEST) | Poster area Level 2 | L2.81