Multiple terms: term1 term2
red apples
returns results with all terms like:
Fructose levels in red and green apples
Precise match in quotes: "term1 term2"
"red apples"
returns results matching exactly like:
Anthocyanin biosynthesis in red apples
Exclude a term with -: term1 -term2
apples -red
returns results containing apples but not red:
Malic acid in green apples
hits for "" in
Network problems
Server timeout
Invalid search term
Too many requests
Empty search term
TP3

This session aims at understanding planetary impact processes at all scales, in terms of impact cratering and ejecta dynamics, crater distribution and crater chronology, material mixing, shock metamorphism and other geochemical consequences, ejecta-atmosphere interactions, impact induced climatic and environmental effects, and biotic responses.
We welcome oral and poster presentations across this broad range of studies about natural or artificial impact collision phenomena on planetary surfaces and small bodies. In particular, abstracts on impact modelling, impact laboratory experiments, geologic and structural mapping, petrographic and geochemical analysis of impact products, as well as remote sensing observations from space missions to planets and small bodies. We also welcome the examination of competing hypotheses for the giant impact formation of terrestrial and outer solar system bodies.
Session assets
Introduction: Calcite is a ubiquitous mineral at the earth’s surface. While shock effects for most of the rock-forming silicates have been intensely studied and calibrated experimentally against shock pressure, unambiguous shock effects for calcite, are rare. Thus, calcite has a currently overlooked potential as an indicator for shock deformation. Here we examine the potential of high twin densities as a shock effect in calcite.
Methods: A 25 cm cube of Carrara Marble was selected as target material. A two-stage light gas gun at the Fraunhofer Ernst-Mach-Institute for High-Speed Dynamics in Freiburg (EMI), Germany was used to accelerate a spherical 2.5 mm iron meteorite projectile to 5 km s−1. A thin section of the crater subsurface was prepared and microstructures were mapped in detail [1]. Linear twin densities (i.e., the number of twins per mm) were measured using the line count method (e.g. [2]) in 39 BSE images. Additional TEM foils for twin density measurements were prepared with FIB at the GFZ Potsdam.
Results: The impact created a crater with a diameter of 56.6 ± 4.2 mm and a depth of 6.0 ± 0.4 mm. Polarized light microscopy analysis of the thin section shows that apart from intra-granular cracks and tensile fractures the main deformation features in the crater subsurface are calcite twin lamellae and open cleavage. Under crossed polarized light, some domains in calcite grains show no extinction behavior.
Twin densities in BSE images show local maxima of ~4000 twins/mm over short line sections of 10 µm, while averaged grain measurements near the surface can reach ~2000 twins/mm and gradually decrease with depth (Fig. 1). In the two TEM-foils a twin density of 4373 ± 711 twins/mm was measured at the crater floor, while at 350 µm below the crater floor, a twin density of 2924 ± 621 twins/mm was determined.
The cratering experiment was numerically modeled using the iSALE-2D Eulerian shock physics code in the “Chicxulub” version [3]. Calculated peak pressures exceed 4 GPa at the crater floor but rapidly decrease over several mm depth. Shear stresses of 1378 ± 130 MPa and 1333 ± 130 MPa were calculated for the two TEM samples located near the crater floor. Values determined from the BSE images range from 1378-849 MPa over ~5 mm depth in the crater subsurface.
Twin density line counting results of the TEM and BSE images are plotted against the numerically derived shear stress (Fig. 1). Experimental data from [2] are also plotted, as well as the twin density-based piezometer from [2]. The new impact data points lie above the piezometer. Combining all data points, the piezometer can be revised, giving the following equation:
log(τ)=0.738±0.057+(0.718±0.024)logNL
where τ is the shear stress and NL is the twin density.
Discussion: The systematic relationship between twin density in calcite and applied shear stress was derived for tectonic situations (e.g., [2]). The highest twin densities from [2] are less than 800 twins/mm, and the highest experimental shear stresses were less than 300 MPa. These stresses are well above the maximum shear stresses of ~140 MPa for natural limestone samples reported in [4]. In comparison, peak shear stresses from numerical models of shock waves that occur during the impact cratering process are calculated at 1-2 GPa for shock pressures between 5 and 50 GPa in crustal rocks [5].
Apart from maximum crustal shear stresses for Carrara marble at ~125 MPa, higher shear stresses in the crust are possible for other rock types. [6] calculate maximum shear stresses of ~0.7 GPa for quartzites and granites (Fig. 1). As these values are below shear stress values calculated for shock deformation in impact craters, the occurrence of twin densities >1000 twins/mm, in particular in sedimentary or other supracrustal rocks, must indicate high shear stresses characteristic for shock waves.
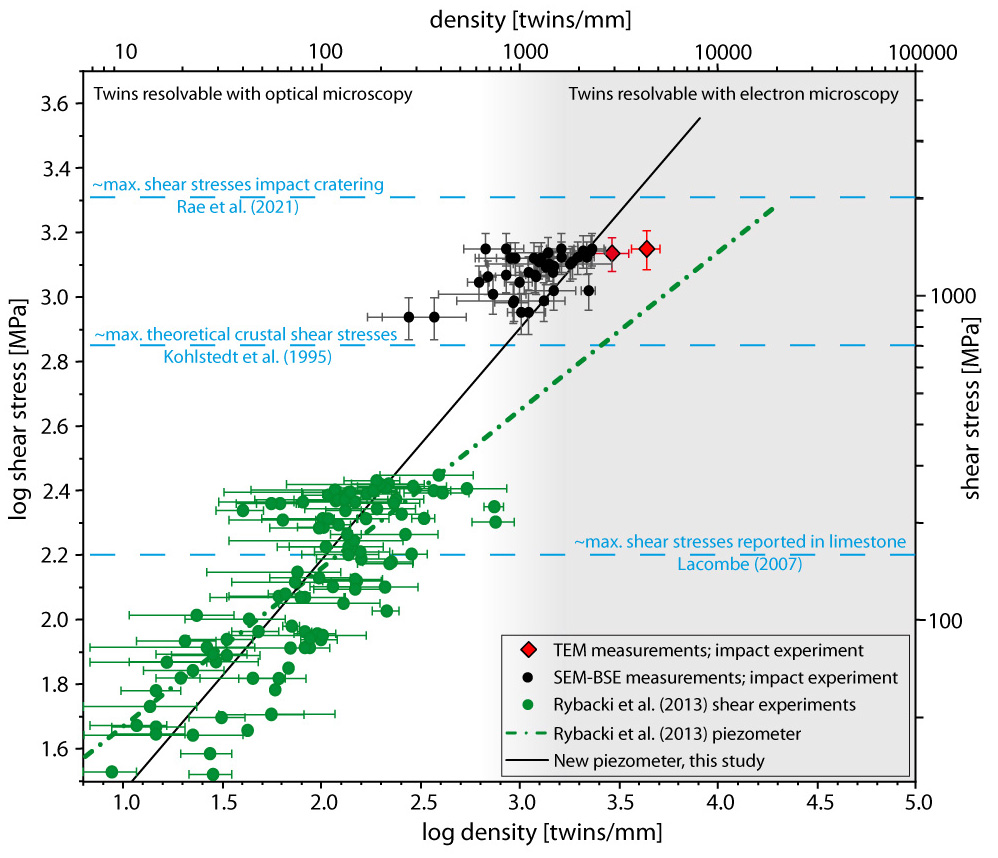
Figure 1: Calcite twin density from impact and shear experiments plotted against shear stress. Modified from [1].
Conclusions: We find that twin densities above 1000 twins/mm in calcite can be used as a novel indicator for high shear stresses encountered in impact cratering settings, and thus as an indicator for shock metamorphism. In polarized light microscopy, the loss of extinction and reduced interference colors in calcite in the shallow crater subsurface regions are an initial indicator for intense twinning. However, full recognition of these high twin densities requires either high resolution SEM imagery or TEM. Further experimental calibration data are certainly necessary to validate and better constrain these findings, and future studies should additionally take a detailed look at the effect of grain size on twin density (c.f. [7]).
References:
[1] Poelchau, M. H., Winkler, R., Kenkmann, T., Wirth, R., Luther, R., & Schäfer, F. (2025). Extreme twin densities in calcite—A shock indicator. Geology, 53(3), 279-283.
[2] Rybacki E., Evans, B., Janssen, C., Wirth, R., & Dresen, G. (2013) Influence of stress, temperature, and strain on calcite twins constrained by deformation experiments. Tectonophysics, 601, 20–36.
[3] Wünnemann, K., Collins, G. S., and Melosh, H. J. (2006). A strain-based porosity model for use in hydrocode simulations of impacts and implications for transient crater growth in porous targets. Icarus, 180, 514–527.
[4] Lacombe, O. (2007). Comparison of paleostress magnitudes from calcite twins with contemporary stress magnitudes and frictional sliding criteria in the continental crust: Mechanical implications. Journal of Structural Geology, 29(1), 86-99.
[5] Rae, A. S., Poelchau, M. H., & Kenkmann, T. (2021). Stress and strain during shock metamorphism. Icarus, 370, 114687.
[6] Kohlstedt, D. L., Evans, B., & Mackwell, S. J. (1995). Strength of the lithosphere: Constraints imposed by laboratory experiments. Journal of Geophysical Research: Solid Earth, 100(B9), 17587-17602.
[7] Rutter, E., Wallis, D., & Kosiorek, K. (2022). Application of electron backscatter diffraction to calcite-twinning paleopiezometry. Geosciences, 12(6), 222.
How to cite: Poelchau, M., Kenkmann, T., Winkler, R., Wirth, R., Luther, R., and Schäfer, F.: Extreme twin densities in calcite as a shock indicator , EPSC-DPS Joint Meeting 2025, Helsinki, Finland, 7–13 Sep 2025, EPSC-DPS2025-819, https://doi.org/10.5194/epsc-dps2025-819, 2025.
Introduction: Shock-recovery experiments are standard practice for geoscientists who desire to understand and reproduce shock features in planetary rocks [1]. When carefully designed [2,3], such experiments can induce pressures from a few GPa (impedance technique) to 70 GPa (reverberation technique). In this study, we describe the results of a shock-recovery experiment using the reverberation technique, which surpassed initial expectations by producing localized melting within a dense dunite host. The study was initially designed to investigate shock melting of troilite and its potential migration into fractures [4]. For this reason, troilite powder was placed into drilled cavities (DCs) within a dunite disk before shock loading.

Fig. 1. Setup of the cylindrical shock-recovery experiment with a) the dunite sample disk with drilled cavities (DCs), and b) the cylindrical assemblage. A tantalum foil wrapped the sample.
Methods: A dunite [5] sample disk hosted nine DCs of ~1 mm diameter and a few hundred μm in depth. Three DCs were filled with troilite (FeS [6], Fig. 1a). The sample disk was wrapped in tantalum (Ta) foil, placed into an ARMCO-iron (i.e., soft iron, >99.85% Fe) sleeve, and tightly sealed with a piston-like ARMCO-iron element (Fig. 1b). The setup was impacted by propelling a flyer plate onto an ARMCO-iron driver plate positioned ahead of the sample disk.
After shock loading, the sample was analysed at three locations: (i) the bottom surface of the sample adhering to the driver plate, (ii) the surface of the piston-like iron element, and (iii) transverse cross-sections of the disk and driver plate. Computer tomography was used to locate the DCs before preparing thin sections. Semi-quantitative chemical analyses (energy-dispersive spectrometry, EDS) were conducted to characterize the melts. The experiment was modeled with the iSALE shock physics code [7], simulating the sample with a FeS-filled DC, including Ta foil and an iron driver plate.

Fig. 2. SEM-BSE images depicting a) the heavily shocked central DC initially filled with FeS, inducing Ta, silicate, and sulfide melts, b) an initially empty DC with shock-induced Ta melts and partially melted olivine, c) an EDS map showing intrusions of Ta, silicate, and troilite melts in fractures of the dunite disk, and d) partial melts of olivine in contact with Ta melts.
Results: The sample was shock-loaded to a pressure of ~60 GPa after reverberations. The shock caused fracturing of the sample disk, inducing large tensile fractures and parallel fractures in olivine grains. Substantial crushing of olivine grains at DC locations triggered the formation of larger shock-induced cavities. The experimental pressure was sufficient to induce collapse of the DCs and partial melting of troilite within the FeS-filled DCs. However, the presence of DCs caused secondary pressure reverberations with localized melting of metallic phase components (iron, Ta foil) and silicates alongside troilite.

The resulting melts intruded into fractures, forming melt veins and melt breccia within and around the former DCs (Fig. 2). Partial melting of olivine with Ta is observed at the DCs (Fig. 2d). In the FeS-filled DC (Fig. 2a,c), the intruding melts contain FeS-rich particles embedded in a matrix of Ta- and silicate-rich melt. These FeS particles developed elongated morphologies (Fig. 2c). At initially empty DCs, Fe- and Ta-rich particles included a matrix of Ta- and silicate-rich melts (Fig. 2b). Some FeS-rich melts remained as dense clusters, exhibiting partial melting. Notably, melts at the site of initially empty DC cemented large SICs that had developed through the entire thickness of the samples beneath the DCs (Fig. 2 b). Some melts entrained unaffected olivine fragments.
Discussion and conclusions: All observations on the sample disk (melting, fracturing, deformations) generally aligned with the numerical models, except for the melting of Ta and iron (Table 1); iSALE does not simulate fracturing and melt migration. Although troilite was not the dominant contributor to melt intrusion into fractures, the resulting melt veins resemble melt breccias [8], which typically form when melts entrain grains while propagating into a less shocked environment (here, away from the DCs).
According to numerical models, these melts occurred from DCs that caused pressure concentration points (hotspots) where pressures exceeded the nominal shock pressure of ~60 GPa by at least 10 GPa. Considering that Ta appeared to shock-melt more intensively than the silicate and troilite components, the sequence of shock melting needs further explanation. Tantalum melts at 3000 K at ambient pressure or at shock pressures over 150 GPa. In contrast, troilite shock-melts at pressures >60 GPa, and dunite at >100 GPa. Therefore, the shock melting of Ta likely resulted from several compressive and tensile events, which allowed for cumulative heat buildup.
We hypothesize that Ta foil, initially bent, was first shocked by the collapsing iron driver plate and then re-shocked by the impact of its shock-heated fragments projected into the DC walls during the collapse (spalling). Additional pressure amplification occurred due to the complete closure of the DCs and the shock compression of troilite grains or dunite fragments located within them. The added thermal input likely tipped the Ta over its melting point.
In conclusion, the configuration of DCs enabled the creation of localized melting, whereas the dunite primarily experienced fracturing without melting elsewhere in the sample disk. These findings are significant for shock-recovery experiments aiming to produce melt, melt breccias, or shock veins. Strategically doping DCs with materials of interest enables targeted melting effects. Moreover, the design of metallic sample holders with embedded DCs may allow for controlled and simultaneous shock-loading of multiple materials in a single experimental run.
References:
[1] Stöffler et al. (2018) Meteorit. Planet. Sci. 53, 5–49. [2] Langenhorst and Deutsch (1994) Earth Planet. Sci. Lett. 125, 407–420. [3] Langenhorst and Hornemann (2005) EMU Notes Mineral. 7, 357–387. [4] Kohout T. et al. (2014) Icarus, 228, 78–85. [5] Heikura P. et al. (2010) Geological Survey of Finland, report M06/4723/2009/68, 50 pp. [6] Moreau et al. (2021) Meteorit. Planet. Sci., 57(3), 588–602. [7] Wünnemann K. et al. (2006) Icarus, 180, 514-527. [8] Pati J. K. and Reimold W. U. (2007) J. Earth Syst. Sci., 116(2), 81–98.
How to cite: Moreau, J.-G., Stojic, A. N., Jõeleht, A., Aurich, H., Glößner, C., Virro, I., Somelar, P., Hietala, S., and Plado, J.: Shock-recovery experiment in dunite: shock features and melting hotspots from controlled imperfections., EPSC-DPS Joint Meeting 2025, Helsinki, Finland, 7–13 Sep 2025, EPSC-DPS2025-62, https://doi.org/10.5194/epsc-dps2025-62, 2025.
Parallel to the study of accessory minerals as potential shock indicators, the main rock forming minerals quartz and olivine, representative of terrestrial impact cratering and planetary collisions recorded in meteorites, respectively, are still intensively used for constraining shock metamorphism. Here, we present investigations on shocked quartz from a terrestrial impact structure and shocked olivine from a chondrite meteorite, where at least two high pressure polymorphs coexist, with the aim of constraining the formation process and, thus, the shock conditions.
In the L6 ordinary chondrite Alfianello, three polymorphs with olivine composition were observed, namely olivine itself, wadsleyite, and ringwoodite. The occurrence of fine-grained aggregates of wadsleyite and ringwoodite, investigated by transmission electron microscopy (TEM) and 3D electron diffraction, and the presence of lamellar ringwoodite in olivine support the coexistence of different shock-induced processes in the same sample. In the case of the wadsleyite-ringwoodite aggregates, the random mutual crystallographic orientation and the complementary Fe/Mg ratio, as well as the occurrence in clasts within impact melt pockets or in the vicinity of shock veins lend support to formation by fractional crystallization from an impact melt with olivine composition during the shock pulse. On the other hand, the lamellar ringwoodite, oriented along notable crystallographic planes of olivine, suggests formation by solid-state transformation from olivine at the shock front.
The pseudotachylitic breccia from the Vredefort impact structure, one of the oldest and largest impact structures preserved on Earth, contains up to three silica polymorphs: quartz, stishovite, and coesite. In the investigated clasts in pseudotachylitic veins, quartz and coesite occur together, forming a fine-grained aggregate. The frequency of coesite occurrence, mostly limited to the center of the clasts, seems to be correlated with the position of the clast within the vein, with a maximum towards the center of the vein. Electron backscatter diffraction (EBSD) enabled the identification of the crystallographic relationship between coesite and quartz, allowing the discrimination of the most likely formation process for coesite between crystallization from the impact melt under high-pressure conditions during the shock pulse and solid-state transformation from a likely already strongly deformed quartz or from diaplectic glass.
This work remarks the potential of modern analytical techniques to help scientists reconstructing complex deformation mechanisms, constraining the local formation conditions. These data can be used for better modelling shock metamorphic processes, improving our understanding of the global implications of planetary collisions.
How to cite: Pittarello, L., Carone, L., De Santis, V., Gemmi, M., Parlanti, P., Steiger-Thisrfeld, A., Di Michele, A., Pratesi, G., and Giuli, G.: Coexisting polymorphs in shocked rocks investigated by EBSD and TEM, EPSC-DPS Joint Meeting 2025, Helsinki, Finland, 7–13 Sep 2025, EPSC-DPS2025-464, https://doi.org/10.5194/epsc-dps2025-464, 2025.
Abstract
Martian crust is enriched in iron, with olivine averaging an iron number of approximately 50. However, owing to the scarcity of terrestrial analogs with similar compositions, the shock behavior and preservation potential of Fe-rich olivine remain poorly understood. This study investigated the microstructural and spectral changes induced by shock effects in Fa50 Fe-rich olivine, providing new insights into its preservation, alteration mechanisms, and spectral evolution of Fe-rich olivine on the surfaces of Mars and Phobos.
Introduction
Iron is the second most abundant metal element in the solar system and plays a crucial role in planetary crustal evolution. Global remote sensing and in situ investigations indicate that Martian crust is enriched in iron, with olivine averaging an iron number (Fa#; Fe mola fraction of the Mg-Fe solid solution) of approximately 50. The silicates detected on Martian moons and some asteroids [1] potentially originated from Martian impact ejecta [2,3], suggesting that the primordial materials of Phobos and Deimos may contain iron-rich olivine given its abundance in the Martian crust [4]. However, due to the scarcity of terrestrial analogs with similar compositions, the shock behavior and preservation potential of Fe-rich olivine remain poorly understood, limiting our ability to assess how impacts modify its mineralogy and spectral properties on Mars and Phobos.
Methods
Shock recovery experiments were conducted on synthetic Fa50 olivine using one- and two-stage light gas guns at shock pressures of 18 GPa, 31 GPa, 41 GPa, and 47 GPa, corresponding to impact velocities between 0.89 and 1.95 km/s. Post-shock samples were analyzed using Raman, visible-near-infrared (VNIR), and mid-infrared (MIR) spectroscopy to assess spectral modifications. Microstructural and compositional features were characterized using scanning electron microscopy (SEM), focused ion beam (FIB) sectioning, and transmission electron microscopy (TEM).
Results
The shocked olivine samples exhibited systematic microstructural and spectral changes that varied with increasing shock pressure (Fig. 1). Shocked Fa50 olivine demonstrated shock-induced Fe migration and zoning at pressures ≥31 GPa, with the development of a three-layer Fe distribution pattern (core-intermediate-rim) accompanied by nanoscale α-phase (~120 nm) and γ-phase (20-50 nm) metallic iron particles. At shock pressures ≥41 GPa (corresponding to estimated transient temperatures ≥1185 K), minor magnetite particles (20–50 nm) were observed at olivine grain boundaries. Nanoscale vesicles, often associated with dislocations and grain boundaries, were also observed, indicating localized gas release. These phenomena indicate that magnetite can form not only through the direct decomposition of olivine but also via the oxidation of nanoscale metallic iron particles by oxygen vesicles generated during the impact process. Despite these extensive shock effects, no high-pressure olivine phases were detected, likely due to the short duration of the shock events.
There is a correlation between shock products and their spectral properties. Fa₅₀ olivine exhibited a reduced grain size, increased surface roughness, decreased crystallinity, and lower overall Fe content after impact. These structural changes resulted in 1) progressive peak shifts, increasing peak separation, and broadening of the full width at half maximum (FWHM) in the Raman spectra, indicating increasing structural disorder; 2) pressure-dependent trends, with increasing reflectance and spectral bluing at lower pressures (18 GPa), followed by reduced reflectance, redshifted absorption bands, and weakened absorption features at higher pressures (31-47 GPa) in the VNIR spectra. 3) Characteristic shifts in the Christiansen feature (CF) and Reststrahlen bands (RB1 and RB4) in the MIR spectra, particularly at pressures ≥31 GPa.
Conclusions
Our study suggests that impacts on Fe-rich silicates provide an alternative mechanism, independent of water-rock interactions, to influence the redox evolution of the Martian surface and the composition of its early atmosphere. Impact-induced nanoscale metallic iron, magnetite particles, and nanovesicles may directly contribute to the spectral reddening and localized bluing observed on the Martian moons Phobos and Deimos. However, longer cooling durations, more extensive Fe migration, and the formation of larger particles are more likely under natural conditions than under laboratory settings, highlighting the need for further experimental and observational studies focused on Martian moons.
Acknowledgements:This research was supported by the National Natural Science Foundation of China (Grant Nos. 42441803, 42373042, 42422201, and 42003054). Youjun Zhang is supported by the Sichuan Science and Technology Program (Grant No. 2023NSFSC1910).
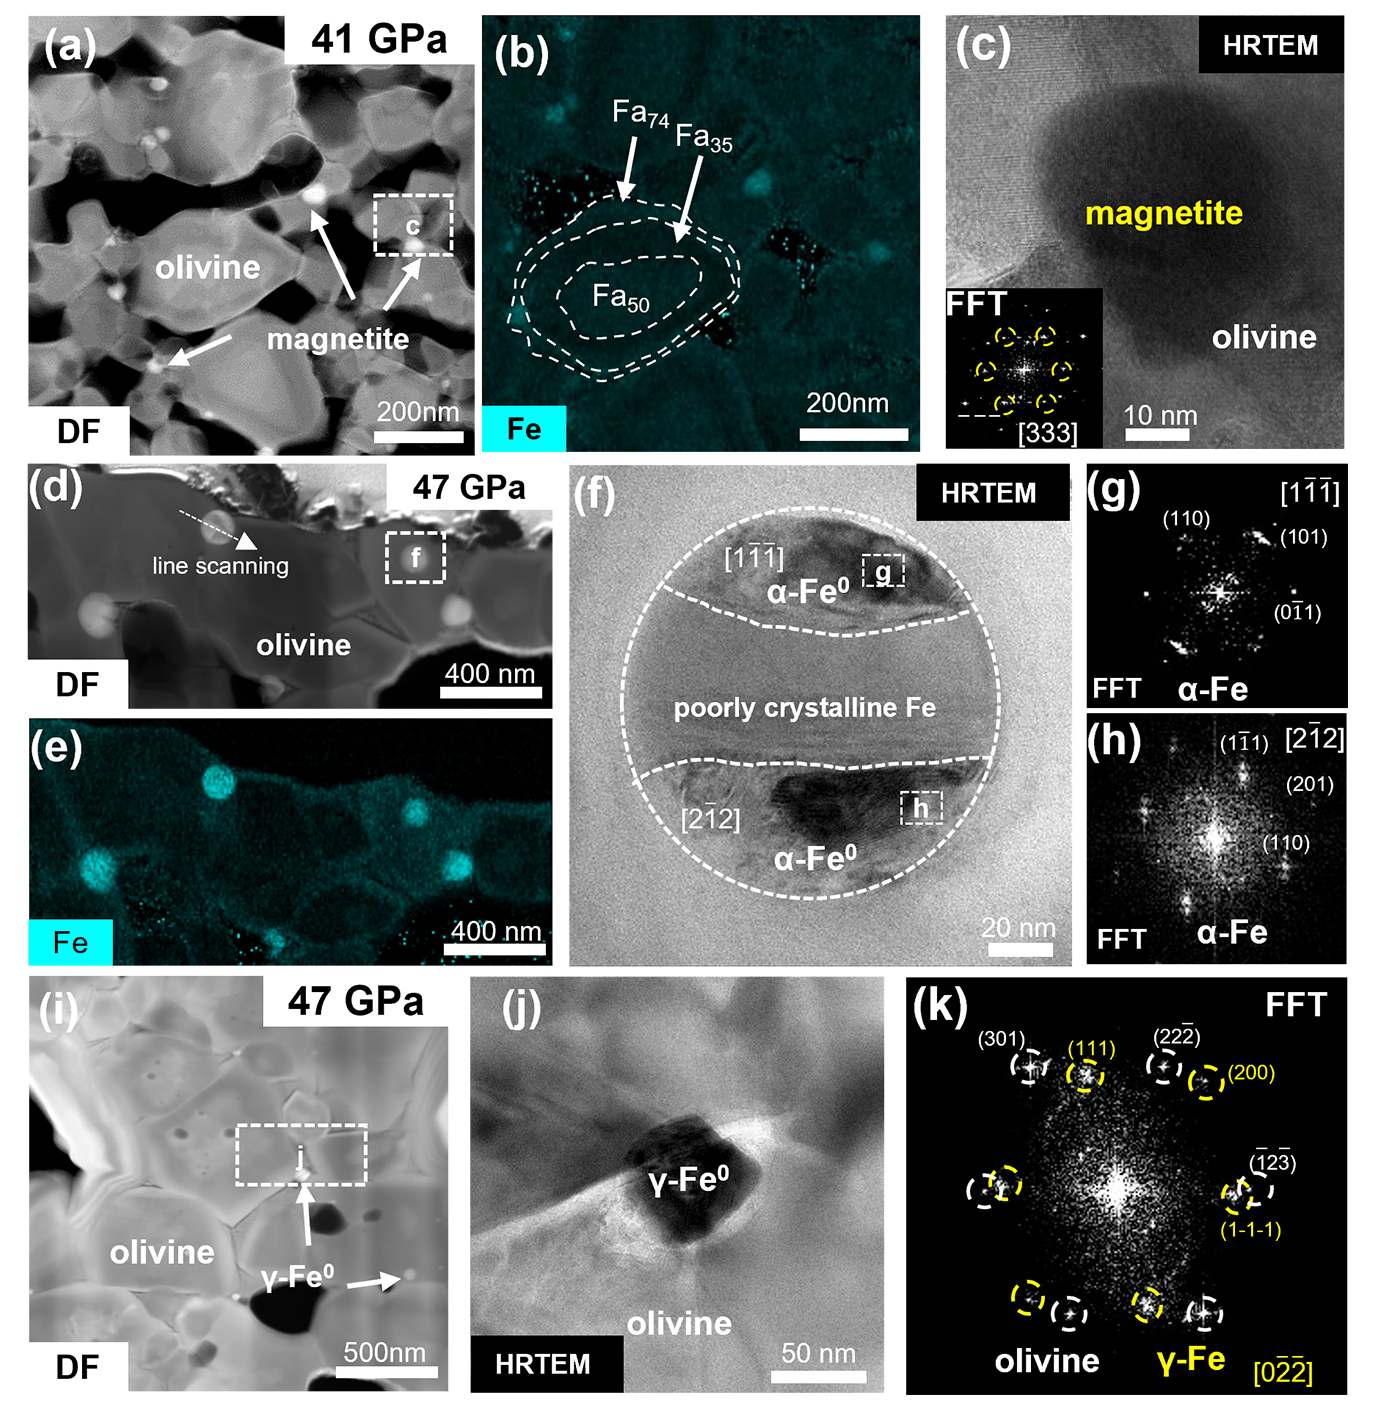
Figure 1: TEM images of metallic iron and magnetite particles. (a) and (b) Dark-field (DF) TEM image and iron elemental mapping of olivine shocked at 41 GPa. The Fe distribution within olivine exhibits a three-layer zoning pattern with average Fa# values of 50, 35, and 74 from the core to the rim. (c) High-resolution TEM (HRTEM) image of an iron-rich particle region in the sample shocked at 41 GPa. (d) DF image of olivine shocked at 47 GPa. (e) Fe elemental mapping of olivine shocked at 47 GPa, revealing that the nanoscale particles are iron rich. (f) HRTEM image of an iron particle with a diameter reaching 100 nm. The particles exhibit distinct contrast variations, divided into upper, middle, and lower regions, which are identified as α-Fe through fast Fourier transform (FFT) calibration. (g) and (h) FFT patterns of the upper and lower regions of the iron particle. (i) DF-TEM image of olivine shocked at 47 GPa. The nanoscale metallic iron particles are dispersed at the corners and edges of the grains and within the interior. (j) HRTEM image of an iron particle region in the sample shocked at 47 GPa. (k) FFT pattern of the iron particle shown in (c), confirming its identification as γ-phase metallic iron.
References
[1] Bibring, J., Ksanfomality, L., Langevin, I., et al., 1992, Adv. Space Res., 12(9): 13.
[2] Bagheri, A., Khan, A., Efroimsky, M., Kruglyakov, M., & Giardini, D., 2021, Nat. Astron., 5(6): 539.
[3] Canup, R., & Salmon, J., 2018, Sci. Adv., 4(4): eaar6887.
[4] Koeppen, W.C., & Hamilton, V.E., 2008, J. Geophy. Res.: Planets, 113(E5).
How to cite: Tai, K., Zhao, Y.-Y. S., Zhang, Y., Song, W., Yang, Y., Zhang, M., Qi, C., Du, W., Cao, F., Pang, R., Lin, H., Yin, Z., and Liu, Y.: Shock effects of Fa50 iron-rich olivine: Spectral and microstructural implications for Mars and Phobos, EPSC-DPS Joint Meeting 2025, Helsinki, Finland, 7–13 Sep 2025, EPSC-DPS2025-556, https://doi.org/10.5194/epsc-dps2025-556, 2025.
Impact cratering is one of the most important geological processes that has affected the evolution of the Moon’s crust. Impact cratering fractures the crust and generates porosity, which in turn affects physical properties such as the bulk density, thermal conductivity, and seismic velocity. As a result of NASA’s GRAIL mission, the lunar gravity field has been resolved to an unprecedented spatial resolution of up to 3 km in places, making it possible to estimate not only how the density of the upper crust varies laterally (e.g., Wieczorek et al. 2013, Wahl et al. 2020), but also how density varies with depth (e.g., Besserer et al. 2014, Gong et al. 2016, Šprlák et al. 2020). Estimating the 3D density structure of the crust is a non-unique problem, and in order to make this problem tractable, previous studies needed to impose the form of the density profile, which was assumed to be either constant, linear, exponential, or layered.
In the pioneering work of Besserer et al. (2014), a localized spectral admittance approach (Wieczorek & Simons, 2005; 2007) was used to derive the so-called effective density spectrum, and this was compared to predictions from models with a prescribed density profile. This study made use of an early gravity model GRGM900B that had a maximum spherical harmonic degree of 900 (Lemoine et al., 2014), which was the state of the art at the time. However, their analysis only made use of degrees up to 550, which was their estimate of the global resolution of the model. This study tested two simple parameterizations of the density profile, linear and exponential, but these are in all likelihood an over simplification of reality. Though this study provided many valuable insights, there are still many questions concerning how sensitive the Moon’s gravity is to depth variations in density.
Over the past decade, several advances have made a reanalysis of the Besserer et al. (2014) results pertinent. First, new gravity models have been constructed that utilize all data from the GRAIL extended mission phase, with the most recent being developed up to degree 1800 (GL1800F, Park et al., 2025). Šprlák et al. (2018) have shown that the degree 550 cutoff used by Besserer et al. (2014) is problematic, given that it was based on an estimate of the gravity field below the Brillouin sphere (the maximum radius of the planet). Furthermore, Besserer et al. (2014) used the same maximum spherical harmonic degree for all of their localized analyses, but the spatial resolution of the gravity model is known to be better at the poles where the spacecraft orbits overlap and in places where the spacecraft altitude was lower than average.
In this study, we improve upon previous work by applying localized spectral analyses combined with a Bayesian inversion method. In comparison to Besserer et al., we use a smaller spherical cap size of 9° with a smaller spectral bandwidth of 87. By using all localization windows with concentration factors greater than 0.99, we have 23 windows in comparison to 30 used by Besserer et al. We make use of the gravity model GL1800F, which has a resolution that is twice greater than the previously employed GRGM900B model. Furthermore, we better quantify the maximum permissible degree of our localized analyses by use of a degree-strength map and by use of the correlation between gravity and topography. Lastly, we use a multi-layer depth-dependent density model where the density and depth of each layer are sampled using a Markov Chain Monte Carlo (MCMC) method.
We focus our analysis on the lunar pole regions, where dense orbital coverage by the GRAIL mission provides particularly high-resolution gravity data. In particular, based on the correlation between gravity and topography, we estimate that the spatial resolution of these regions is close to spherical harmonic degree of 900, which is comparable to what is given by the degree strength map of GRGM1200 RM1. For the polar regions, we test density models that are constrained to increase with depth, as well as models that have no constraints. We also investigate models with different numbers of layers. From our numerical inversions, we expect to be able to determine the form of the density profile with depth in the crust, and also to determine the maximum depth that is sensitive to the GRAIL data.
Reference:
Besserer, J., Nimmo, F., Wieczorek, M. A., et al. (2014). GRAIL gravity constraints on the vertical and lateral density structure of the lunar crust. Geophysical Research Letters, 41(16), 5771–5777.
Gong, S., Wieczorek, M. A., Nimmo, F., et al. (2016). Thicknesses of mare basalts on the Moon from gravity and topography. Journal of Geophysical Research: Planets, 121(5), 854–870.
Lemoine, F. G., Goossens, S., Sabaka, T. J., et al. (2014). GRGM900C: A degree 900 lunar gravity model from GRAIL primary and extended mission data. Geophysical Research Letters, 41(10), 3382–3389.
Park, R. S., Berne, A., Konopliv, A. S., et al. (2025). Thermal asymmetry in the Moon's mantle inferred from monthly tidal response. Nature. (in press)
Šprlák, M., Han, S.-C., & Featherstone, W. E. (2018). Forward modelling of global gravity fields with 3D density structures and an application to the high-resolution (~ 2 km) gravity fields of the Moon. Journal of Geodesy, 92(8), 847–862.
Šprlák, M., Han, S.-C., & Featherstone, W. E. (2020). Crustal density and global gravitational field estimation of the Moon from GRAIL and LOLA satellite data. Planetary and Space Science, 192, 105032.
Wahl, D., Wieczorek, M. A., Wünnemann, K., et al. (2020). Crustal Porosity of Lunar Impact Basins. Journal of Geophysical Research: Planets, 125(4), e2019JE006335.
Wieczorek, M. A., & Simons, F. J. (2005). Localized spectral analysis on the sphere. Geophysical Journal International, 162(3), 655–675.
Wieczorek, M. A., & Simons, F. J. (2007). Minimum-variance multitaper spectral estimation on the sphere. Journal of Fourier Analysis and Applications, 13(6), 665–692.
Wieczorek, M. A., Neumann, G. A., Nimmo, F., et al. (2013). The Crust of the Moon as Seen by GRAIL. Science, 339(6120), 671–675.
How to cite: Yang, J. and Wieczorek, M.: Porosity beneath the lunar polar regions as revealed by GRAIL gravity data., EPSC-DPS Joint Meeting 2025, Helsinki, Finland, 7–13 Sep 2025, EPSC-DPS2025-781, https://doi.org/10.5194/epsc-dps2025-781, 2025.
Introduction:
The lunar south polar region has a complex evolutionary history encompassing multiple impacts as well as the trapping of water ice and other volatiles. The stratigraphic sequence of impact and basin ejecta, volcanic deposits, volatiles, and other more-local process such as mass wasting is poorly understood in many areas of the poles. Age dating of large craters [1,2] and areas of light plains [3] demonstrates the complex sequence of impact basin and crater overprinting. In particular, [3] demonstrate that the smooth “light plains” units across the south pole have clusters of ages indicating deposition associated with Schrödinger and Orientale basins, Shackleton crater, and some local events.
Radar data can be used to help understand the surface and subsurface structure of the regolith. S-band radar waves penetrate about a meter, and P-band radar can reach several meters depth in lunar materials. Prior radar observations of the lunar south polar region revealed relatively radar-bright areas with high circular polarization ratio values (CPR) [4,5]. CPR is the ratio of the same sense polarized wave that was transmitted over the opposite sense polarized wave and is often used as a measure of roughness. Areas mapped as light plains have high CPR values and were interpreted as fluidized ejecta from basin impacts [4]. Some young impact craters also have very high CPR values, which could possibly be due to excavated rocks from a basin ejecta melt layer under the surface [5].
In this work we focus on tens-of-kilometer diameter craters and areas of light plains. These regions have moderate to high CPR values in P-band radar data that imply a component of scattering from abundant rocks that could be in the surface or subsurface (Figure 1). Understanding the regolith layering and the surface rock abundance will help us better determine their origin and relative sequence, especially in the areas of light plains where age dating is challenging due to equilibrium conditions [3].
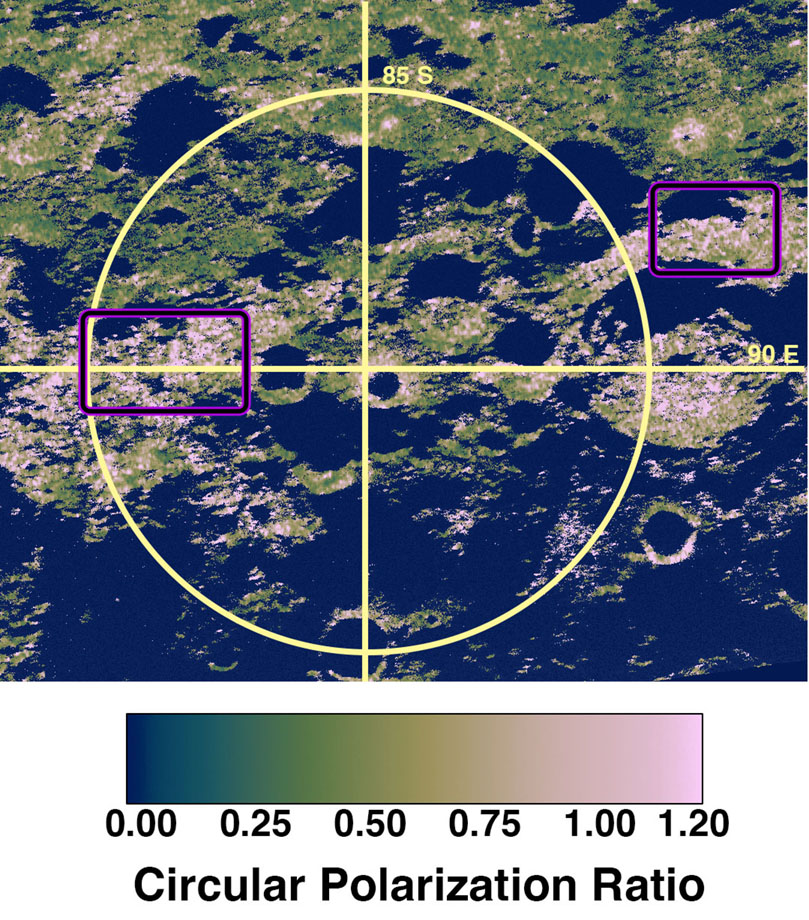
Figure 1: Arecibo Observatory P-band image of the lunar south pole. The image is colorized CPR overlaid on a total power image. The purple outlined boxes show the locations of the smooth plains investigated in this study.
Comparing optical images and radar datasets:
Korea Pathfinder Lunar Orbiter ShadowCam observations provide an opportunity to investigate the morphology and reflectance of areas that are permanently or intermittently in shadow [6] and to map features across both sunlit and shadowed areas. We use ShadowCam images with multiple lighting geometries to map surface rocks, surface textures, and evidence of mass wasting. In areas of smooth plains, the lighting geometry can be particularly difficult due to their complex topography and relatively low elevation. We use mosaics of some of these areas to better track features over larger areas.
Radar observations are available from the Lunar Reconnaissance Orbiter Mini-RF instrument (12.6 cm wavelength, S-band), and Arecibo Observatory (12.6 cm wavelength, S-band, and 70 cm wavelength, P-band) with different viewing geometries. The wavelength of the radar data affects the scattering behavior – longer wavelengths will penetrate deeper and are less sensitive to smaller cm-sized rocks. CPR images are available for all three datasets.
Results and Discussion:
The areas of mapped light plains with high CPR values have very different surfaces from similar high-CPR valued fresh impact craters. The fresh impact craters have extremely rugged ejecta blankets and interiors as shown in ShadowCam images. The slopes and interiors of Wapowski and Hale Q craters have landslides and extended areas of surface rocks (Figure 2). The rocks have sizes ranging from near the detection limit of the ShadowCam images (~2 m) to ~ 30 m in diameter. They are found on top of hummocky surfaces in the crater interior, exposed in crater walls, and exposed in patches or layers within larger hummocks. There are also extensive lineations on the floor hummocks, possibly from mass wasting and slumping of regolith. The rocks and surface textures create a very rough surface from the centimeter to decimeter scale, likely explaining the high CPR values measured at both S-band and P-band.
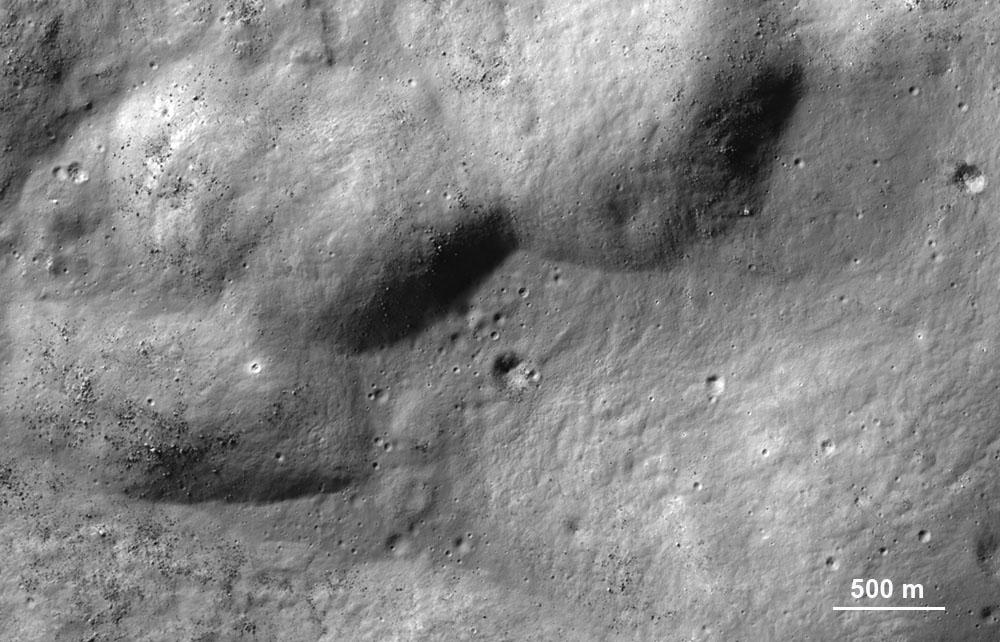
Figure 2: ShadowCam image of the interior of Hale Q crater showing abundant large surface rocks and lineated surface texture (especially lower left). Image M022457496S.
In contrast, light plains regions north of de Gerlache (-85.9°, 270° E) and northeast of Amundsen crater (-83.4°, 65.7° E) have many small (meters to tens-of meter diameter) impact craters but very few visible surface rocks. These relationships suggests that the high CPR values are produced by a buried rough surface, buried rocks, or surface rocks below the ShadowCam detection limit. The abundance of small impact craters in these light plains areas suggests that they are comprised of a rock layer or layers that are different from the nearby highlands. This layer could be the result of basin ejecta or ejecta deposits from nearby craters [3], which could have been deposited as a molten or partially molten deposit. Interestingly, some small craters south of Drygalski have ponded material in their floors (Figure 3), similar to melt ponds previously identified by [7]. Lunar impact melts have previously been found to have very high CPR values, probably due to the surface structure of the cooled melt [8,9]. Current work involves mapping changes in surface texture across the light plains regions, including mapping of possible impact melt deposits.
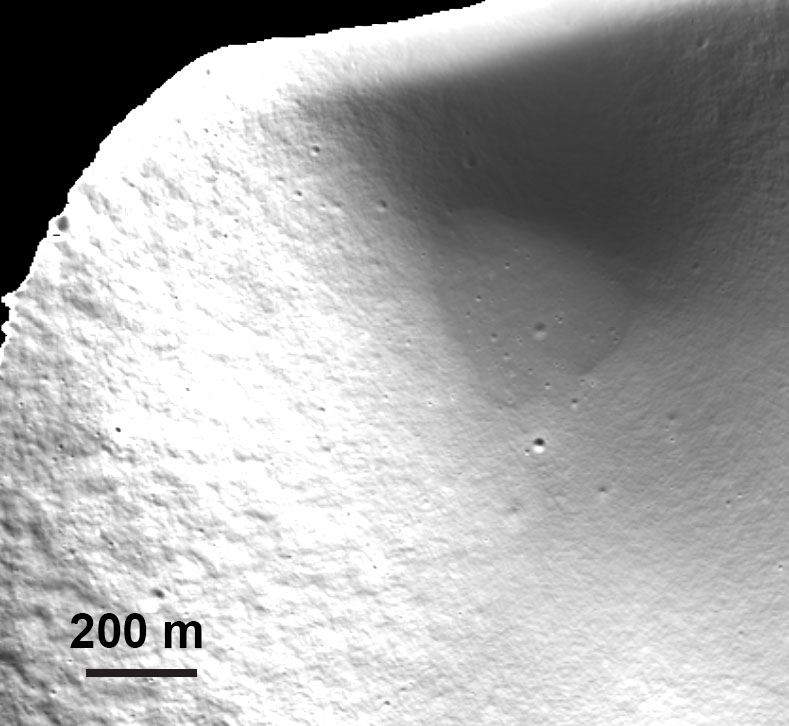
Figure 3: ShadowCam image showing a flat floor in a topographic depression that could be ponded impact melt. Image M047084443S.
References:
[1] Tye et al. (2015), Icarus, 255, 70-77, doi: 10.1016/j.icarus.2015.03.016.
[2] Deutsch et al. (2020), Icarus, 336, 113455, doi:10.1016/j.icarus.2019.113455
[3] Giuri, B. et al (2024). JGR, 129, e2024JE008605, doi: https://doi.org/10.1029/2024JE008605.
[4]Campbell B. A. and Campbell D. B. (2006), Icarus, 180, 1-7, doi: 10.1016/j.icarus.2005.08.018.
[5] Campbell B. A. et al. (2018), Icarus, 314, 294-298, doi: 10.1016/j.icarus.2018.05.025.
[6] Robinson M. S. et al. (2023), JASS, 40(4), 149-171, doi: 10.5140/JASS.2023.40.4.149.
[7] Robinson, M. S. et al. (2016), Icarus, 273, 121-134, doi: 10.1016/j.icarus.2015.06.028.
[8] Carter et al. (2012), JGR, 117, E00H09, doi:10.1029/2011JE003911.
[9] Neish, C. D. et al. (2021), Icarus, 361, 114392, doi: 10.1016/j.icarus.2021.114392.
How to cite: Carter, L., Grieser, S., Robinson, M., Mahanti, P., Denevi, B., and Kinczyk, M.: Mapping the surface and subsurface structure of rugged impact crater and basin ejecta near the lunar south pole, EPSC-DPS Joint Meeting 2025, Helsinki, Finland, 7–13 Sep 2025, EPSC-DPS2025-1197, https://doi.org/10.5194/epsc-dps2025-1197, 2025.
Introduction:
Numerical impact simulations and laboratory experiments often only focus on vertical impacts in homogeneously layered targets. Most impacts, however, occur at an oblique angle (< 90° to the horizontal), with the most likely angle being 45° [1]. Planetary surfaces either have active land-forming processes or are heavily cratered, both of which introduce further complexity to impact processes in the form of pre-existing topography and variations in sub-surface structure. Previous studies have shown that both impact angle [e.g., 2] and target heterogeneities [e.g., 3] play a significant role in crater formation, causing asymmetries in the final crater morphology, central uplift and ejecta distribution. We are conducting a systematic 3D numerical study to investigate the complex interplay of pre-existing topography, changes in crustal thickness, and impact angle and azimuth. To constrain the parameter space and demonstrate potential applications of this investigation, we present a case study on the Schrödinger basin impact event. The ~320 km lunar peak ring basin shows several asymmetries that have been attributed to both target heterogeneity [4, 5] and an oblique impact [6].
Methods:
We use the iSALE3D shock physics code [7, 8] to numerically model crater formation in a variety of heterogeneous targets and for a range of impact azimuths and angles.
For the Schrödinger basin, we assume a pre-impact terrain dominated by the influences of SPA with an eastward sloping topography and crustal thinning from 40 to 20 km. We choose target and impactor parameters based on successful 2D simulations [5]. Granite and dunite, which are the best available material analogues, were used to describe the crust and mantle. For computational expediency the impactor is represented by the same material model as the crust, implying an impactor density of 2650 kg/m3. We use a 25 km-diameter impactor and collisional speed is increased for oblique angles to preserve a vertical velocity component of 15 km/s. To produce a crater in the centre of the layered setup, the point of impact is offset by 40 and 50 km in the 45°- and 30°-degree scenarios, respectively. We use the “block model” for acoustic fluidization to facilitate late-stage collapse [9]. The Schrödinger simulations have a resolution of 1250 m (10 cells per projectile radius). We compare our results to LOLA topography [10] and GRAIL crustal thickness data [11].
Schrödinger Case Study - Results and Discussion:
Sloping Topography and Changes in Crustal Thickness.
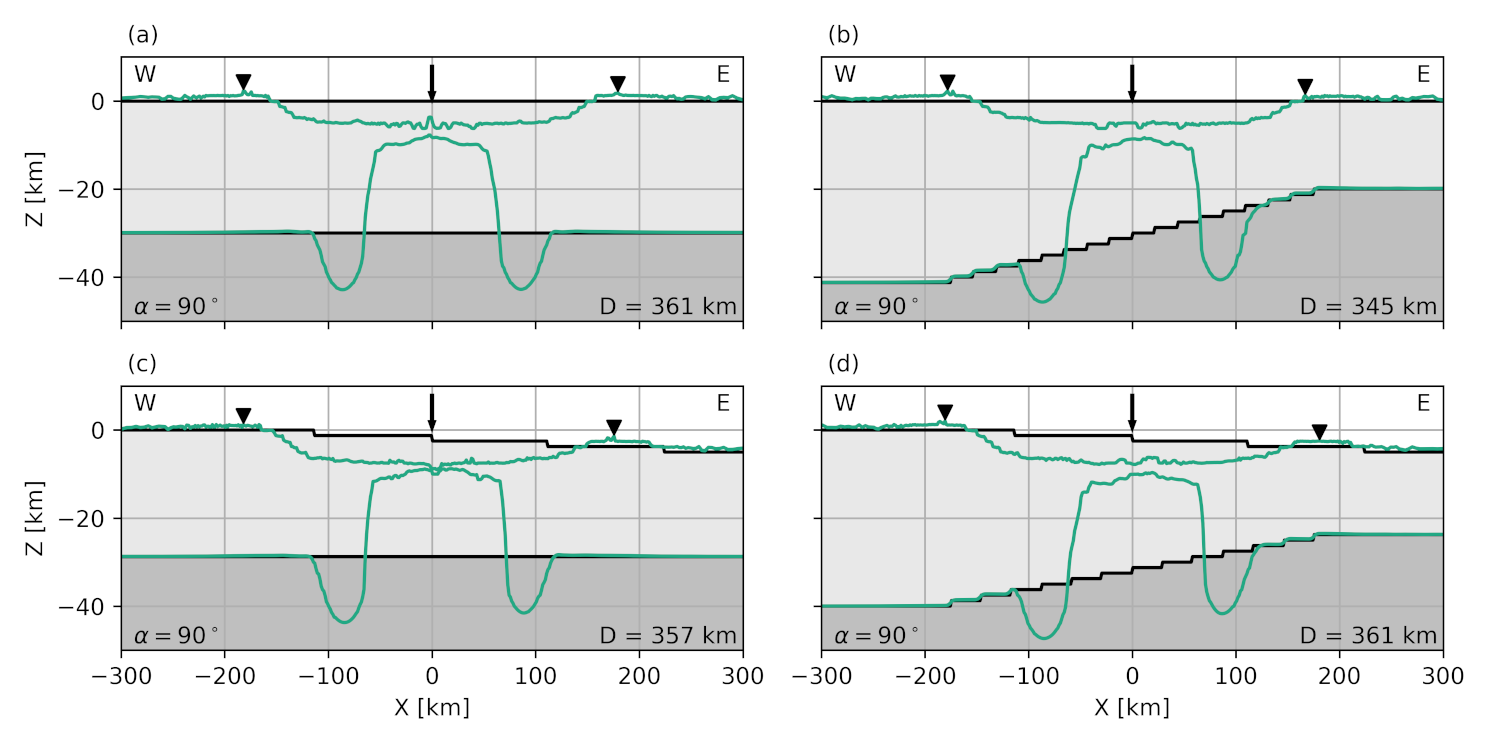
Figure 1. Vertical impact into (a) horizontal layers, (b) flat surface topography and thinning crust, (c) sloping surface topography and flat crust-mantle interface, and (d) sloping surface topography and thinning crust. Simulation results, overlying the pre-impact crust (light grey) and mantle (grey).
Sloping topography and changes in crustal thickness below the pre-impact surface cause asymmetry in the shape of the final crater and central uplift (Fig. 1). Simulations that include the eastward sloping topography produce higher and steeper crater walls in the west, consistent with observed LOLA topography. While absolute basin depths are greater for these simulations (~ 6km), relative depths (i.e. the difference between the post- and pre-impact surface) stay largely consistent across all simulations (4.25 to 4.5 km) and align with the observed average depth of the Schrödinger basin (4.5 km) [4]. Final basin diameter, which scales with the mass and velocity of the impactor [12], is independent of the pre-impact layer setup.
Impact Angle and Azimuth.
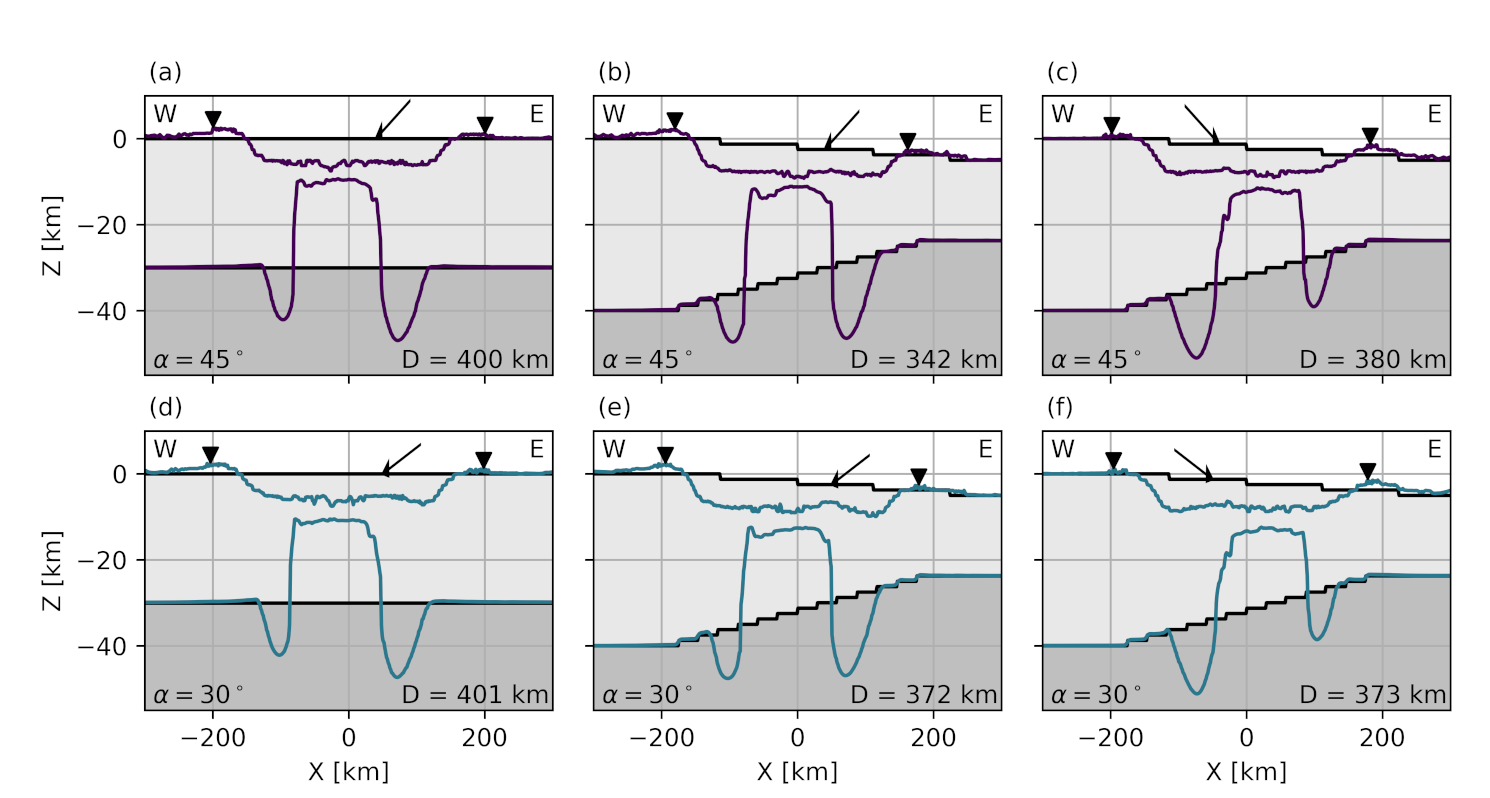
Figure 2. Oblique impacts (45° and 30°) into a homogeneously layered target (left), and into a heterogeneous target with an east to west (middle) and west to east (right) impact azimuth.
Oblique impacts in a flat, constant crustal thickness target produce asymmetry both in the final surface topography and in the central uplift with a wider and deeper annular bulge in the uprange direction (Fig. 2). In a heterogeneous target, there is an interplay between impact azimuth and target effects. The effect of crustal thinning seems to be offset by the effect of oblique impact in the east to west impact scenario, while the impact trajectory enhances asymmetries introduced by target heterogeneity in the west to east impact. Overall, final craters are larger than in a vertical impact, suggesting that the scaling of crater dimensions might be more complex than assumed.
Based on our results, the almost absent crater rim in the south and the higher and steeper crater walls in the west observed in LOLA topography, could support the scenario of an oblique impact from south-east to north-west [6]. A more comprehensive analysis of crustal thickness below the basin will provide more insights into the crater’s formation.
Conclusions:
The Schrödinger case study shows that even subtle variations in target heterogeneity and impact trajectory can produce asymmetries in final crater structure. Modelling impact craters of scientific interest in a more realistic context will lead to a better understanding of the pre- and post-impact distribution of materials and crater formation processes.
Our ongoing 3D numerical study will explore a wide range of impact scenarios to systematically investigate and disentangle the complex interplay of target heterogeneity and impact trajectory.
Acknowledgments: We gratefully acknowledge the developers of iSALE. We thank Caroline Chalumeau whose MSci project provided the inspiration for the work presented here.
References:
[1] Shoemaker, E. M. (1961). Phys. and Astron. of the Moon, 283–359. [2] Davison, T. M., & Collins, G. S. (2022). Geophys. Res. Letters, 49(21), e2022GL101117. [3] Aschauer, J., & Kenkmann, T. (2017). Icarus, 290, 89–95. [4] Kramer G. Y. et al. (2013) Icarus, 223(1), 131–148. [5] Kring D. A. et al. (2016) Nature Comm., 7(1), 13161. [6] Kring, D. A. et al. (2025) Nature Comm., 16(1), 1–7. [7] Elbeshausen D. et al. (2009) Icarus, 204(2), 716–731. [8] Elbeshausen D. and Wünnemann K. (2011) Proc. 11th Hypervel. Impact Symp., Vol. 4, 287-301. [9] Wünnemann K. and Ivanov B. A. (2003). Planet. Space Sci., 51, 831–845. [10] Smith D. et al. (2010). Geophys. Res. Letters, 37(18). [11] Wieczorek M. A. et al. (2013) Science, 339(6120), 671–675. [12] Holsapple, K. A. (1993). Rev. of Earth and Planet. Sci., Vol. 21, 333–373.
How to cite: Kallenborn, D. P., Collins, G. S., Davison, T. M., Kring, D. A., and Wieczorek, M. A.: Three-Dimensional Numerical Impact Simulations of Crater Formation in Heterogeneous Targets, EPSC-DPS Joint Meeting 2025, Helsinki, Finland, 7–13 Sep 2025, EPSC-DPS2025-1373, https://doi.org/10.5194/epsc-dps2025-1373, 2025.
Introduction
Crater morphology is widely used to constrain target properties [1]. New investigations reveal ejecta spatial distributions as yet another promising subsurface probe [2,3]. In contrast to natural impacts, hypervelocity impacts of mission hardware allow us to eliminate uncertainty on impact conditions (projectile type, velocity, impact angle) and use impact sites to put tighter constraints on target properties.
During Mars 2020 entry, the cruise stage was detached from the entry vehicle (EV) carrying the Perseverance rover. Soon after, the EV ejected two cruise ballast mass devices (CBMD), 77 kg each, made of tungsten and unlikely to have broken up during entry [4]. The cruise stage must have fragmented into at least 3 pieces of uncertain characteristics because in total 5 new co-located craters were identified (this abstract), leading to uncertainty on which craters resulted from CBMDs. Here, we a) identify CBMD craters, and b) use them to investigate target properties of the area roughly 70 km to the north-west from Jezero crater.
Methods
The Program to Optimize Simulated Trajectories II (POST2), which is the flight dynamics tool used by the Mars 2020 team, predicted the fate of various pieces of hardware, including CBMDs [5]. We use their pre-flight landing ellipses, and find coordinates of 5 craters after precisely georeferencing image data [see 6]. We obtain their locations as follows: we 1) use HRSC products orthorectified to MOLA (a base), 2) register CTX images to that base, 3) register a HiRISE image to CTX. A pre-impact HiRISE image exists only for CMBD-a, -c and -e (Fig. 1), hence we measure ejecta radii only for those craters, and build up on the procedure from [7]: 1) we georeference pre- and post-impact HiRISE images, 2) subtract them, 3) map the residual, 4) sample the edge of the polygon with equidistant points, 5) measure distances between these points and crater centers (Fig. 2). Impact sites are analyzed in QGIS. In order to estimate target properties, we use scaling relations from [8].
Preliminary results
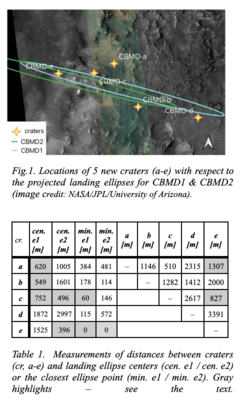
Location. Figure 1 displays the locations of 5 craters (marked as CBMDa-e). The outcome of the pre-flight simulations of trajectories for two cruise ballast mass devices, CBMD1 and CBMD2, are also shown as 99 percentile landing ellipses. In order to compare these two results, we calculated distances between a) all craters, b) craters and ellipse centers, c) shortest distances to the ellipses. These are reported in Table 1.
Crater CBMD-e falls within the landing ellipse of both CMBD2 and CMBD1 (but is closest to the center of CBMD2). The shortest distances to the center of the ellipse of CBMD1 are for craters CMBD-b, -a and -c, respectively, but only CBMD-c is located within 100 m from the landing ellipses. If we assume that CBMD-e is one of the craters formed by either of the ballast masses, we can use its distances to other craters as another constraint. For example, both CBMD-a and -c match the distance between the two centers of the ellipses (1141 m) to within the approximate width of each ellipse. Putting these arguments together (gray cell highlights in Table 1), we conclude that craters CBMD-c and CBMD-e are the most likely matches for the impacts of the original cruise ballast masses of Mars 2020.
Impact site characteristics. Table 2 reports the measurements of crater diameters. Craters CBMD-c and CBMD-e are nearly identical in diameter, which would be expected if two identical projectiles impacted the same target with identical velocities and impact angles. We also analyzed their ejecta radii and median absolute deviation as measures of asymmetries [7] (Table 2, Figure 2) to assess the impact sites similarity. However, ejecta patterns are not identical, possibly due to different topography.
Target properties. Preliminary calculations with pi scaling for sand or cohesive soil [8] place the strength parameter in the scaling relationship in the range 50-200 kPa, depending on the vertical component of the impact velocity, which is constrained to within a factor of two. More detailed results that follow from impact simulations are underway.
Preliminary conclusions
The fragmented cruise stage complicated the identification of craters excavated by ballast masses. We present several arguments that enabled us to distinguish CBMD craters from those made by cruise stage fragments. This advancement opens up a possibility to better constrain the local subsurface rheology. We will present a more detailed analysis of target properties at the meeting, including simulations with iSALE shock physics code [9] which explore complex target structures appropriate for the geologic settings shaped by fluvial processes.
References: [1] Prieur et al. (2018), 10.1029/2017JE005463 [2] Sokołowska et al. (2024), 10.1016/j.icarus.2024.116150 [3] Sokołowska et al. (2025), 10.1029/2024JE008561 [4] Nelessen et al. (2019), 10.1109/AERO.2019.8742167 [5] Way et al. (2021), 10.2514/6.2022-0421 [6] Kirk et al. (2021), 10.3390/rs13173511 [7] Gao & Sokołowska LPSC 2025, Abst.#2692 [8] Housen & Holsapple (2011) Icarus, 211, 1, 856-875. [9] Wünnemann et al. 2006. Icarus 180: 514–527.
Acknowledgements: This work is funded by a UKRI Horizon Europe Guarantee EP/Z003180/1. Special thanks to D. Way, B. Fernando and A. Chen for useful discussions.


How to cite: Sokolowska, A., Daubar, I., Collins, G., and Calef, F.: Solving the puzzle of too many craters from hardware impacts of Mars 2020, EPSC-DPS Joint Meeting 2025, Helsinki, Finland, 7–13 Sep 2025, EPSC-DPS2025-1780, https://doi.org/10.5194/epsc-dps2025-1780, 2025.
Titan's surface is covered by a thick atmosphere, much of which remains unexplored. Radar observations by the Cassini mission (2004‒2017) captured high-resolution images of approximately 69% of the surface, revealing a landscape rich in methane seas and rivers, with both dry and wet regions. Notably, Titan's surface has very few impact craters, which is the main geological feature used to estimate past impact fluxes or surface ages through crater
size-frequency distributions (CSFDs). This scarcity of craters is not only due to atmospheric shielding, which prevents many meteorites from reaching the surface, but also because Titan's surface, particularly the wet regions saturated with methane, is subject to intense erosion and
sediment deposition [1].
Wood et al. (2010) identified 49 possible impact craters across 22% of Titan's surface and reported that these features had been modified by various processes, including fluvial erosion, mass wasting, burial by dunes, and submergence in seas [2]. As a result, estimating surface
age from CSFDs is particularly challenging on Titan. Alternatively, Neish et al. (2013) and Rossignoli et al. (2022) proposed estimating surface age using impactor size-frequency distributions (SFDs) [3, 4]. Rossignoli et al. (2022) modelled the impactor SFD reaching Titan's surface under the assumption that most impactors originated from the Centaur population. Their analysis incorporated atmospheric shielding and used crater scaling laws
for icy targets to relate impactor size to crater size.
However, Titan's surface often retains liquid methane, which can alter key physical properties relevant to crater formation, such as friction, cohesion, and porosity. In this study, we conducted high-velocity impact experiments on wet sand targets with varying water contents to establish a crater size scaling relationship for wet surfaces, taking into account the effects of liquid content. Although Titan's wet surface would be composed of ice particles containing liquid methane, wet sand could serve as a suitable analogue, exhibiting similar physical characteristics during a cratering process. Using the impactor SFD proposed by Rossignoli et al. (2022), we estimated the original CSFD on Titan prior to erosion, enabling comparison with the currently observed CSFD to assess erosional effects on crater retention. Additionally, we performed numerical simulations to reconstruct the original morphology of Titan's craters before erosion and compared these with crater profiles observed by Cassini's Synthetic Aperture Radar to evaluate the degree of erosional modification.
Impact experiments: We conducted high-velocity impact experiments on wet sand targets using two-stage horizontal and vertical light gas guns at Kobe University and ISAS (JAXA). We used spherical aluminum or polycarbonate projectiles with the diameters of 2.0 mm or 4.7 mm. The impact velocities were 2-6 km/s. For the horizontal gas gun, the targets were tilted at 30°from the horizontal plane to simulate oblique impacts, while for the vertical gas gun,
targets were placed horizontally to simulate vertical impacts. The targets consisted of a homogeneous mixture of quartz sand (average grain size: 500 μm)
and water in varying proportions. For impacts with 2.0 mm projectiles, the mixture was placed in acrylic containers measuring 150 mm × 150 mm × 50 mm; for 4.7 mm projectiles, containers measured 200 mm × 200 mm × 100 mm. The water content was varied from 0 to
13 wt.%, which reduced the target porosity from 47% to 21% as water filled the pore spaces.
All experiments were recorded using two high-speed cameras. After impact, the final crater profiles were measured using either a 3D scanner or a 2D laser displacement indicator (Fig.1). These profiles were then used to calibrate our numerical model.
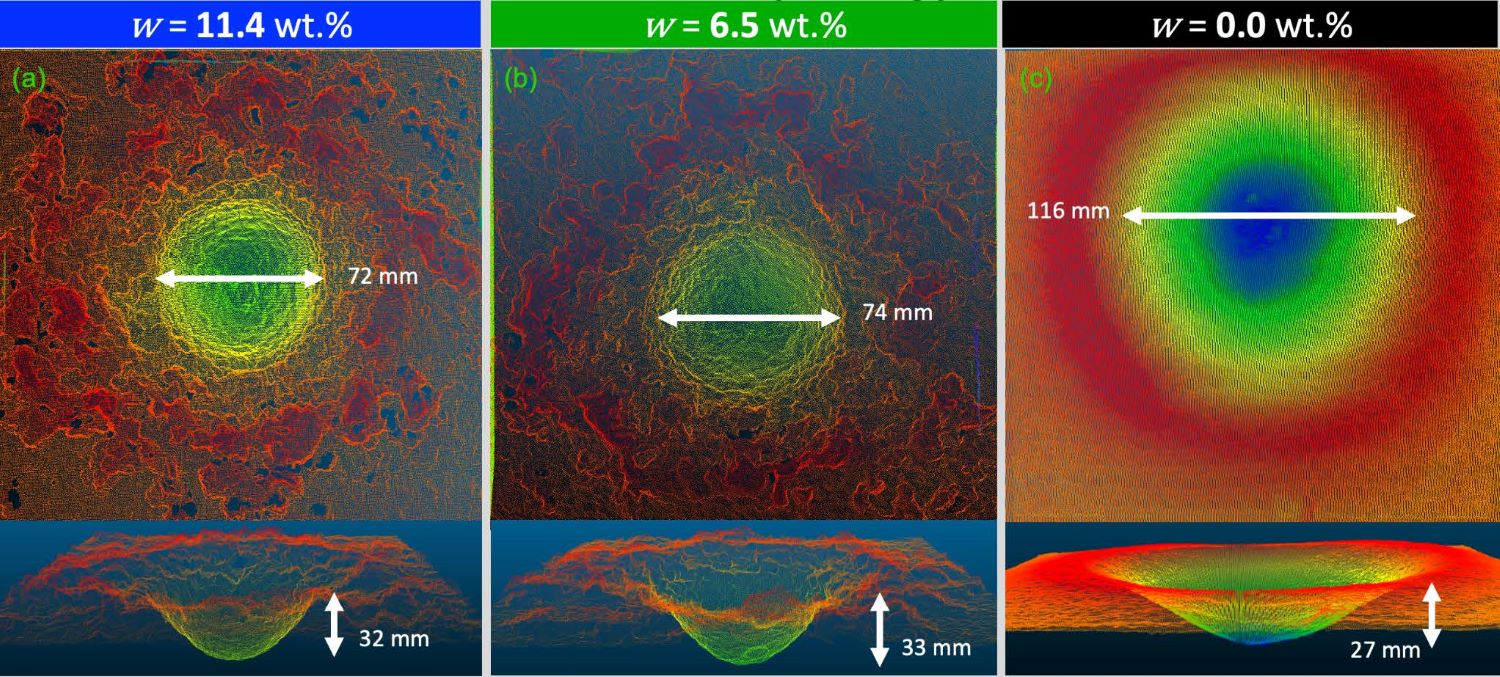
Fig. 1: 3D crater profiles from experiments on wet sand with varying water contents (wt%) showing distinct crater morphologies.
Numerical models: We use Bern's parallel Smooth Particle Hydrodynamics (Bern SPH) impact code [5, 6] to reproduce and extend our experimental results. This SPH code has been previously validated against laboratory experiments, including quartz sand targets [e.g., 7, 8].
Results and Discussion: The craters formed in our experiments were influenced by changes in target water content, affecting not only cohesion but also the coefficient of friction. We established a crater size scaling relationship for wet sand by accounting for these water content effects, using the π-scaling framework developed by Housen and Holsapple (1993):![]()
Where ![]() with crater radius R, target density ρ , projectile mass m, gravitational acceleration g, projectile radius a, impact velocity U, impact angle θ, and water content wc. For a detailed derivation of our scaling relationship,
with crater radius R, target density ρ , projectile mass m, gravitational acceleration g, projectile radius a, impact velocity U, impact angle θ, and water content wc. For a detailed derivation of our scaling relationship,
see Toyoshima et al. (2024) [9].
We used the impactor SFD from Rossignoli et al. (2022), which follows a broken power-law model for Centaur objects, to calculate the expected original CSFD on Titan (Eq. 2; C0=3.5 ×105×100(s2-1), s1=4.7, s2=3.5). They also included the atmospheric effects such as deceleration and ablation of impactors, and concluded that CSFD would become constant at crater size < 25 km. Figure 2 shows that the CSFDs for our scaling relationship is less than that for Rossignoli et al. (2022), and also it differs by approximately an order of magnitude between wet and dry targets. This suggests that the CSFD would indicate a younger surface age than previously estimated if we use our scaling relationship, and the estimated age would vary with surface liquid content. Further analysis is needed to refine the application of the impactor SFD. In our presentation, we will discuss the estimated surface age of Titan, crater retention ages, and the erosional effects on crater morphology. Eq.(2)
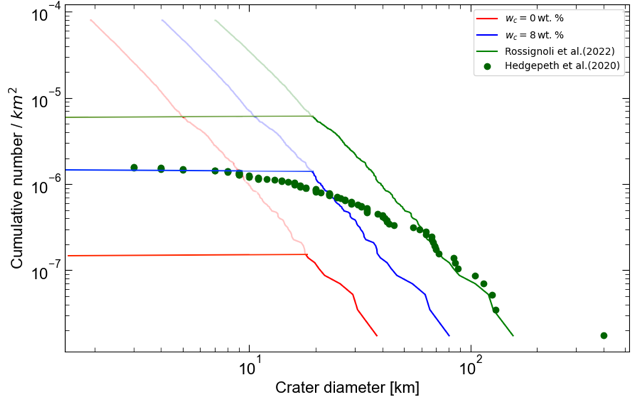
Fig. 2: Crater size-frequency distributions (CSFDs) on Titan for an icy target (from Rossignoli et al. (2022)) and for targets with varying water content (wt%) (this study). These CSFDs were calculated using the impactor size-frequency distribution from Rossignoli et al. (2022). Green markers indicate the observed CSFD from Hedgepeth et al. (2020) [10].
Citation:
[1]Cornet et al. (2015). J. Geophys. Res. Planets, 120(6), 1044‒1074.
[2] Wood, C.A., et al. (2010). Icarus, 206, 334‒344.
[3] Neish, C.D., et al. (2013). Icarus, 223(1), 82‒90.
[4] Rossignoli, N.L., et al. (2022). A&A, 660, A127.
[5] Jutzi, M., et al. (2008). Icarus, 198, 242‒255.
[6] Jutzi, M. (2015). PSS, 107, 3‒9.
[7] Ormö, J., et al. (2022). EPSL, 594, 117713.
[8] Raducan, S.D., et al. (2021). LPSC, #1908.
[9] Toyoshima, H., et al. (2024). JGR-Planets, submitted.
[10] Hedgepeth, J.E., et al. (2020). Icarus, 344, 113664.
How to cite: Toyoshima, H., Raducan, S., Arakawa, M., Hasegawa, S., and Jutzi, M.: Impact cratering on wet surface : Implications to the erosional degree on impact craters on Titan , EPSC-DPS Joint Meeting 2025, Helsinki, Finland, 7–13 Sep 2025, EPSC-DPS2025-285, https://doi.org/10.5194/epsc-dps2025-285, 2025.
Please decide on your access
Please use the buttons below to download the supplementary material or to visit the external website where the presentation is linked. Regarding the external link, please note that Copernicus Meetings cannot accept any liability for the content and the website you will visit.
Forward to presentation link
You are going to open an external link to the presentation as indicated by the authors. Copernicus Meetings cannot accept any liability for the content and the website you will visit.
We are sorry, but presentations are only available for users who registered for the conference. Thank you.
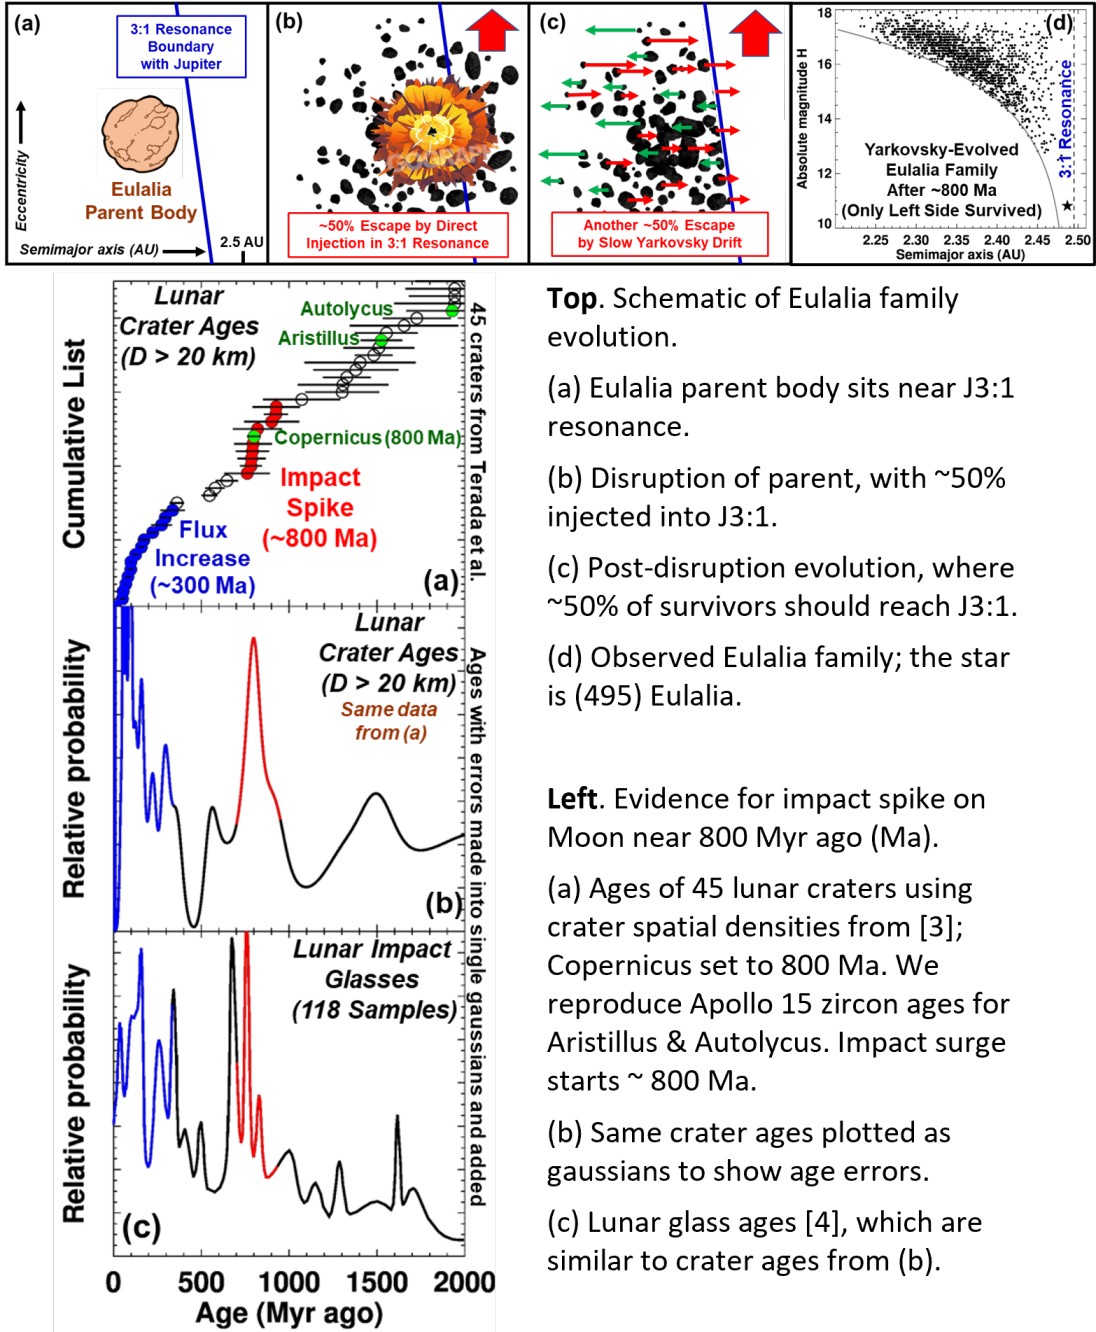
Many assume that inner solar system impact rates have been constant for the last ~3 Gyr (e.g., [1]). The evidence for a constant flux, however, is based on the spatial densities of small craters (Dcrater < 1-2 km diameter) superposed on dated lunar terrains [2]. While these data constrain the flux of small asteroids (D < 0.1 km), they are less predictive of the large impactor flux, which may be driven by surges. For example, [3] measured the spatial densities of Dcrater < 0.1-0.2 km craters on the ejecta blankets of 59 fresh lunar craters with Dcrater > 20 km; 45 are shown in the Left Fig. By setting Copernicus crater (Dcrater = 93 km) to be 800 Myr old (Ma), based on Apollo 12 data [2], crater spatial densities can be turned into ages (Left Fig). Their results suggest a prominent lunar shower occurred ~800 Ma. Similar trends are found in the 40Ar/39Ar age profiles of 118 lunar impact glasses [4] (Left Fig). The match between crater and impact glass ages provides support for the work of [5], the first to argue for a lunar impact spike ~800 Ma. They also indicate lunar impact glass ages are less biased than previously thought (e.g., [6]).
Using collisional/dynamical models [e.g., 7], we can now reproduce this impactor surge from the formation of the Eulalia asteroid family, whose D > 100 km parent body disrupted on the brink of the 3:1 mean motion resonance with Jupiter (J3:1) ~ 800 Ma (Top Fig). This rare occurrence allowed roughly half the family to be injected into the J3:1, with additional members migrating in later by Yarkovsky drift. Ultimately, approximately three-fourths of this family reached the J3:1 over a roughly ~100 Myr interval, enough to explain the size and number of large lunar craters with ages near 800 Ma.
Note that for every impact on the Moon, ~twenty same-sized or larger impacts strike Earth. We find this bombardment intriguing because several sudden transitions in our biosphere occur near 800 Ma. Some examples include: (i) the return of anoxic conditions to the deep ocean for the first time since ~1.8 Ga [8], (ii) an abrupt decrease in carbon isotopes (δ13C) in Australia’s Bitter Springs formation (e.g., [9]), and (iii) major changes in the abundance, diversity, and environmental distribution of marine eukaryotes [10]. We speculate that major terrestrial impacts near this time from Eulalia projectiles might have stimulated such activity. If true, it can be argued that the Eulalia family forming event strongly influenced the evolution of life on Earth. We also point out that Martian caldera ages, dated using superposed craters, show hints of clustering near 800 Ma. If so, Eulalia impacts may also be responsible for a short-term increase in Martian volcanism near that time.
[1] Neukum, G. et al. 2001. Space Sci. Rev. 96, 55. [2] Stöffler, D., Ryder, G. 2001. Space Sci. Rev. 96, 9. [3] Terada, K. et al. 2020. Nature Comm. 11, 3453. [4] Ghent, R. R., & N. E. B. Zellner. 2020. White Paper for the Planetary Decadal Survey. [5] Zellner, N. E. B., et al. 2009. GCA 73, 4590. [6] Huang, Y.-H. et al. 2018, GRL 45, 6805; [7] Bottke, W. F. 2015. Icarus 247, 191-271. [8] Canfield, D. E. et al. 2008. Science 321, 949. [9] Wörndle et al. 2019. Chem. Geo 524, 119. [10] Knoll A. H. 2014. Cold Spring Harb Perspect Biol 6, a016121.
How to cite: Bottke, W., Vokrouhlický, D., and Dykhuis, M.: An Impact Shower on the Earth, Moon, and Mars from 800 Million Years Ago, EPSC-DPS Joint Meeting 2025, Helsinki, Finland, 7–13 Sep 2025, EPSC-DPS2025-428, https://doi.org/10.5194/epsc-dps2025-428, 2025.
Impact fragment size distribution is a vital factor in understanding impact processes and evaluate impact consequences. Thousands of meteoroids enter the Earth's atmosphere, but most of them burn up due to frictional heat, yet a small fraction survive to reach the ground as meteorites. The Bjurböle meteorite presents a valuable research opportunity as one of the few meteorites that remained significantly fragmented after impact. This approximately 400 kg L/LL ordinary chondrite meteorite's impact on sea ice resulted in catastrophic disruption, producing numerous centimeter to decimeter-sized fragments. This size range is underrepresented in both impact experiments and asteroid boulder studies and is often subject to observational bias in asteroid boulder studies. Consequently, the fate of centimeter to decimeter-sized particles from impact disruption remains poorly understood, while comprehensive 3D analyses of asteroid boulder morphology, examining both shape and size distribution concurrently, remain limited. To address this deficiency, we examined digital shape models of Bjurböle fragments weighing between 0.01 and 1 kg. The resulting 3D models were subsequently analysed for shape characteristics and morphology using a MATLAB-based analytical pipeline. Detailed 3D morphological parameters were studied, including bounding box dimensions (a, b, c), aspect ratios (b/a, c/a, c/b), equivalent diameter, circle ratio sphericity, degree of true sphericity, and solidity. Additionally, we compared 2D and 3D morphological analyses on the same fragment models to understand analytical variations between the approaches. Notably, the 3D analysis revealed more pronounced irregularities compared to 2D analysis because it comprehensively accounts for all surfaces in morphological determination, providing a more complete and comprehensive representation of the fragments' true geometric complexity. Results indicated mean fragment aspect ratios (b/a: 0.85 ± 0.09; c/a: 0.67 ± 0.13) indicating relatively equidimensional shapes, especially in the a-b plane. 3D morphological parameters such as degree of true sphericity (equivalent to circularity in 2D), as a large-scale roughness indicator, was determined to be 0.83 ± 0.04. Similarly, solidity, an indicator of small-scale roughness, was determined to be 0.88 ± 0.02, suggesting that Bjurböle meteorite fragments are generally exhibit convex shapes with noticeable concavities. Smaller fragments displayed reduced roughness with fewer concavities, while bigger fragments exhibited increased surface roughness with more prominent convex hulls, characteristics potentially attributable to fusion crust and erosion processes.
References: Kohout et al. (2024) DOI https://doi.org/10.3847/PSJ/ad4266

Fig. 1. Histograms of dimension ratios b/a, c/a, and c/b of studied fragments from the Bjurböle meteorite, comparing size fractions below 450g (right) and between 450g and 1kg (left).
Fig. 2. Histograms with Kernal density estimation of a) circle ratio sphericity, b) degree of true sphericity, c) solidity and d) aspect ratio obtained using 3D morphological analysis for Bjurböle meteorite fragments weighing below 1 kg. Blue: Above 450 g size fraction, orange: below 450 g size fraction, dash lines: Kernal density estimations.
How to cite: Kohout, T., Seemantha Arachchi, R., Luttinen, A., and Duchene, A.: 3D shape and size distribution of Bjurböle chondritic meteorite fragments from a catastrophic impact event, EPSC-DPS Joint Meeting 2025, Helsinki, Finland, 7–13 Sep 2025, EPSC-DPS2025-1744, https://doi.org/10.5194/epsc-dps2025-1744, 2025.
The "rubble-pile" structure of several asteroids recently examined by space missions—such as Dimorphos, Itokawa, Bennu, and Ryugu—has drawn significant attention to these types of celestial bodies. However, their internal composition remains largely uncertain, but a strength-stratification with a weaker exterior compared with the interior has been suggested for at least some of them (e.g., Daly et al. 2022). To explore a possible explanation for this strength stratification in rubble-pile asteroids, an impact experiment was conducted at the Experimental Projectile Impact Chamber (EPIC) at Centro de Astrobiología (CAB), CSIC-INTA, Spain (cf. Ormö et al., 2015). The target was prepared in a 60 ‐cm wide, half‐spherical metal bowl that had been cut in half and mounted to the camera chamber window for quarter space setup. The bowl was filled with porous, ceramic balls of nearly equal diameter and density as the projectile, which were of the polymer Delrin (20mm diameter, 5.7g) impacting vertically at ̴0.4km/s. High-speed video recordings showed that crushed target and projectile material rapidly penetrates deep into the substrate, dispersing radially beneath the crater floor (Fig. 1). If such impacts occur repeatedly over time in a porous and easily crushable material, this process could lead to the accumulation of fine-grained, compacted, and increasingly cohesive material at deeper layers. Meanwhile, impact-induced seismic activity on the asteroid, causing granular convection (the "Brazil Nut Effect"), along with rotational centrifugal forces, could promote the segregation of finer material beneath coarser layers—potentially making this effect more pronounced at the poles.
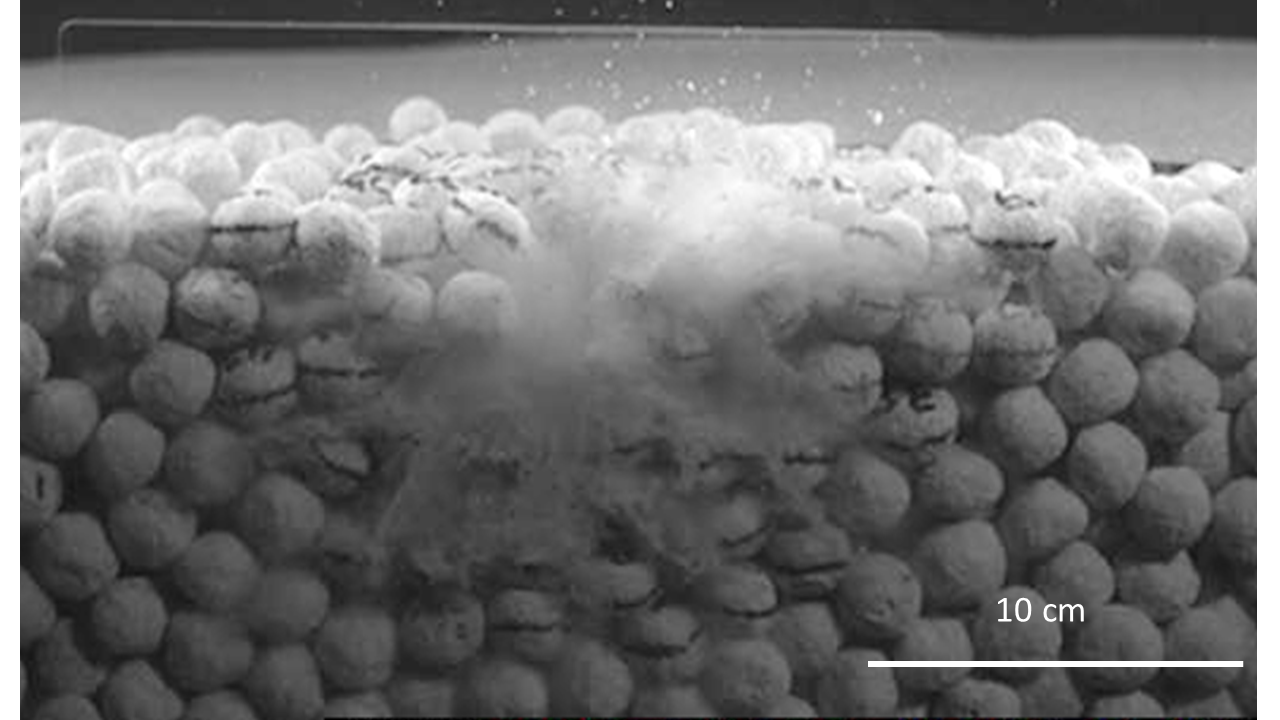
Fig. 1. Radial clastic injections of crushed impactor and target material shortly after impact into a "boulder" target. Also note the poor development of an excavated cavity in this porous target.
References
Daly, T. R., et al. (2022), Icarus 384, https://doi.org/10.1016/j.icarus.2022.115058
Ormö, J. et al., (2015), Meteorit. Planet. Sci. 50(12), https://doi.org/10.1111/maps.12560
Acknowledgements
The study was supported by grant PID2021-125883NB-C22 by the Spanish Ministry of Science and Innovation/State Agency of Research MCIN/AEI/ 10.13039/501100011033 and by ‘ERDF A way of making Europe’, and Spanish National Research Council CSIC (Project ILINK22061). SDR, MJ, RL and KW have received funding from the EU’s H2020, grant agreement No. 870377 (NEO-MAPP). SDR. and MJ acknowledge support from the Swiss National Science Foundation (project number 200021_207359).
How to cite: Ormö, J., Herreros, I., Luther, R., Wünnemann, K., Raducan, S., and Jutzi, M.: Impact-Generated Clastic Injections as a Cause for Stratification in Rubble-Pile Asteroids, EPSC-DPS Joint Meeting 2025, Helsinki, Finland, 7–13 Sep 2025, EPSC-DPS2025-348, https://doi.org/10.5194/epsc-dps2025-348, 2025.
Metal asteroids are a topic of increasing interest within both the public and private space sectors, as the in-situ resource utilization (ISRU) and asteroid mining communities continue to develop and expand. The metal asteroid 16 Psyche is the largest known M-class asteroid in the main asteroid belt and thus can be considered a prime target for further investigation, with upcoming activities including the NASA Psyche mission which is due to arrive in 2029.
Despite this heightened level of interest, many fundamental unknowns remain about 16 Psyche. The limited existing data from ground-based telescopes has resulted in an estimated composition of 30-60% metal (predominantly iron and nickel) and the remaining material as silicate rock. However, both the physical properties —including detailed composition, grain size, material compaction— and behaviours —for instance, response to micrometeorite impacts and ion irradiation— of the surface material remain unknown.
This research, conducted at ESA’s Vulcan Analogue Sample Facility, aims to better understand the impact processes on 16 Psyche and their influence on the presence (or lack thereof) of a surface regolith. Hyper velocity impact experiments will be conducted using the two-stage gas gun at the University of Kent. Small copper projectiles (~2mm) will be fired at a metal meteorite to determine if the large metal crystals present will shatter and be comminuted —thus contributing to a metal rich surface regolith—, or if they will instead melt and remain coherent —therefore not significantly contributing to a surface regolith.
In doing so, we aim to predict the composition and physical structure of 16 Psyche’s surface material. Drawing on previous hypervelocity experiments, we hypothesize that upon impact the crystals will shatter and produce a loose regolith-like material. If this is the case, there are likely to be positive implications for future asteroid mining activities due to the ease of metal extraction from regolith compared to impact-melt crusts.
An estimation of this surface material will enable further, more complex surface research of 16 Psyche, and most importantly for the Vulcan Facility, underpin the development and production of surface simulants of the asteroid. It may also contribute to derisking any future landers, as well as improving the understanding of its utilization potential for resource extraction on Psyche and other metal asteroids. Beyond this, we hope our research can help inform a deeper understanding of the processes of formation and weathering of metal asteroids.
How to cite: Vosper, D., Martin, M., Wozniakiewicz, P., and Manick, K.: Experimental investigations of impact processes on the metal asteroid 16 Psyche, EPSC-DPS Joint Meeting 2025, Helsinki, Finland, 7–13 Sep 2025, EPSC-DPS2025-1917, https://doi.org/10.5194/epsc-dps2025-1917, 2025.
Introduction
Impacts drive regolith formation and modification on asteroids (Shoemaker et al., 1969) through bedrock excavation, fragmentation, and the deposition of ejected material back onto the surface (Melosh, 2011). Over time, impacts gradually increase the regolith depth. Eventually, the regolith becomes sufficiently thick that only large impactors produce craters that penetrate into the underlying bedrock, generating new regolith. This enables the depth of the regolith layer to serve as an indicator of a surface's exposure age to the impactor flux, if one understands the cratering process on these bodies (Richardson et al. 2020).
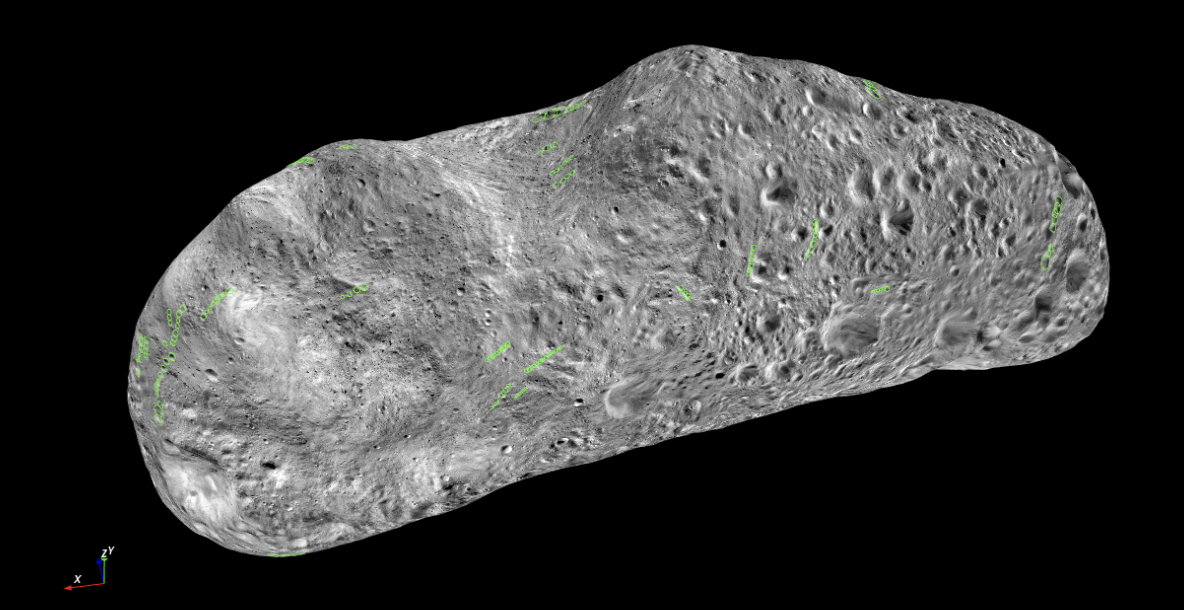
The regolith depth can be directly measured from subsidence pits on asteroids, which form when a fault or fracture opens up beneath the regolith layer, allowing loose regolith to subside and flow into the fracture (Horstman and Melosh, 1989). The shape and size of the resulting subsidence pit at the surface are determined by a cone extending upward from the fissure at an angle determined by cohesion and the angle of internal friction; as material drains into the fissure, it forms the shape of this cone (Melosh, 2011). Thus, simple trigonometry enables the thickness of the regolith to be determined from the dimensions of subsidence pits. Using this approach, Horstman and Melosh (1989) found that the regolith of Phobos is 290-300 m thick, and Richardson et al. (2020) determined that the regolith of Šteins is 145±35 m thick.
Using an accurate model of the asteroid cratering flux over time, the cratering process itself, and knowledge of how seismic waves propagate and degrade cratered terrain, one can use numerical simulations to calculate how long it takes for such a regolith depth to develop. Richardson et al. (2020) applied this technique to asteroid 2867 Šteins, finding that, although its cratering record suggests a minimum Main Belt Exposure Age (MBEA) of 175±25 Myr, the regolith depth requires a much longer MBEA of 475±25 Myr. They also found that the cratering record of 433 Eros suggests an MBEA of 225±75 Myr.
The surface of 433 Eros also has subsidence pits, enabling a proper estimate of the regolith depth across Eros and its corresponding minimum MBEA. In this work, we apply this technique to measure Eros’ subsidence pits to map the regolith thickness, calculate its minimum MBEA based on regolith depth, and then compare this with the cratering MBEA.
Methods and Results
Using the Small Body Mapping Tool (SBMT), we selected images from the NEAR Mapping Spectrometer Instrument (MSI) to identify, map, and measure pit chains on Eros using a variety of search parameters (spatial resolution, wavelength filter, limb inclusion, incidence angle, emission and phase angle). Among the seven filters of MSI spanning the VIS-NIR range (450-1050 nm), filter 4 contained over 80% of the images, which were the focus of this study. The following parameters were found to be ideal: resolution ≤ 5 m/pixel, both with and without limb, an incidence range of 10˚-70˚, an emission range of 10˚-70˚, and a phase range of 20˚-140˚.
Using select MSI images over the entire body, individual pits were mapped with circles, and their diameter and location were recorded. We then refined the number of pits using a larger number of images, and as a final check, performed a second refinement using a global basemap that is included in SBMT. We identified a total of 330 pits as well as 60 distinct chains.
|
Fig. 1. 433 Eros displayed in SBMT software with measured pit chains denoted by green circles. |
To produce a map of the regolith depth across Eros, we assumed that the depth varied smoothly and linearly between measurement points, such that the depth of the regolith at a particular facet is computed by the average of each measured pit crater, weighted by the square of the distance between facet and pit. We assumed an angle of internal friction of 35 degrees and zero cohesion, and used the Gaskell (2008) shape model to map the regolith depth (Figure 2). We find that Eros has an average regolith depth of ~48m.
|
|
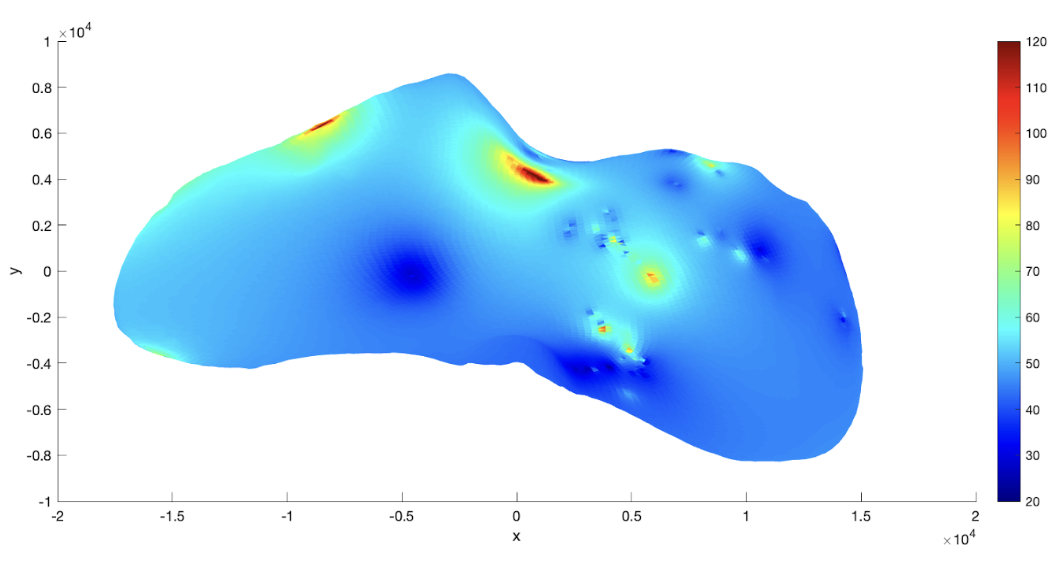 Figure 2: A map of the regolith depth in meters across the surface of Eros.
To determine the MBEA based on regolith depth, we model Eros in SB-CTEM; we assume the same strength, seismic, and material properties for Eros as Richardson et al. (2020), and the impactor flux from Bottke et al. (2005). We find that 48m of regolith requires ~60-94 Myr, with an average of ~82 Myr (Figure 3).
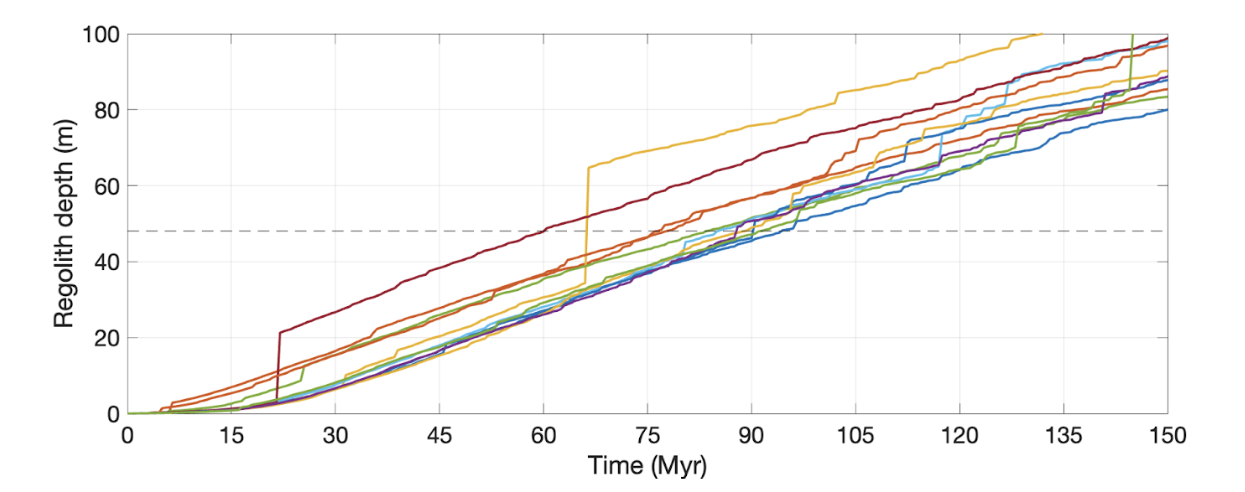 Figure 3: Regolith depth over time in our 11 SB-CTEM simulations. Simulations “move” together and slowly disperse over time due to the effects of rare, large impacts, which cause regolith depths to “jump” stochastically. |
Discussion
This MBEA of ~82 Myr for the regolith is a much younger age than previously estimated by Richardson et al. (2020). The age difference could be due to incomplete image coverage of subsidence pits and/or associated errors with measuring distance across the surface of an irregular object. Further refinement of material properties may also close the gap between the MBEAs of the regolith and craters.
Acknowledgements
This work was funded by NASA DDAP grant 80NSSC21K1014.
How to cite: Steckloff, J., Richardson, J., Berman, D., and Chuang, F.: The Thickness and Age of Asteroid 433 Eros’ Surface Regolith, EPSC-DPS Joint Meeting 2025, Helsinki, Finland, 7–13 Sep 2025, EPSC-DPS2025-1225, https://doi.org/10.5194/epsc-dps2025-1225, 2025.
Impact cratering is one of the primary processes influencing major landscape evolution on an asteroid’s surface. The largest craters offer a unique natural laboratory to investigate an asteroid's interior structure through the exhumation and redistribution of material via hypervelocity impacts. Metal-rich asteroids, thought to be the leftover cores of differentiated planetesimals [1], exhibit variable metal concentrations indicated by radar albedo measurements, and heavily cratered surfaces; however, a detailed understanding of their collisional modification is currently a key unanswered question. In addition, several of the M-types in the main belt, such as asteroid (16) Psyche, (216) Kleopatra, and (22) Kalliope, have rapid spin rates [2, 3]. As previously shown for asteroid (4) Vesta, ejecta deposition is not hemispherically symmetric when the target is rotating before impact [4]. Instead, the ejecta is deposited over multiple rotations, and the majority of the ejected material is reaccumulated by the asteroid, which may form features like folds and thrusts on the surface of the body. In this work, we demonstrate how the formation of large impact craters on metal-rich worlds, through hydrocode modeling, can provide the foundational framework for understanding their surface and interior morphology, including the influence of pre-impact rotation.
We have developed a workflow using the realistic shape models of asteroids, with asteroid (16) Psyche as an example, to conduct our high-resolution impact simulations, as we find that asteroid shape combined with pre-impact rotation plays a critical role in influencing the final ejecta distribution. Our 3D models use the Bern SPH code [5], which incorporates detailed and validated material treatments, including a strength and cohesion model, and a robust P-α porosity model, subject to a crushing curve [6, 7].
We consider two end-member metal-rich interior structures, a layered metal-silicate interior with a large iron core surrounded by a dunite mantle, with variable porosity throughout the target. Second, a stony-iron meteorite interior with variable porosity. We have developed a new Equation of State (EOS) for the latter, using a modified version of the Tillotson EoS, as one does not exist for more exotic materials like stony-iron. All impacts are performed at 5 km/s impact speed, reflective of the modern main belt. We also conduct additional simulations using idealized spherical targets with varying impact angle, and rotation rate (3-5 hours) to specifically analyze variable ejecta emplacement patterns. We will present provenance maps which track the excavation depth from these impacts on metal-rich targets and comment on the efficiency of material retention as a function of the material characteristics of the target (porosity/crushing strength), and rotation rate.
References
[1] Elkins-Tanton, L. T., Asphaug, E., Bell III, J. F., Bierson, C. J., Bills, B. G., Bottke, W. F., ... & Zuber, M. T. (2022). Distinguishing the origin of asteroid (16) Psyche. Space Science Reviews, 218(3), 17.
[2] Marchis, F., Jorda, L., Vernazza, P., Brož, M., Hanuš, J., Ferrais, M., ... & Yang, B. (2021). (216) Kleopatra, a low density critically rotating M-type asteroid. Astronomy & Astrophysics, 653, A57.
[3] Ferrais, M., Vernazza, P., Jorda, L., Rambaux, N., Hanuš, J., Carry, B., ... & Yang, B. (2020). Asteroid (16) Psyche’s primordial shape: A possible Jacobi ellipsoid. Astronomy & Astrophysics, 638, L15.
[4] Jutzi, M., & Asphaug, E. (2011). Mega‐ejecta on asteroid Vesta. Geophysical Research Letters, 38(1).
[5] Jutzi, M. (2015). SPH calculations of asteroid disruptions: the role of pressure dependent failure models. Planetary and space science, 107, 3-9.
[6] Jutzi, M., Benz, W., & Michel, P. (2008). Numerical simulations of impacts involving porous bodies: I. Implementing sub-resolution porosity in a 3D SPH hydrocode. Icarus, 198(1), 242-255.
[7] Jutzi, M., Michel, P., Hiraoka, K., Nakamura, A. M., & Benz, W. (2009). Numerical simulations of impacts involving porous bodies: II. Comparison with laboratory experiments. Icarus, 201(2), 802-813.
How to cite: Baijal, N., Asphaug, E., Denton, C. A., Jutzi, M., Raducan, S., and Cambioni, S.: Collisional Modification of Metal‑Rich Asteroids and the Influence of Pre‑impact Rotation, EPSC-DPS Joint Meeting 2025, Helsinki, Finland, 7–13 Sep 2025, EPSC-DPS2025-766, https://doi.org/10.5194/epsc-dps2025-766, 2025.
Rubble-pile asteroids are a conglomeration of weakly gravitationally bound granular material. Missions such as OSIRIS-REx, Hyabusa, and Hyabusa2 to asteroids 101995 Bennu, 25143 Itokawa, and 162173 Ryugu have shown that their surfaces are strewn with material ranging from decimeters to tens of meters in size [1, 2]. The polydisperse nature of their surfaces complicates the dynamics of a low velocity secondary impacts (~m/s) and spacecraft landing on these bodies. Many experiments of impacts are performed in monodisperse granular material with spherical grains. We present experiments of low velocity impacts into a polydisperse mixture of sand and gravel, measuring the ejecta launch angles, velocities, and asymmetry in the ejecta flow field. We then compare these ejecta curtains to those made by impacts into monodisperse sand.
The granular media is held in an 11-gallon (41.6 liter) galvanized washtub that is predominately filled with monodisperse sized playground sand that is surrounding a polydisperse mixture as shown in Figure 1. The polydisperse mixture is positioned directly below the impact site. We film the resulting ejecta curtain using two Krontech Chronos 2.1high-speed cameras at 1000 frames per second (fps) positioned above and to the side of the impact site. The sand grains are nearly uniform in size with diameters on the order of micrometers. Larger gravel grains have sizes of a few centimeters. The large gravel grains are painted using fluorescent paint and lit with blue LEDs to contrast against the grains against the sand.
We use a glass marble as our impactor with diameter of 3.5 cm, painted black with green dots, and have a mass of about 60g. The impactor is released from a height of ~200 cm resulting in an impact velocity of ~6.2 m/s. Two experimental sets are presented, impacts into monodisperse sand, and impacts into the polydisperse mixture.
We analyze our ejecta curtain using three different methods: particle tracking to measure the velocity field of the ejecta curtain, a histogram of oriented gradients (HOG) to investigate the ejecta angle and structure, and particle image velocimetry (PIV) to measure the azimuthal distribution of ejecta around the impact site.
We find that the ejecta curtain produced by impacts into a polydisperse media is very different from those produced in impacts into monodisperse sand. We use particle tracking to measure the velocity of the ejecta from the side of the impact. Plotting the velocity components of the ejecta from our experiments shows asymmetry in the ejecta velocities with different slopes bounding the locus of points. Our HOG analysis highlights the complex structure in the ejecta curtain caused by the large gravel grains buried below the surface interacting with the smaller sand grains. With PIV, we see a clear azimuthal asymmetry around the impact point with impacts into sand displaying more evenly distributed ejecta direction. However, impacts into polydisperse media have a multi-modal distribution. These experiments qualitatively reproduce results of the Small Carry-on Impactor (SCI) impact into the asteroid Ryugu [3, 4].
[1] DellaGiustina, D.N., et. al (2019) Properties of rubble-pile asteroid (101955) Bennu from osiris-rex imaging and thermal analysis. Nature Astronomy 3, 341–351.
[2] Michikami, T., et. al (2019) Boulder size and shape distributions on asteroid Ryugu. Icarus 331, 179–191.
[3] Honda, R., et. al (2021) Resurfacing processes on asteroid (162173) Ryugu caused by an artificial impact of Hayabusa 2’s small carry-on impactor. Icarus 366, 114530.
[4] Arakawa, M., et. al (2020) An artificial impact on the asteroid (162173) Ryugu formed a crater in the gravity-dominated regime. Science 368, 67–71. doi:10.1126/science.aaz1701
How to cite: Wright, E., Argueta, E., and Losert, W.: Impacts and Ejecta in Natural Multi-scale Granular Material, EPSC-DPS Joint Meeting 2025, Helsinki, Finland, 7–13 Sep 2025, EPSC-DPS2025-1663, https://doi.org/10.5194/epsc-dps2025-1663, 2025.
Please decide on your access
Please use the buttons below to download the supplementary material or to visit the external website where the presentation is linked. Regarding the external link, please note that Copernicus Meetings cannot accept any liability for the content and the website you will visit.
Forward to presentation link
You are going to open an external link to the presentation as indicated by the authors. Copernicus Meetings cannot accept any liability for the content and the website you will visit.
We are sorry, but presentations are only available for users who registered for the conference. Thank you.
Impact basins are the largest impact structures. Their formation is exclusive to the first ~800 Myrs since the formation of the Solar System, when the largest impactors left over from planetary accretion were still roaming [e.g., 1]. Impact basins were formed by planetary-scale impacts that remobilised considerable portions of the target’s lithosphere, significantly affecting the structure of the crust and mantle and its subsequent evolution. Through their study, it is possible to construct a better understanding of the thermal and geological evolution of the target at the time of impact, providing important insights into the early phases of planetary evolution in the Solar System [e.g., 2, 3, 4].
The properties of impact basins are controlled by the target’s lithospheric thickness and thermal properties at the time of impact. The formation of peak and multi-ring structures is predominantly governed by the thickness of the lithosphere. The formation of multi-rings is favoured by a thinner lithosphere, allowing the formation of more pronounced displacement along faults in the outskirts of the basins. The size of impact basins and the volume of impact melt produced by the impact are highly sensitive to the thermal conditions in the crust and upper mantle at the time of impact. Numerical simulations suggest that higher temperatures favour the formation of larger basins flooded by higher amounts of melt for a given set of impact conditions.
On the Moon, the thermal gradient played a dominant role in determining the final size of an impact basin. For a given set of impact conditions, impact basins formed in the Procellarum KREEP Terrane were larger than impact structures at other locations due to the unique thermal conditions present at the base of the crust [2]. Impact basins forming while the lunar magma ocean was still cooling resulted in a different morphology, with impact basins prone to easier erasure over time [3]. On Mars, the interplay between crustal thickness and thermal gradients in the Northern lowlands and Southern highlands during early geological epochs significantly influenced the final structure of impact basins [4]. For a given set of impact conditions, the thin crust typical for the lowlands favoured the formation of larger basins and increased the chances of multi-ring development, while the thicker crust typical for the highlands favoured the formation of smaller basins with less pronounced rings. The likelihood of the preservation of such basins is controlled by lithospheric temperature, with higher temperatures likely causing the formation or larger amounts of melt and preventing preservation of multi-rings at the surface. Mercury presents a scenario similar to the Moon, where impact basins formed in a thin crust and mantle under comparatively higher gravity conditions. Numerical simulations suggest that even the largest basins formed without significant interaction with the core despite its relatively larger size in relation to the planet’s volume in comparison to other rocky worlds. Similarly to Mars, higher lithospheric temperatures prevent the preservation of features associated to larger basins such as Caloris, resulting in flat impact structures almost entirely flooded by impact melt [e.g., 5]. Venus poses a more complex challenge. Regional variation in lithospheric thickness and apparent scarcity of impact basins complicate our understanding of its impact history but highlights the influence of unique planetary geophysical properties in the cratering record. It is likely that the high temperatures, especially in the upper lithosphere, and the subsequent intense crustal recycling erased most traces of older impact structures. Nevertheless, it is likely that records of such impacts can still be seen in the lithosphere, accessible through a combination of geodynamical and impact modelling.
This work systematically reviews the formation of impact basins on the Earth and Moon, Mars, Venus, and Mercury. We interrogate the existing cratering records of impact basins on these bodies to better understand the planet-defining impactor population. We compare insights from numerical impact simulations, with the current knowledge of global thermal evolution and crustal thickness models of the early geological epochs of the Moon and terrestrial planets, including numerical limitations and unknowns. By examining these properties, we can gain insights into the thermal and structural evolution of these bodies and enhance our understanding of the large impactor population in the early Solar System, shedding light on the frequency and scale of these planet-altering events.
[1] Marchi et al (2009) AJ 137 4936. [2] Miljkovic et al (2013) Science342,724-726. [3] Miljkovic et al (2021) Nat Commun 12, 5433 [4] Branco et al (2024) JGR: Planets, 129, e2023JE008217. [5] Gosselin et al. 2023. JGR: Planets 128, e2023JE007920.
How to cite: Miljkovic, K. and Branco, H.: Structure and evolution of terrestrial bodies as recorded by impact basins , EPSC-DPS Joint Meeting 2025, Helsinki, Finland, 7–13 Sep 2025, EPSC-DPS2025-666, https://doi.org/10.5194/epsc-dps2025-666, 2025.
Over 210 impact structures have been confirmed on Earth. However, this figure represents only a small portion of the true history of collisions between Earth and extraterrestrial objects. Much of the terrestrial impact record has been lost due to tectonic activity, volcanism, erosion, and burial by sediments. Furthermore, the current distribution of recognized impact structures across the continents is highly uneven. Africa, for instance, has only 20 confirmed structures—about 10 % of the global total—despite making up roughly a quarter of the non-glaciated continental land area and hosting extensive Archean and Paleoproterozoic terranes.
The deficit is even starker in West Africa, where just three impact structures have been confirmed across a region spanning over 5 million km²—about one-fifth the size of the African continent, 80 % of which consists of ancient geological terranes. West Africa is defined here as the region including the 16 following countries: Benin, Burkina Faso, Cape Verde, The Gambia, Ghana, Guinea, Guinea-Bissau, Ivory Coast, Liberia, Mali, Mauritania, Niger, Nigeria, Senegal, Sierra Leone, and Togo (which corresponds to the United Nations (UN) and Economic Community of West African States (ECOWAS) definitions).
Numerous potential impact sites in West Africa have been proposed, often based on remote sensing. However, several factors hinder progress in verifying these sites: limited accessibility, security challenges, insufficient research funding, and a limited number of local geologists with some expertise in impact science. Here, we have compiled the current knowledge on confirmed, rejected, and potential impact structures in West Africa, which has just been presented in a review paper [1]. This compilation serves as a gateway to the literature, and to encourage local geologists to conduct field investigations. The compilation takes also advantage of recent data, such as the FABDEM, a public topographic data platform of unprecedented quality [2]. The topographic information has been extracted for each site and is provided on a public data repository [3]. The compilation also highlights the potential links between impact structures and economically valuable mineral deposits, underscoring their relevance to exploration geologists and mining companies operating in the region.
In this review of confirmed, possible, and unlikely impact structures in West Africa, we have evaluated 16 potential sites in detail (Fig. 1). Among them, we recommend prioritizing future research—such as field investigations, geophysical surveys, sampling, and petrographic analysis—on the most promising candidates: Anefis, El Mrayer or Mejaouda, Tafassasset, Temimichat Ghallaman, Terhazza, and Velingara.

Fig. 1 - Map of the locations of confirmed impact structures (green), potential impact structures (yellow), and discarded (red) structures in West Africa, superposed onto regional climate/vegetation zones and rainfall isolines, in cylindrical map projection) [1].
West Africa's impact structure record is undoubtedly incomplete, indicating considerable potential for new discoveries across this region. Despite obstacles listed above, future expeditions can still be planned, with priorities refined through ongoing advancements in remote sensing and analytical techniques. Notably, one of the earliest confirmed African impact structures, Aouelloul, was initially identified through aerial imagery [4]. In more recent efforts, systematic searches for circular features have been conducted in Morocco using modern satellite imagery [5], whereas surveys in Mauritania have combined satellite imagery with topographic data in an innovative approach [6]. Citizen science can also play a meaningful role in advancing impact structure research. The Vigie-Cratère program (https://vigie-cratere.org), active across multiple countries and continents, provides a platform for the public to help identify circular structures using shaded relief and satellite imagery, or to submit information (pictures, observations) that help to prioritize future field expeditions.
Bibliographic references
[1] Niang, C.A.B., Baratoux, D., Rochette, P., Quesnel, Y., Reimold, W.U., 2025. The impact record of West Africa: Confirmed impact structures and potential impact sites. Journal of African Earth Sciences 228, 105627. https://doi.org/10.1016/j.jafrearsci.2025.105627
[2] Hawker, L., Uhe, P., Paulo, L., Sosa, J., Savage, J., Sampson, C., Neal, J., 2022. A 30 m global map of elevation with forests and buildings removed. Environ. Res. Lett. 17, https://doi.org/10.1088/1748-9326/ac4d4f
[3] Niang, C.A.B., 2025. FABDEM data of confirmed and potential impact structures in West Africa. https://doi.org/10.5281/zenodo.14630132.
[4] Ould Mohamed Navee, E., Chennaoui Aoudjehane, H., Baratoux, D., Ferrière, L., Ould Sabar, M.S., Si Mhamdi, H., 2024a. Aouelloul impact crater, Mauritania: new structural, lithological, and petrographic data. J. Afr. Earth Sci., 105210 https://doi.org/j.jafrearsci.2024.105210
[5] Chaabout, S., Chennaoui Aoudjehane, H., Reimold, W.U., Baratoux, D., Youbi, N., 2015. Prospecting for possible impact structures in Morocco. J. Afr. Earth Sci. 112, 339–352. https://doi.org/10.1016/j.jafrearsci.2015.08.002.
[6] Ould Mohamed Navee, E., Baratoux, D., Chennaoui Aoudjehane, H., Si Mhamdi, H., Raji, M., 2024b. Systematic search of circular structures using satellite imagery to identify potential new impact structures in Mauritania. J. Afr. Earth Sci. 216, 105303. https://doi.org/10.1016/j.jafrearsci.2024.105303.
How to cite: Niang, C. A. B., Baratoux, D., Pierre, R., Yoann, Q., and Wolf Uwe, R.: Confirmed meteoritic impact structures and potential sites in West Africa, EPSC-DPS Joint Meeting 2025, Helsinki, Finland, 7–13 Sep 2025, EPSC-DPS2025-472, https://doi.org/10.5194/epsc-dps2025-472, 2025.
Meteorites that have impacted the Earth's surface in the past have created impact craters. Most of these craters have not been preserved in a form that allows for their contemporary identification, but some, especially in Central and Northern Europe, have been described and classified as geological structures formed by meteorite impacts. When a celestial body strikes the Earth's surface, it causes a temporary increase in temperature to several hundred degrees Celsius, sometimes exceeding the Curie temperature for ferromagnetic rocks and minerals that make up the near-surface layer. Magnetization is relatively stable from a geological time perspective. The magnetic record in magnetite is usually stable and is quite difficult to remagnetize (Fassbinder, 2015).
The impact leads to a change in the direction of magnetization in the minerals, which sometimes persists after the impact. This phenomenon is known as Thermoremanent Magnetization (TRM). It is characteristic of meteorite impact sites. This property is attributed to minerals cooled from high temperatures resulting from plutonic/volcanic processes or meteorite impacts. It is one of several types of remanent magnetization, but only this type will be present in impact structures (Fassbinder, 2015).
The project aims to conduct research in the field of applied geophysics and the magnetic properties of rock and mineral samples in the area of craters formed by meteorite impacts in the context of thermomagnetic anomalies.
As part of this project, proton magnetometer measurements have been conducted in the areas of the Morasko craters in Poland, the Dobele crater in Latvia, the Vepriai crater in Lithuania, and several craters in Estonia (Ilumestsa, Simuna, Tsõõrikmäe, Kärdla, Kaali). Samples from the Estonian craters have been collected for paleomagnetic studies and analyzed using a rotational magnetometer and a magnetic susceptibility instrument. The results of the magnetometric measurements are very promising and exhibit characteristic patterns of magnetic field anomalies typical of impact craters.
The project is funded under the 'Pearls of Science' program by the Ministry of Science and Higher Education of the Republic of Poland.
How to cite: Zawadzki, M., Godlewska, N., and Oryński, S.: Measurements of Earth's magnetic field anomalies caused by meteorite impacts, EPSC-DPS Joint Meeting 2025, Helsinki, Finland, 7–13 Sep 2025, EPSC-DPS2025-177, https://doi.org/10.5194/epsc-dps2025-177, 2025.
Secondary cratering is a widely recognized phenomenon on Moon, Mars, Mercury, and the icy satellites of Jupiter and Saturn. It was disputed if secondary craters exist on Earth in the presence of a 1-bar atmosphere until the first secondary crater field was discovered in 2022 in Wyoming, USA [1]. Here, we present and confirm fifteen additional secondary impact structures within the Wyoming crater field, USA, leading to the total number to 46 impact structures confirmed by shock effects. In addition, we identified more than 200 potential secondaries based on morphology. This expansion includes three newly identified crater areas. The minimum extent of the crater field measures actually 160 × 100 km (Fig. 1). All newly confirmed structures are stratiform and have a Permo-Pennsylvanian age of ~280 Myr. Although the degree of the preservation varies among the discovered craters, similarities between Wyoming’s secondary craters and those on the Moon and Mars are striking and include irregular and elongated crater shapes, shallow depth-to-diameter ratios, and clustered distributions and crater rays. A lack of iron meteorite fragments and trace geochemical impactor signatures is also characteristic for the secondary crater field.
On Earth, the identification of secondary craters is challenging due to active surface processes such as erosion, sedimentation and tectonic activity. The life-time of small craters is very limited [2]. The 280 Myr-old secondary crater field could only be preserved until today because it was buried immediately after its formation in a low-energy coastal environment and got re-exposed by tectonic uplift of the Rocky Mountains Front range system in the Cenozoic after a long period of burial. The completely consolidated state of strata helped to preserve the field until today. In fact, the craters today form erosion-resistant competent patches, which often form small hills; in other words, some can be considered as pedestal craters. There are several reasons for this: impact induced shock lithification [3] and post-impact quartzitic sealing of the numerous impact-induced rock fractures. The latter process appears to be dominant.
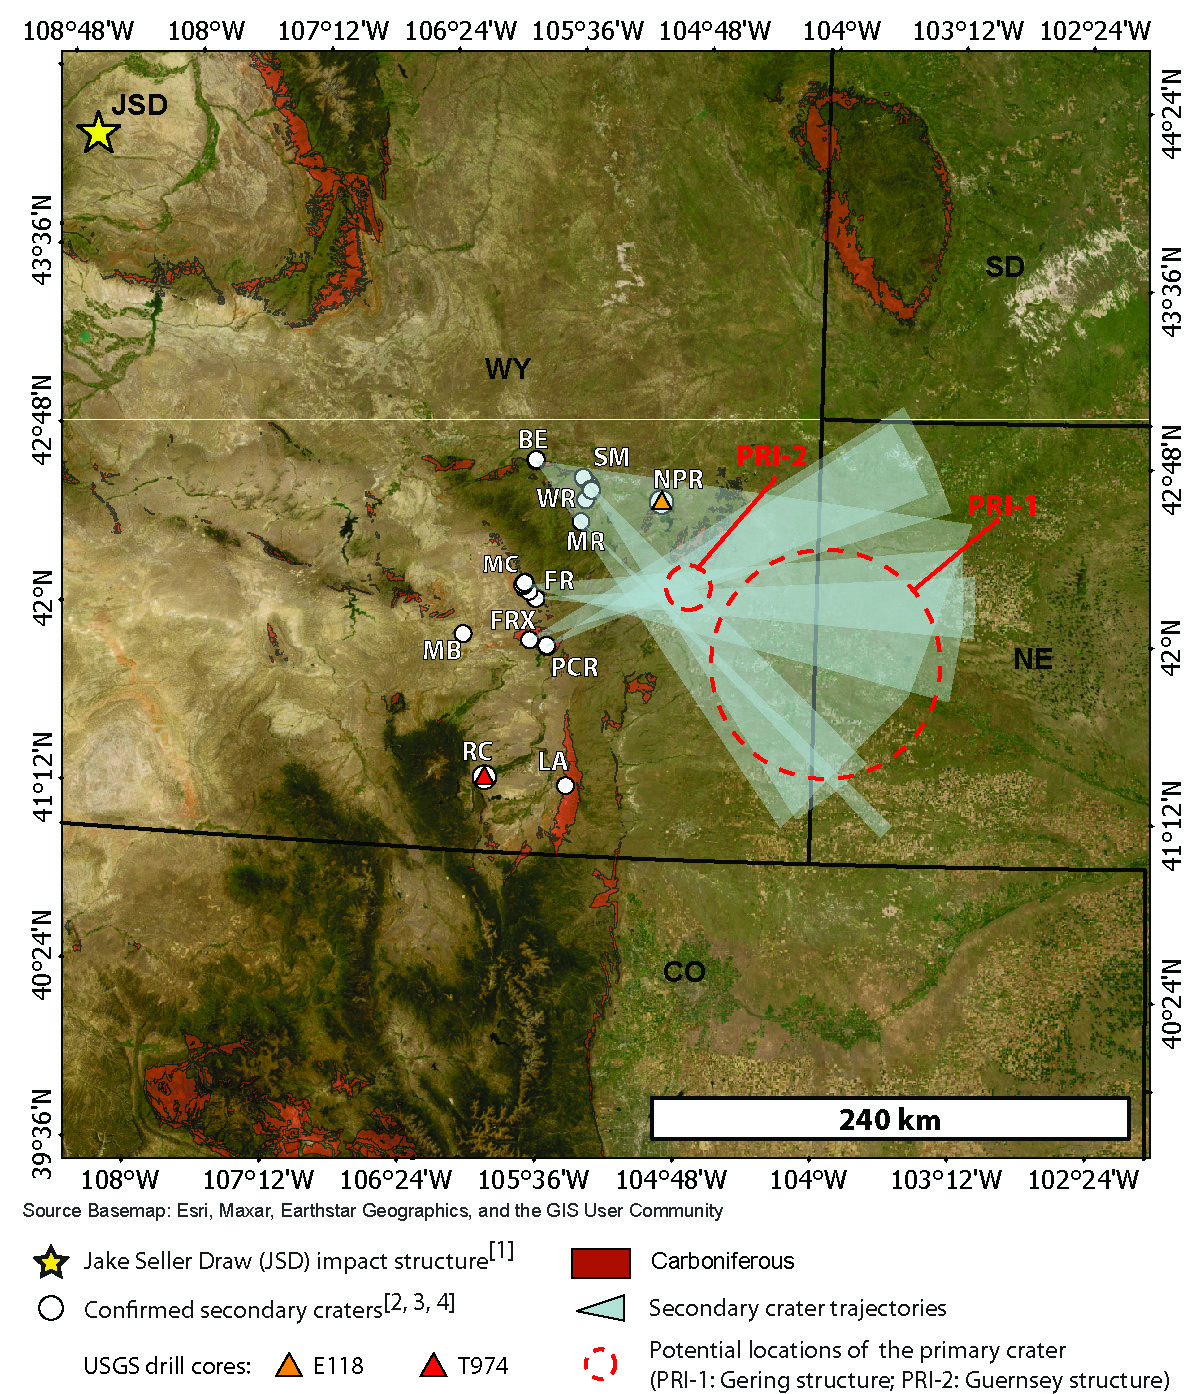
Fig. 1 The Wyoming crater field with trajectory corridors and the location of the potential primary crater.
With the additional secondary craters, we could construct new trajectory corridors to refine the location of the primary crater (Fig. 1). Using trajectory reconstruction and pre-processed geophysical datasets, we now have identified two potential sites for the primary crater (1) PRI-1, provisionally named Gering structure, centered around 41°55‘N / 104°00’W with an estimated diameter of 80-120 km, and (2) PRI-2, provisionally named Guernsey structure, centered at 42°12’N / 104°50’W with a smaller diameter of 20-40 km. The possible crater location PRI-2 is much smaller and closer to the discovered crater field than PRI-1. Our calculations of ballistic ejecta trajectories including impact velocities, impact energies, block sizes, and the simulations of the crater forming process that are based on these ballistic input parameters [1] are valid for the primary crater location PRI-1, but need refinement for PRI-2. For the latter location PRI-2, the ejection distances are likely too short, and the impact velocities appear insufficient to generate significant shock volumes during the secondary cratering events. In such a scenario, the majority of shocked minerals discovered in many of the secondary craters may likely have originated from the primary crater itself.
References
[1] Kenkmann, T., Müller, L., Fraser, A., Cook, D., Sundell, K., and Rae, A.S.P., 2022, Secondary cratering on Earth; the Wyoming impact crater field: GSA Bulletin, vol. 134 (9-10), 2469-2484, https://doi.org/10.1130/B36196.1.
[2] Hergarten, S. and Kenkmann, T., 2015. The number of impact craters on Earth: Any room for further discoveries? Earth Planet. Sci. Lett. 425, 187-192. doi: 10.1016/j.epsl.2015.06.009.
[3] Kenkmann, T., Sundell, K.A., and Cook, D., 2018, Evidence for a large Paleozoic Impact Crater Strewn Field in the Rocky Mountains: Scientific Reports, vol. 8, 13246. https://doi.org/10.1038/s41598-018-31655-4.
How to cite: Kenkmann, T., Sturm, S., Wieck, I., Cook, D., Fraser, A., and Sundell, K.: More impact structures in Wyoming´s secondary crater field , EPSC-DPS Joint Meeting 2025, Helsinki, Finland, 7–13 Sep 2025, EPSC-DPS2025-1664, https://doi.org/10.5194/epsc-dps2025-1664, 2025.
The currently accepted model for the origin of the Moon is that of a giant impact between a proto-Earth and a Mars-sized body, Theia, that produced an initial protolunar disk that later accreted into the Earth and Moon couple [1-5].
Here, we employ the smoothed particle hydrodynamic method to investigate how varying Theia’s mass, γ, and its core mass fraction (CMF) affect the giant-impact process and the post-impact compositions of the proto-Earth and the protolunar disk. We fix the total system mass at 1.02 Earth mass and explore impactor mass ratios γ of 0.13, 0.16, and 0.20 total mass, each at an oblique impact angle of ~45°, while varying Theia’s CMF from 10% to 70%.
Our dynamical results show that, under the constraint of reproducing the present Earth-Moon angular momentum, Theia’s mass must not exceed ~0.15 Earth mass, as larger impactors produce too much angular momentum. Furthermore, Theia’s CMF strongly controls the post-impact material: an increased CMF yields higher iron concentrations in both the post-impact proto-Earth and the protolunar disk, while simultaneously diminishing the fraction of Theia-derived silicates in each.
Using the results of our SPH simulations, we obtain the mass distribution in the resulting protolunar disk, from which we can try to derive some characteristics of Theia and proto-Earth. To translate these findings into geochemical features, we combine elemental (Fe, Si, Mg) and isotopic (Δ17O, ε50Ti, ε54Cr) data for Earth’s and Moon’s mantles with mass-balance modeling. Under both end-member scenarios—complete iron–silicate equilibration and zero equilibration—we find that Theia’s CMF must be <35% to satisfy dual Earth-Moon constraints. Correspondingly, Theia’s mantle would have Fe < 11%, Si ≈ 20-21%, Mg ≈ 18-21%, Δ17O×CO ≈ -2.61~-1.96, ε50Ti×CTi ≈ -0.01~0, and ε54Cr×CCr ≈ 0~0.04. The proto-Earth’s mantle, in contrast, would be characterized by Fe ≈ 5-7%, Si ≈ 21~22%, Mg ≈ 22-23%, Δ17O×CO ≈ -2.86~-2.61, ε50Ti×CTi ≈ 0.002~0.004, and ε54Cr×CCr ≈ 0.01~0.05.
Comparing these modeled compositions to those of planetary models and measurements on different meteorite groups indicates that Theia's mantle closely resembles Earth's in both elemental abundances and isotopic characteristics, with only a slight difference in Si and Mg content, while proto-Earth's mantle exhibits an even stronger resemblance to present-day Earth. Furthermore, from the O, Ti, and Cr data covering both differentiated and undifferentiated meteorite samples, Aubrites exhibit the closest match to the predicted composition of Theia’s mantle. The isotopic signatures of proto-Earth and Theia also closely resemble those of EH and EL chondrites; however, the undifferentiated nature of EH and EL accounts for the pronounced differences in Fe, Si, and Mg compositions. This suggests both bodies originated from highly reduced, enstatite-chondrite-rich material in the inner Solar System.
In summary, by integrating SPH modeling with Earth–Moon geochemical data, we provide quantitative pre-impact constraints on Theia’s mass (~0.13–0.15 Earth mass), CMF (< 35%), and reduced, Aubrite-like mantle composition [6], as well as confirmation that the proto-Earth mantle closely resembles that of today. These findings alleviate the lunar isotope conundrum and offer new pathways for tracing Theia’s provenance and the early evolution of the Earth–Moon system.
REFERENCES
[1] Asphaug, E. Annu. Rev. Earth Planet. Sci. 42, 551-578 (2014).
[2] Cameron, A. G. W. & Ward, W. R. Abstr. Lunar Planet. Sci. Conf. 7, 120-122 (1976).
[3] Canup, R. M. et al. Rev. Mineral. Geochem. 89, 53-102 (2023).
[4] Ćuk, M. & Stewart, S. T., Science 338, 1047-1052 (2012).
[5] Caracas, R. & Stewart, S. T., Earth Planet. Sci. Lett. 608, 118014(2023).
[6] Dauphas, N., Burkhardt, C., Warren, P. H. & Teng, F. Phil. Trans. R. Soc. A. 372, 20130244 (2014).
How to cite: Shi, Z., Wang, Z., Zuo, R., Caracas, R., and Li, S.: Constraining the Theia and proto-Earth in the Moon-forming giant impact, EPSC-DPS Joint Meeting 2025, Helsinki, Finland, 7–13 Sep 2025, EPSC-DPS2025-602, https://doi.org/10.5194/epsc-dps2025-602, 2025.
We examine the plausibility of a lunar origin of natural objects that have a negative total energy, that is, ET<0, with respect to the geocenter while they have a geocentric distance r <3RH, where RH is the Earth's Hill radius, a population of objects that we will refer to as 'bound'. They are a super-set of the informally-named population of 'minimoons' that make at least one orbit around Earth in a frame rotating with the Earth's orbit and have a geocentric distance r <RH at some point while ET<0. Bound objects are also a dynamical subset of the population of Earth's co-orbital population, objects in a 1:1 mean motion resonance with the Earth or, less specifically, on Earth-like orbits. Only two minimoons have been discovered to date, 2006 RH120 and 2020 CD3, while 2024 PT5 and 2022 NX1 meet our condition for 'bound'. The likely source region of co-orbital objects is either the asteroid belt, the Moon (that is, lunar ejecta), or a combination of both. Earlier works found that dynamical evolution of asteroids from the asteroid belt could explain the observed minimoon population, but visual reflectance spectra of 2020 CD3, 2024 PT5, and Earth's co-orbital Kamo'oalewa are more consistent with lunar basalts than any asteroid spectra, suggesting that the ejection and subsequent evolution of material from the Moon's surface contributes to the minimoon population and, more generally, Earth's co-orbital population. We report on our numerical calculations of the steady-state size-frequency distribution of the bound population given our current understanding of the lunar impact rate, the energy of the impactors, crater-scaling relations, and the relationship between the ejecta mass and speed [1]. We numerically integrate the trajectory of lunar ejecta and calculate the statistics of 'prompt' bounding that take place immediately after ejection, and 'delayed' bounding that occurs after the objects have spent time on heliocentric orbits. A sub-set of the delayed bound population composes the minimoon population. We find that lunar ejecta can account for the observed population of bound objects but uncertainties in the crater formation and lunar ejecta properties induce an uncertainty range on the predicted population spanning orders of magnitude. If the bound objects can be distinguished as lunar or asteroidal in origin based on their spectra, it may be possible to constrain crater formation processes and the dynamical and physical evolution of objects from the asteroid belt into near-Earth space.
[1] Jedicke et al. 2025, Icarus 438, 116587
How to cite: Granvik, M., Jedicke, R., Alessi, E. M., Wiedner, N., Ghosal, M., and Bierhaus, E. B.: Can the Moon be the source for minimoons?, EPSC-DPS Joint Meeting 2025, Helsinki, Finland, 7–13 Sep 2025, EPSC-DPS2025-1472, https://doi.org/10.5194/epsc-dps2025-1472, 2025.
Introduction: The rays of Tycho crater are prominent features of the lunar nearside [1]. Rays and clusters of secondary craters from Tycho have been mapped as far as Taurus Littrow Valley (TLV), the Apollo 17 landing site, more than 2000 km from the impact crater [2]. It has been suggested that some Tycho ejecta hit the summit of the South Massif and triggered the Light Mantle avalanche in TLV [3,4]. One of the lines of evidence in support of Tycho-ejecta-triggered avalanching is the presence of a cluster of secondary craters on the crest of the South Massif, which is part of a more extended cluster that trends in the general direction of Tycho, spanning from the South Massif across the valley floor of TLV and the North Massif into Littrow crater [4,5] (Figure 1). A competing hypothesis suggests that the Light Mantle was instead triggered by seismic activity associated with the Lee-Lincoln lobate scarp in TLV [6,7]. Definitive evidence for the Light Mantle to be an avalanche either impact-related or seismic-related is yet to be found.
In this work, we aimed to further the understanding of the distribution of the rays and secondary craters of Tycho. Our main purpose is to further inform the discussion about the origin of the Light Mantle.
Methods: We defined a first region of interest (ROI-1) whose longitude and latitude limits are Tycho crater (SW corner) and TLV/Littrow crater (NE corner). This area covers 5,462,043 km2 (Figure 2). We used YOLOLens, an object detection model with performance enhanced by super-resolution methodology [8], on Kaguya Terrain Camera (TC) imagery (~7 m/px resolution) to generate a dataset of craters >100 m in diameter (Ncraters = 6,867,654) within ROI-1. The TC image resolution has been downsampled to 21 m/pixel. To generate the dataset, it took ~90 hours for pre-processing, ~25 hours for testing, ~6-8 hours for post-processing, and ~4 hours for a second post-processing stage. In ArcGIS Pro, we generated crater density diameter maps [e.g., 8] from the generated crater dataset.
In a narrower area about 150 km wide that extends between Tycho crater and TLV (ROI-2, Figure 2), we complemented the generated dataset with existing databases of lunar impact craters >1-2 km in diameter [9,10,11], and manual editing.
We used the ASCI (Algorithm for the Secondary Crater Identification) cluster analysis method [12] to identify clustered craters (thus potential secondary craters) based on deviations from a calculated random distribution: we defined 11 crater diameter ranges, and computed Voronoï polygon (VP) tesselation over the crater population of each size range; we then plot together the size-frequency distribution (SFD) of VPs of the mapped craters and of 300 simulations of the same crater population with a randomized distribution. The mean and the confidence envelope at ± 1σ of the simulated VPs SFD are computed. The intersection between the VPs SFD from mapped and simulated crater populations at +1σ corresponds to the threshold area below which polygons are described as clustered (thus the craters contained have a likely secondary origin), whereas those above the threshold value are considered random (thus considered primaries) (Figure 3).
Results: The dataset generated contains 6,867,654 craters. We generated RGB composite diameter density maps to visualize the crater distribution by size range (100-150 m; 150-250m; 250-400m) (Figure 2). This initial analysis of the crater population shows well the existence of several rays associated with Tycho crater (bottom half of Figure 2). Further away from Tycho crater (upper part of Figure 2), less prominent rays are still visible. Many of such further rays seem to also point back to the Tycho crater location. In particular, a swarm of such rays appear near to TLV.
The crater cluster analysis reveals that in ROI-1 2,863,257 craters are clustered, corresponding to 42% of the total population (Figure 4a). In ROI-2, the corridor from Tycho to A17 landing site, the analysis reveals that 240,546 are clustered craters (Figure 4b). When accounting for the expected maximum secondary crater size from Tycho (i.e., 5% of Tycho diameter), the number of clustered craters is 239,865, corresponding to 52% of the population in this region.
Discussion and Conclusions: The density maps that we have generated allow us to identify ray segments that would otherwise be hard to detect using optical and spectral imagery alone. In particular, such density maps enable us to identify proximal and distant ray material that could be potentially correlated with Tycho. Maps of clustered craters show that their density decreases with distance from Tycho and that such a crater population (assumed secondaries) is dominated by craters smaller than 1 km. Additionally, the ROI-1 clustered craters map shows local areas of high density around smaller craters.
We identify crater clusters aligned with the Tycho direction in TLV and beyond. This observation supports the previously mapped clustered craters at the Apollo 17 landing site as potentially derived from Tycho secondary impacts. Especially, identified clustered craters on the summit of the South Massif suggests that impacts may have destabilized slope material. However, we cannot comment whether these impacts were energetic enough to trigger the Light Mantle.
An important observation of this work is that potentially secondary craters from Tycho may represent a large percentage of the total crater population. Therefore, their effect on dating lunar surfaces may not be negligeable if not removed.
References: [1] Dundas and McEwen (2007), Icarus, 186(1), 31-40. [2] Lucchitta (1972), USGS Misc. Inv. Map 1-800. 1-800. [3] Muehlberger et al. (1973), USGS PSR, 70042539. [4] Lucchitta (1977), Icarus, 30(1), 80-96. [5] Iqbal et al. (2019), LPSC, Abstract 1005. [6] Schmitt et al (2017), Icarus, 298, 2-33. [7] Magnarini et al. (2023), JGR-Planets, 128(8), e2022JE007726. [8] Lagain et al. (2021a), Nat. Commun., 12, 6352. [9] La Grassa et al. (2023), Remote Sensing, 15(5), 1171. [10] Robbins (2019), JGR-Planets, 124(4), 871-892. [11] Wang et al. (2021), JGR-Planets, 126(9), e2020JE006728. [12] Lagain et al. (2021b), Earth and Space Science, 8(2), e2020EA001598.
How to cite: Magnarini, G., Grindrod, P., La Grassa, R., Tullo, A., Re, C., and Cremonese, G.: Rays and secondary craters of the Tycho impact event revealed through deep learning., EPSC-DPS Joint Meeting 2025, Helsinki, Finland, 7–13 Sep 2025, EPSC-DPS2025-770, https://doi.org/10.5194/epsc-dps2025-770, 2025.
Please decide on your access
Please use the buttons below to download the supplementary material or to visit the external website where the presentation is linked. Regarding the external link, please note that Copernicus Meetings cannot accept any liability for the content and the website you will visit.
Forward to presentation link
You are going to open an external link to the presentation as indicated by the authors. Copernicus Meetings cannot accept any liability for the content and the website you will visit.
We are sorry, but presentations are only available for users who registered for the conference. Thank you.
1. Introduction
Impacts are ubiquitous in the Solar System and recently interest has grown into studying the spectrum of the light flashes from these impacts, and the information that the spectra might contain (for example, the composition of the impactor) (see [1] – [6] for examples).
However, such impact events are very short lived (~micro-seconds for mm-sized impactors) and thus very fast spectroscopy is needed to analyse the data from these impacts. High speed, spectrometers are commercially available (i.e. from Teledyne Princeton Instruments) but are expensive and require very accurate triggering. Therefore we set about building our own spectrometer from parts in the lab to see if we could capture impact flash spectra from mm-sized projectiles fired in the University of Kent’s LGG.
2. Experimental setup
The idea was to have a mirror that would vibrate in one plane at high speed. This would reflect light in an arc onto a diffraction grating. A digital SLR would then be focussed on the other side of the diffraction grating and would take an image of the resulting spectrum as the arc was swept from side-to-side. This would give time versus spectral information in a single image.
An old electric toothbrush (a ‘Phillips Sonicare HX6511/43’) was discovered to have a vibrating brush-end that vibrated at ~1000 Hz and through an angle of approximately 30° in a single plane. The brush mount was removed and a polished aluminium mirror with a diameter of 25 mm was epoxied onto the end. This was then inverted and fixed through the top of a black plastic enclosure. A fibre optic feed was mounted on the side of the enclosure to shine light from the target in the impact chamber onto the vibrating mirror. Another hole was drilled in the front of the enclosure to accommodate a diffraction grating and the front of a digital SLR (a Nikon 3200) which was remotely commanded from a Linux laptop (Figure 1).

At the target chamber end a high-speed Nikon f/1.2 lens was mounted on the external surface of the target chamber and focussed onto the impact area of the target in the target chamber. The light from this lens was then focussed onto the top of a microscope objective which then launched the light into an optical fibre. All experiments were carried out in a darkened lab and the optics were made light-tight.
Just prior to a shot the toothbrush was switched on, and the camera commanded to take four x 3-second exposures. When an impact occurred the light from the impact would be seen by the camera during its exposure and recorded as a spectrum.
4. Example results
4.1 Shot G040321#2.
In this shot the projectile was a 4 mm long by approximately 4 mm diameter cylinder of nylon fired into a mix of glycine and water ice. The measured impact velocity was 6.272 km/sec.
During this shot the projectile broke up into three fragments (a common occurrence) and these fragments were recorded by the time-of-flight oscilloscope. The impact flashes generated by these fragments were also recorded by the toothbrush spectrometer and are shown below. The oscilloscope trace gives temporal information so that the X-axis of the toothbrush spectrometer’s image can be calibrated.

As can be seen the individual flash spectra of the impacts can be clearly seen. ‘ImageJ’ was used to give an intensity scan across the centre of the spectra (right-hand image of Figure 2) and shows that spectral information is evident. Note no attempt has been made to correct the intensity scan from the RGB information given in the Nikon NEF image.
The time difference between the first (left-hand) and second (middle) impacts was approximately 130 microseconds, and between the second (middle) and third (right-hand) was approximately 90 microseconds, thus we have a smear spectrometer with a temporal resolution of a few tens of microseconds
4.2 Shots G200521#1 and G200521#3
Two shots were performed to attempt to do a spectral calibration of the toothbrush spectrometer. In the first shot (G200521#3) a 1.5 mm diameter copper projectile was fired at a 3 mm thick copper plate at 4.827 km/sec. An Ocean Optics Redtide USB650 spectrometer was used to acquire a single spectrum of the impact flash.
In the second shot (G200521#3) the shot was repeated (v = 6.859 km/sec) but the Ocean Optics spectrometer was replaced with the toothbrush spectrometer. Data from the two experiments were combined to give a spectral calibration as seen in Figure 3.

5. Improvements
Sadly work on the toothbrush spectrometer ceased shortly after these experiments, but various improvements were planned. These included:
1) Replacing the colour DSLR camera with a Peltier cooled astronomical camera. This should improve sensitivity and remove the need to colour correct the spectrum.
2) Or, alternatively, have the Bayes filter removed from the DSLR turning it into a monochrome camera.
3) Installing a fast flashing LED to act as a temporal and spectral calibration source.
4) Increasing the resolution of the diffraction grating.
6. Conclusions
Using some inventiveness and spare parts a high-speed smear spectrometer was constructed which gave spectra which contained useful scientific data.
The advantage of such a spectrometer was that it would be able to give temporal information at the few microsecond level and thus show how the spectrum of an impact flash evolves which informs us of the evolution of the ions in the plasma and, potentially, how they interact.
References
[1] Avdellidou C., MNRAS, 484, 4, 2019. [2] Yanagisawa M., Icarus, 434, 2025. [3] Tandy J., Meteoritics and Planetary Science, 55, 10, 2020. [4] Simpson G., PNAS Nexus, 2, 7, 2023. [5] Heunoske D., Procedia Engineering 58:624, 2013. [6] Spathis V., Proceedings of the IAC, 64949, 2021.
How to cite: Price, M. C. and Spathis, V.: Repurposing an electric toothbrush to measure spectra of hypervelocity impact flashes., EPSC-DPS Joint Meeting 2025, Helsinki, Finland, 7–13 Sep 2025, EPSC-DPS2025-200, https://doi.org/10.5194/epsc-dps2025-200, 2025.
Introduction. LUMIO, LUnar Meteoroid Impacts Observer, is an ESA 12U form-factor CubeSat mission for the lunar exploration [1] [2]. Thanks to the LUMIO-Cam, an optical instrument designed for observations in the visible and near-infrared spectrum, this mission aims at monitoring and quantifying the flashes produced during the impact of meteoroids on the far side of the Moon from an L2 orbit.
The collected data will be more accurate than the ground-based telescopes, due to the CubeSat closer to the observing event and unaffected by the influence of the terrestrial atmosphere. Thus, these will allow to outline the first accurate dynamical model of the meteoritical flux in the lunar environment.
The lightcurve of the flash allows to derive the integrated energy Eremitted within the spectral interval Δλ on the lunar surface, and once known the luminous efficiency η, to derive the kinetic energy EK as Er/ η. At the same time, additional information can be learned about the outcome of the collision – the crater – using data from other space missions, as for instance the Lunar Reconnaissance Orbiter (LRO). In particular, the LRO camera (LROC [3]) system can provide images in the panchromatic broad filter with a resolution up to 0.5 m (Narrow Angle Cameras / NACs), which can be furtherly combined to derive accurate digital terrain models (DTMs) of specific lunar features. These DTMs could allow the detailed analysis of the morphology of impact craters, and provide both constraints on the surface stratigraphy and ground-truth of numerical models of the formed impact structure [4].
In the framework of the LUMIO mission, our focus is to investigate how the impact mass and velocity, as well as the near-surface target properties can affect the final crater morphology.
Methods. A systematic numerical investigation has been carried out using iSALE shock physics code (https://isale-code.github.io/, e.g., [5, 6, 7, 8]).
For this initial investigation, we simulated projectiles of increasing diameters (1 µm, 1 mm, e 1 m) impacting at 9 km/s on the lunar surface. The target is assumed as an infinite half space, made of a basaltic regolith-like material, with 12% porosity. We varied cohesion from 5 Pa to 0.5 MPa, to evaluate its influence on crater morphology, keeping the friction coefficient constant to a value of 0.6.
Results. In this work, we present the very preliminary results of these numerical simulations. In Figures 1 and 2, we show the case of a 1-m projectile impacting on a target with a 5 Pa and 0.5 MPa cohesion, respectively. In the first case, we obtain a shallower crater where the plastic deformation occurs along in a region surrounding the crater’s wall and floor. Also, the ejecta blanket was made of completely damaged material. In the second case, the crater is bowl-shaped, and its ejecta boulders deposit more dispersedly on the lunar surface. Passing from one extreme to the other of the tested cohesion range, the crater diameter increases up to a factor of three. The depth-to-diameter ratio varies from 0.22 to 0.47.
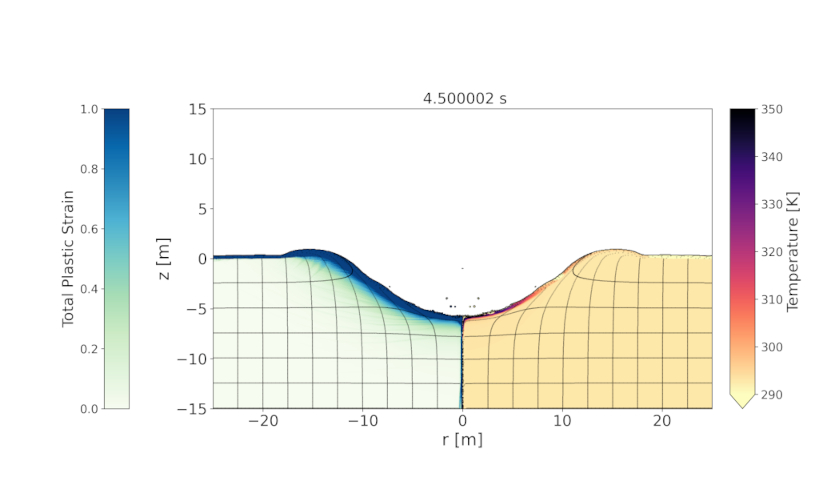
Figure 1. Final time step of a 1 m basaltic projectile impacting at 9 km/s on the surface, with temperature set to 293 K. The left and right panels show the Total Plastic Strain distribution and the temperature variations. Cohesion is set to 5 Pa.
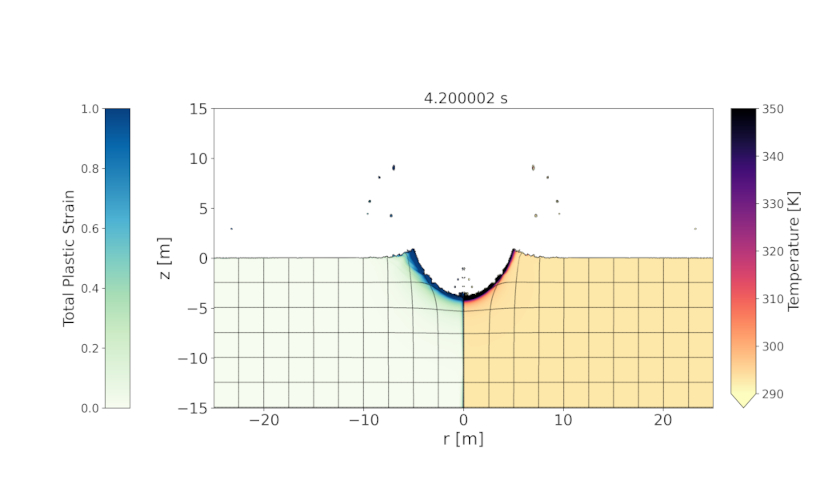
Figure 2. Final step of a simulation run with the same model parameters of Figure 1, except the target cohesion, which was set to 0.5 MPa.
Future work. We are currently running modelling with different values of coefficient of frictions and with multiple layers. Indeed, as shown by [9], the friction coefficient has a considerable influence on the crater efficiency. On the other hand, a layered target is a more realistic representation of planetary terrains (e.g., [10], [11]). We also aim at investigating the ejecta distribution for varying target properties.
Acknowledgements.
We gratefully acknowledge the developers of iSALE‐2D/Dellen version (https://isale-code.github.io/), including Gareth Collins, Kai Wünnemann, Dirk Elbeshausen, Boris Ivanov, and Jay Melosh. Some plots in this work were created with the pySALEPlot tool written by Tom Davison.
This work has been funded by the Italian Space Agency through the agreement n. F43C23000340001 entitled “Supporto scientifico alla missione LUMIO”.
References.
[1] Cipriano et al. (2018) Front Astron Space Sci 5, 29, 23 pp. [2] Topputo et al. (2023) Icarus, 389, 115213. [3] Robinson et al. (2010) Space Sci Rev 150, 81–124. [4] Martellato et al. (2017) Meteorit Planet Sci 52, 1388−1411. [5] Amsden et al. (1980) Los Alamos Nat Lab Rep LA−8095, 101 pp. [6] Collins et al. (2016) iSALE-Dellen manual, figshare. [7] Collins et al. (2004) Meteorit Planet Sci 39, 217−231. [8] Wünnemann et al. (2006) Icarus 180, 514−527. [9] Prieur et al. (2017) J Geophys Res: Planets 122, 1704−1726. [10] Hopkins et al. (2019) J Geophys Res: Planets 124, 349−373. [11] Martellato et al. (2020) J Geophys Res: Planets 125, e2019JE006108.
How to cite: Martellato, E., Luther, R., and Rice, P.: Impacts: exploring the far side of the Lunar surface, EPSC-DPS Joint Meeting 2025, Helsinki, Finland, 7–13 Sep 2025, EPSC-DPS2025-1864, https://doi.org/10.5194/epsc-dps2025-1864, 2025.
Introduction: Understanding the NASA DART impact [1,2], shock physics modeling emerges as a promising approach. Model simulations [3-8] have thus far examined the impact cratering, ejecta plume, and momentum exchange resulting from DART-scale impactors. Those analyses involved factors varying from the surface strength and porosity to impact obliquity, projectile shape, target layering, and boulder distribution. Here, we focus on the role of proximal boulders near the DART impact site, systematically comparing 2D and 3D hypervelocity impact simulations to quantify the effects on the impact outcome for asteroid Dimorphos.
Methods: Representing boulders with a lateral offset results in a torus-shaped geometry in a 2D impact model with axial symmetry (2DC). In this configuration, lateral boulders inherently form a torus swept around the symmetry axis, generating a higher boulder mass per ring compared to the actual 3D case. To compensate for this effect, the porosity of torus-shaped lateral boulders was increased, while spherical central boulders were assigned a fixed porosity of 10% in the 2DC model. The required porosity increase was identified by comparing the masses of torus-shaped boulders in 2DC to those of actual spherical boulders in 3D, adjusting the packing density accordingly. This adjustment increased the effective boulder porosity, determined by a relationship based on the boulder mass and radius [9]. A comparative study is conducted between 2DC and 3D simulations to validate this approach through the iSALE shock physics modeling [10-12]. Regarding the model setup, asteroid, material, and modeling settings follow recent studies using the iSALE model [9, 13]. DART-scale impact simulations are performed on a flat target, assuming a cohesion of 1 Pa, consisting of multiple lateral boulders with a cohesion of 1 MPa. The Lundborg [14] and ROCK [11] strength models are chosen for the regolith target and boulders, respectively. The internal friction of the target material and boulders is assigned to 0.4 and 0.59, respectively. The Johnson-Cook scheme [15] is used for a non-porous aluminum projectile with a diameter set to the size of the spacecraft bus (approximately 1.3 m). The porosity compaction is modeled using the ε-α model [12] with an assigned porosity of 30% for the target material and corresponding settings [6].
Results: Simulations are analyzed up to 2 seconds post-impact, focusing on the ejecta, and resulting momentum enhancement factor, β (Figure 1). Two assemblies of proximal boulders are modeled with volume packing ratios of 𝛾=42% (Figure 1a,c) and 𝛾=51% (Figure 1b,d). The 3D simulations serve as the reference for two sets of 2DC simulations where the lateral boulders are represented as toroidal rings because of axial symmetry. The first set applies a fixed ring boulder porosity of 10%, while the second set adjust the ring boulder porosity to 74.5% for 𝛾=42% (Figure 1e) and 69.4% for 𝛾=51% (Figure 1f), to match the mass per radial ring. In Figure 1e, the second set of 2DC simulations leads to closer agreement with the 3D reference simulations for 𝛾=42%. In the first set, relative β differences were found to be 9-10% for Nb=6, 22, 38 boulders. The mass-conserving second set, in contrast, improved the relative β difference to 4% for Nb=6, 3.6% for Nb=22, and 1.6% for Nb=38. To further verify this trend, an additional boulder scenario with a higher packing ratio (𝛾=51%) was simulated (Figure 1f). In this case, the first set (without boulder mass conservation) led to relative differences of 14.9%, 14.5%, and 4% for Nb=6, 22, 38, respectively. Whereas the mass-conserving second set consistently produced lower relative differences in β compared to reference 3D simulations: 3.4%, 2.0%, and 1.4%, respectively. These findings reveal that applying boulder mass conservation in 2DC simulations significantly improves the impact momentum transfer, especially in cases with abundant proximal boulders, as observed on Dimorphos’ boulder-strewn surface.
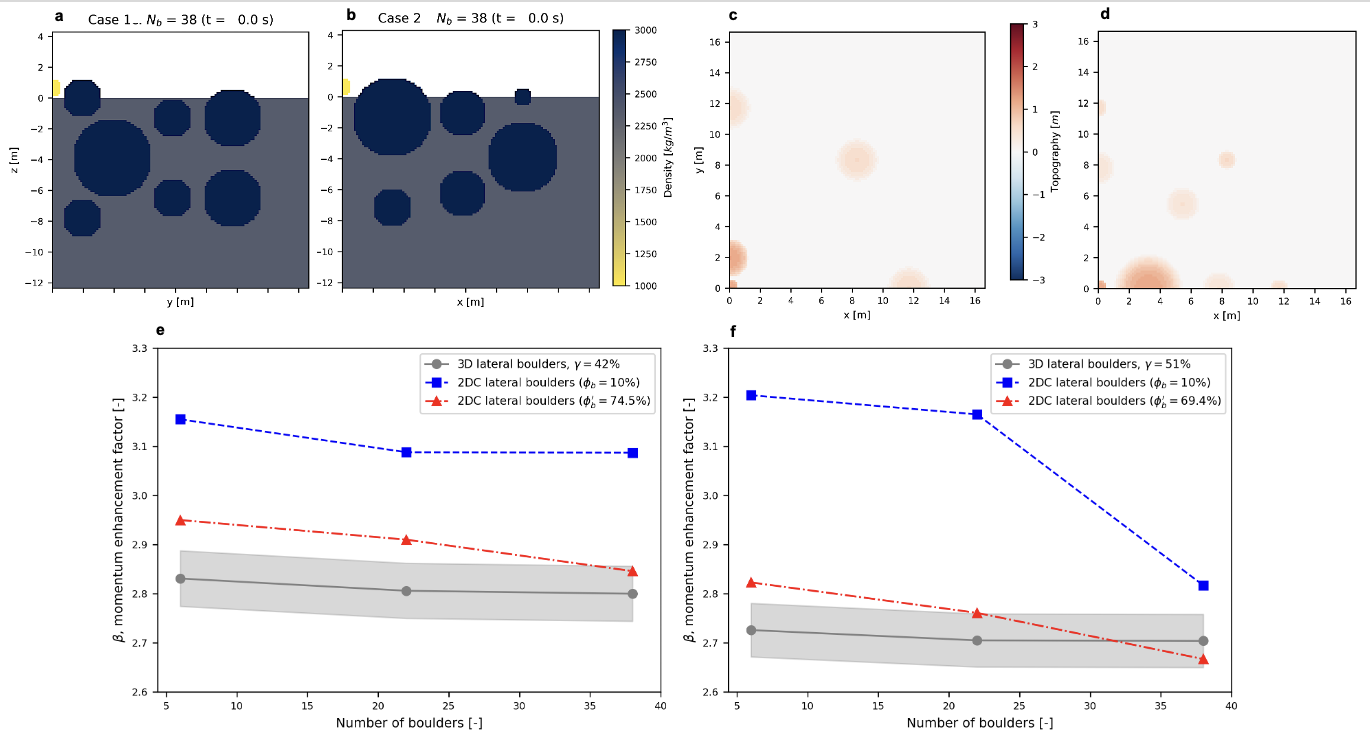
Figure 1: Assembly of lateral boulders near the impact site shown pre-impact from a side view for two volume packing ratios of (a) 𝛾=42%, and (b) 𝛾=51%.
Perspectives and future work: While the distribution of subsurface boulders and the interior of Dimorphos remains currently unknown, a detailed surface characterization of the impact crater by the ESA Hera spacecraft and CubeSats images [16], radar probing of the interior by the JURA instrument [17], and gravity experiment by the Gravimeter for the Investigation of Small Solar System Bodies (GRASS) instrument [18] will provide significant constraints for the numerical models, especially the local subsurface heterogeneities and the global mass of Dimorphos. The next steps will explore further scenarios, including varied boulder distributions with a wider range of volume packing ratios and the effect of surface curvature.
Acknowledgments: This research is financially supported by Research Foundation Flanders (FWO) with grant: 12AM624N to C.B.S. P.C. and S.G. acknowledge the support of the Vrije Universiteit Brussel (VUB) strategic program. O.K. acknowledges the support of EU Horizon 2020 research and innovation program, NEO-MAPP project (grant: 870377), and PRODEX program managed by ESA with the help of BELSPO. R.L. acknowledges the funding from ESA, project S1-PD-08.2. The computational resources and services were provided by the VSC (Vlaams Supercomputer Centrum), funded by the FWO and the Flemish Government. Here, we gladly acknowledge the developers of iSALE shock physics model.
References: [1] Daly et al. (2023). Nature, 616 (7957), 443-447. [2] Thomas et al. (2023). Nature, 616 (7957), 448-451. [3] Bruck-Syal et al. (2016). Icarus, 269:50-61. [4] Stickle et al. (2022). PSJ, 3(11), 248. [5] Owen et al. (2022). PSJ, 3(9),218. [6] Luther et al. (2022). PSJ,3(10),227. [7] Raducan et al. (2024). Nat. Astronomy., 8, 445–455. [8] DeCoster et al. (2024). PSJ, 5(1), 21. [9] Senel et al. (2025). PSJ (in review). [10] Amsden et al. (1980)., LA-8095:101p. [11] Collins et al. (2004). MPS, 39(2), 217-231. [12] Wünnemann et al. (2006). Icarus, 180(2), 514-527. [13] Dai et al. (2024). PSJ, 5, 214. [14] Lundborg (1968). IJRMA, 5, 427. [15] Johnson & Cook (1983), 7th Int. Symp. on Ballistics, 541. [16] Michel et al. (2022). PSJ, 3(7), 160. [17] Herique et al. (2020). EPSC2020-595. [18] Karatekin et al. (2025) Space Science Reviews (submitted).
How to cite: Senel, C. B., Luther, R., Dai, K., Luo, X.-Z., Karatekin, Ö., Collins, G., Goderis, S., DeCoster, M., Davison, T., Raducan, S. D., Zhu, M.-H., Wünnemann, K., and Claeys, P.: Effects of proximal boulders on ejecta and momentum transfer: Comparison of 2D and 3D hypervelocity impact simulations on Asteroid Dimorphos, EPSC-DPS Joint Meeting 2025, Helsinki, Finland, 7–13 Sep 2025, EPSC-DPS2025-1783, https://doi.org/10.5194/epsc-dps2025-1783, 2025.
Introduction:
Impact craters serve as valuable natural probes for investigating the subsurface composition of Mars and other planetary bodies. Large impact events excavate material from deep within the crust, often exposing that material in central uplifts or pits, and were more prevalent during the earlier stages of Mars’ geologic evolution. In contrast, more recent impacts tend to be smaller in scale but can still expose subsurface materials from the uppermost few meters, depending on the size of the event. High-resolution visible observations of ice in the crater rims and ejecta from a subset of such impacts (e.g., Dundas et al., 2021) supported by measurements from instruments like the Mars Odyssey gamma ray/neutron spectrometer (e.g., Boynton et al., 2002; Pathare et al., 2018) and radar (e.g., Mouginot et al., 2010; Putzig et al., 2014), have provided constraints on the distribution and abundance of shallow subsurface water ice. These studies generally indicate the presence of water ice at depths of a few centimeters to meters, primarily restricted to the high- to mid-latitudes, with the most equatorward confirmed ice-bearing crater located at 35.2°N (Posiolova et al., 2022; Dundas et al., 2023), where ice was excavated from depths of ~2-8m (Dundas et al., 2023; Wojcicka et al. 2024).
The High Resolution Imaging Science Experiment (HiRISE) aboard the Mars Reconnaissance Orbiter (McEwen et al., 2007) continues to acquire high-resolution images of small, date-constrained impact craters, including those located equatorward of 35° N/S, often as a follow-up to detections by the Context Camera (CTX; Malin et al., 2007). Some of these impacts also exhibit relatively blue-toned materials within the crater walls or ejecta blankets, although most of these features have not been documented systematically. This work attempts to create a high-resolution inventory of all such equatorial impacts observed by HiRISE, with an aim to help characterize the spectral and morphological properties of the exposed bluish materials and assess their possible compositional origins.
Methods:
The procedure follows a simple manual evaluation of all HiRISE images of recent dated impact craters located between 35°N and 35°S and systematically cataloguing craters with bluish materials within the crater cavity/ejecta into a new database. This effort builds upon existing dated crater compilations, including those by Daubar et al. (2022), ice-exposing impacts documented by Dundas et al. (2021), and possibly seismic event-associated dated impact detections near InSight (Bickel et al., 2025). HiRISE-derived three-point spectra of the bluish exposures are further evaluated using the methodology described in Rangarajan et al. (2024a), which can enable the identification of coarse-grained, relatively pure water ice based on a set of diagnostic spectral parameters - specifically, the (1) BG/RED ratio, and (2) WATER-ICE parameter formulated by the ratio of the mean of the non-IR bands to the I/F in the IR band.
Results and Discussion:
So far, 30 candidate impact craters exhibiting bluish-toned materials have been identified, with this number expected to increase as analysis of the complete HiRISE dataset progresses. Figure 1 presents examples of HiRISE IRB (infrared-red-blue) composite images of such craters.
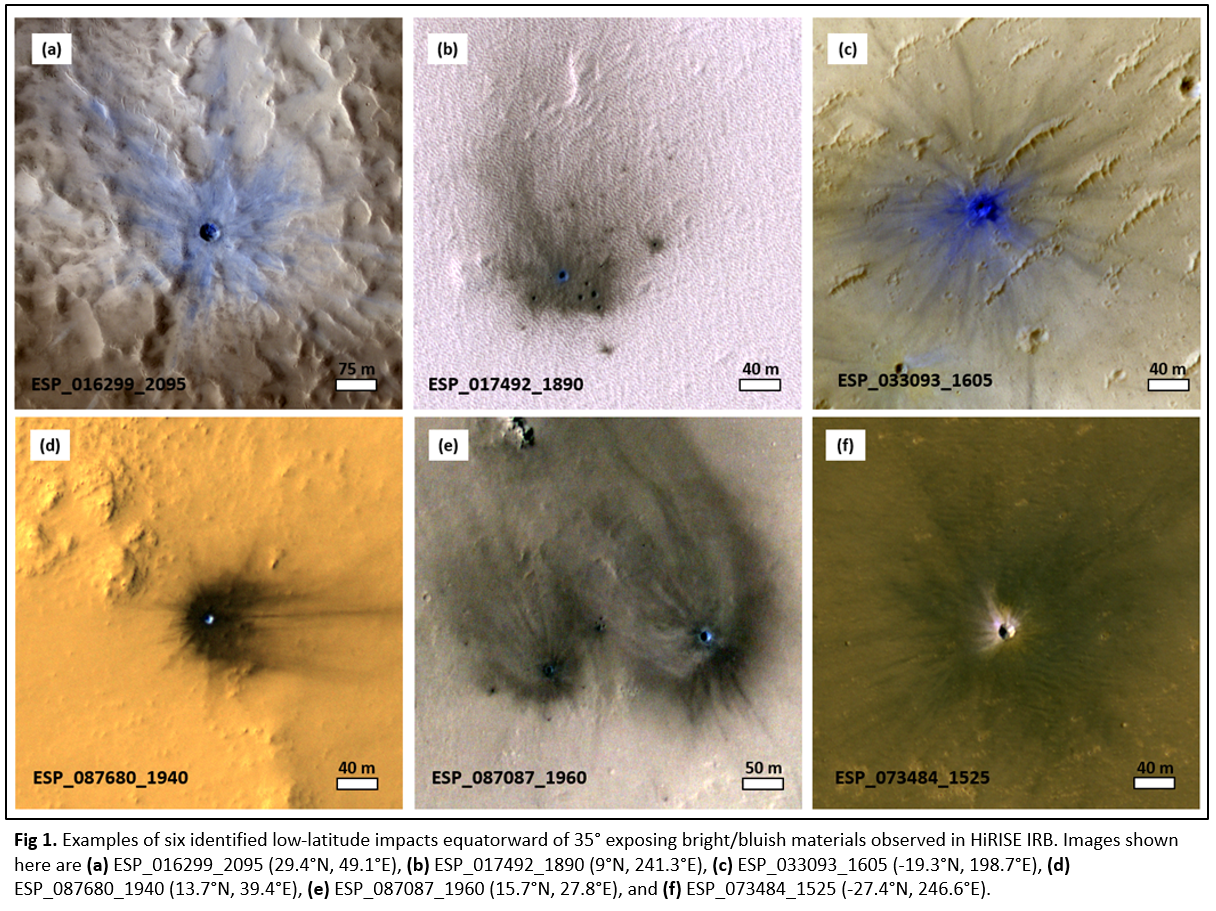
Broadly, two morphological classes are observed: (1) craters with bluish materials distributed across much of the ejecta blanket or in a continuous zone surrounding the crater rim (e.g., Fig. 1a, c) and (2) craters where bluish or bright materials are confined primarily to the interior cavity, sometimes accompanied by a thin, discontinuous halo of diffuse material not fully extending into the ejecta (e.g., Fig. 1d, f). The first category may suggest excavation of mafic-rich subsurface layers, while the second may point to the presence of localized bright ferrous-bearing materials or bright materials of other compositions exposed during impact. Alternatively, some of these materials may also represent post-impact deposition by aeolian processes, though in many cases the observed spectral characteristics, as inferred through the BG/RED and WATER-ICE spectral parameters, suggest that these are less consistent with dusty or pure mafic materials that typically lie completely in the ice-poor spectral zone (see Rangarajan et al., 2024a). One such example of a crater at 13.7°N exposing bright materials is shown in Fig. 2, whose spectral parameters, while not aligned with coarse-grained pure ice materials (i.e., ice-rich zone), are still consistent with some of the dusty ice exposed by confirmed icy impact craters (Dundas et al., 2021). However, such ice would be expected to rapidly sublimate enough to become indistinguishable from regolith (Smith et al., 2009), especially at equatorial latitudes. While similar spectral characteristics may result from other bright minerals, their specific composition still needs to be studied.
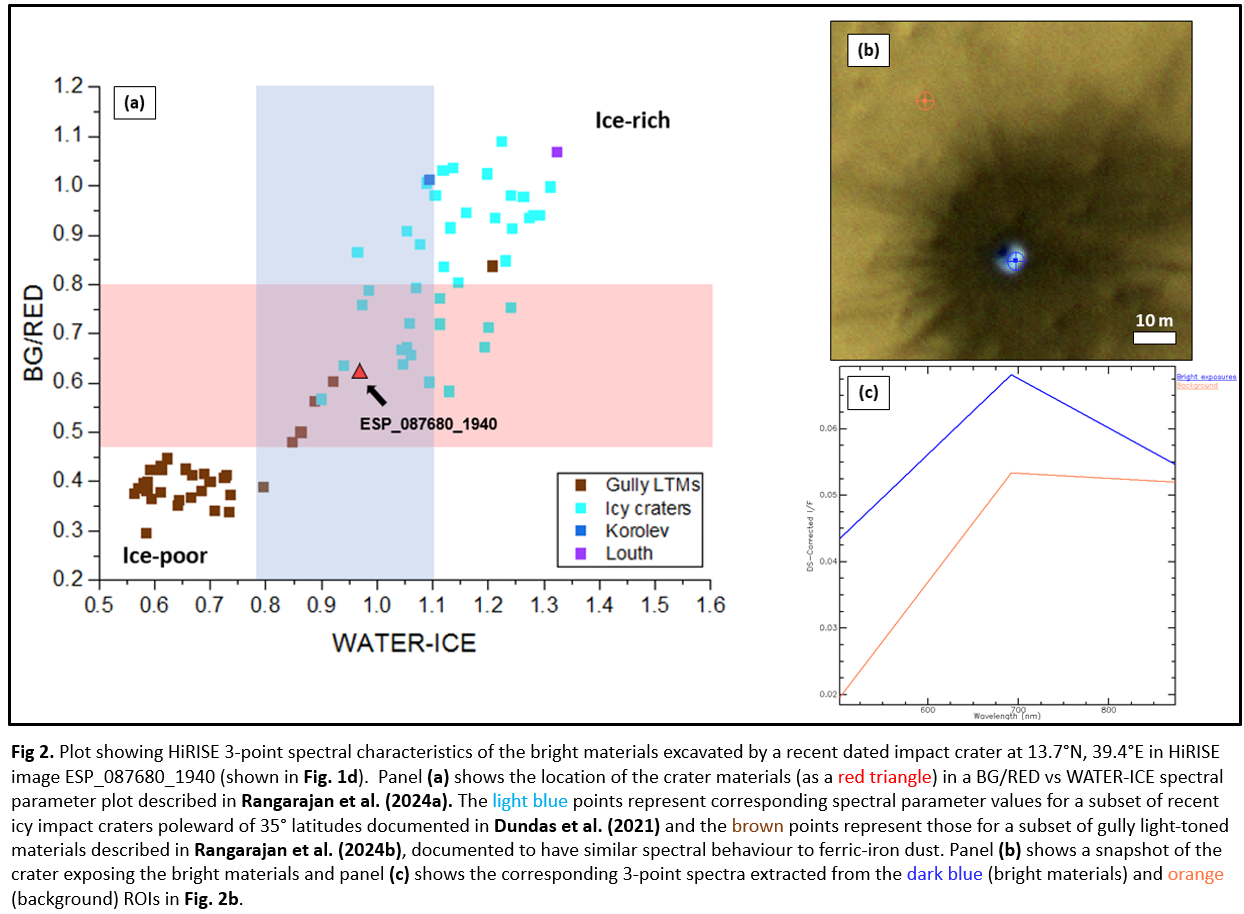
Conclusions:
The detection of some bright spots within low-latitude craters that are not fully consistent with dusty/mafic materials (as in Fig. 2) suggests that further investigation is essential to better understand the variety of minerals present at the equator. We are actively working to complete the database of these craters, and future analyses will also explore whether any spatial distribution patterns emerge among the bluish-toned impacts.
References:
Bickel et al. (2025), GRL 52, 1-10. https://doi.org/10.1029/2024GL109133
Boynton et al. (2002), Science 297, 81-85. https://doi.org/10.1126/science.1073722
Daubar et al. (2022), JGR 127, 1-21. https://doi.org/10.1029/2021JE007145
Dundas et al. (2021), JGR: Planets 126, 1-28. https://doi.org/10.1029/2020JE006617
Dundas et al. (2023), GRL 50, 1-9. https://doi.org/10.1029/2022GL100747
Malin et al. (2007), JGR 112, E05S04. https://doi.org/10.1029/2006JE002808
McEwen et al. (2007), JGR 112, E05S02. https://doi.org/10.1029/2005JE002605
Mouginot et al. (2010), Icarus 210, 612-625. https://doi.org/10.1016/j.icarus.2010.07.003
Pathare et al. (2018), Icarus 301, 97-116. https://doi.org/10.1016/j.icarus.2017.09.031
Posiolova et al. (2022), Science 378, 412-417. https://doi.org/10.1126/science.abq7704
Putzig et al. (2014), JGR 119, 1936-1949. https://doi.org/10.1002/2014JE004646
Rangarajan et al. (2024a), Icarus 419, 115849. https://doi.org/10.1016/j.icarus.2023.115849
Rangarajan et al. (2024b), 10th Intl. Conf. on Mars, Abstract #3224. https://www.hou.usra.edu/meetings/tenthmars2024/pdf/3224.pdf
Smith et al. (2009), Science 325, 58-61. https://doi.org/10.1126/science.1172339
Wojcicka et al. (2024), EPSC 2024, Abstract #771, https://doi.org/10.5194/epsc2024-771
How to cite: Rangarajan, V. G., Dundas, C. M., Daubar, I. J., Bickel, V. T., and Tornabene, L. L.: Observations and systematic documentation of relatively bright/bluish materials within the cavity and ejecta of recent low-latitude impact craters on Mars, EPSC-DPS Joint Meeting 2025, Helsinki, Finland, 7–13 Sep 2025, EPSC-DPS2025-1240, https://doi.org/10.5194/epsc-dps2025-1240, 2025.
Background:
The morphology of impact craters has been used to study the surface and near-surface properties of many bodies throughout the Solar System. Comparative planetological methods have then furthered this to infer specific parameters regarding the sub-surface of planetary targets through comparison of morphological features across both Solar System bodies and to laboratory-scale craters [1,2]. Being ubiquitous throughout the outer Solar System, ice:silicate mixtures have received a high level of interest within laboratory-scale impact studies, with the primary focus being on ice-dominated mixtures (silicate content of <50 wt.%) thought to be present on comets and outer Solar System moons, e.g. [3,4].
The results of these experiments (along with a comparison to outer Solar System morphological features) have then been used to infer the properties of ice bearing bodies across the inner Solar System, in particular Ceres [5,6] and Mars [2,7,8]. Observations, however, have estimated the near-surface ice quantity for these bodies to be far below 50 wt.% [6], placing them well within the silicate-dominated range for ice:silicate mixtures rather than the ice-dominated regime studied by previous experiments. Consequently, this presents a potential source of error in the interpretation of Martian craters due to the misuse of applied assumptions to understand the morphology of craters. The work presented here aims to study the cratering process for silicate-dominated Martian simulant and kiln-dried sand mixtures, thereby better constraining the influence of ice on cratering processes in such inner Solar System targets.
Methodology:
Impacted targets were formed of ice:silicate mixtures containing either a 50 wt.% or 80 wt.% silicate content. Targets (Figure 1) were constructed from a mixture of crushed ice with either JSC Mars-1 Martian simulant (Figure 2) [9] or a typical commercial kiln-dried sand (KDS) (Figure 3) for 50 wt.% targets only. Constructed targets measured 20 cm in diameter and 9 cm in depth. Once frozen, targets were impacted by 1.5 mm spherical copper projectiles over the velocity range of 2-5 km/s using the light-gas gun at the University of Kent impact laboratory [10]. Following the impact, depth profiles of the crater were taken across each target in orthogonal directions allowing measurement of depth and diameter. Profiles across the crater additionally provided a means for morphological comparisons to be made between the silicate types (JSC Mars-1 and KDS) and ice quantities (50 wt.% and 80 wt.%).

Figure 1: Example pre-impact JSC Mars-1 target mounted to the Kent light-gas gun. The target diameter was 20 cm.
Results and Discussion:
Crater parameters (e.g. depth, diameter, etc.) were analysed versus the energy of the impactor, allowing comparisons to be made for varying projectile materials. The results show that variations in crater parameters were seen when altering both the quantity of ice and the type of silicate within the target. Analysis of the two silicate materials themselves shows that they possess highly different morphologies, with the JSC Mars-1 having much more irregular (in both size and shape) grains when compared to the KDS (Figures 2 and 3). This variation is thought to be the likely cause for the observed variation in crater diameter due to the induced changes in internal friction and responses to shock processing. A variation in crater depth was only seen, however, between targets of differing ice quantities. This indicates that the crater depth was somewhat influenced by the target properties, but that changes were less pronounced than for the crater diameter.

Figure 2: Optical microscopy image of the JSC Mars-1 simulant.

Figure 3: Optical microscopy image of the Kiln-dried sand.
Analysis of the interior crater morphology shows further differences between both silicate types and the ice quantity. Figure 4 compares craters morphologies for targets containing a different silicate type when impacted at various speeds. All targets contained the same 50:50 wt.% ice:silicate ratio. As the impact speed increases, variations in the morphology become substantially more pronounced. The same trend is seen when considering craters formed in targets of a differing silicate quantity.
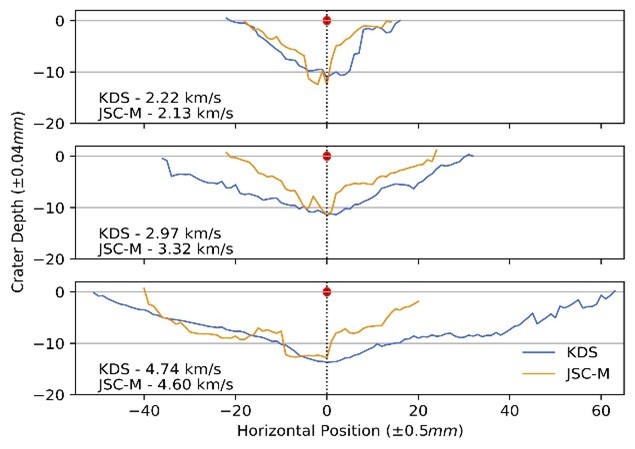
Figure 4: Comparisons at varying impact speeds between craters formed in JSC Mars-1 and standard sand targets containing a 50 wt.% quantity of silicate material.
Conclusions:
Overall, whilst past investigations have shown that crater parameters change with increasing silicate quantity within a target, the results of this investigation show that initial trends assumed from previous studies may not hold as the silicate quantity increases above the 50 wt.% limit. Hence, the continuing investigation of these processes is likely to further understanding of processes occurring on the Martian surface.
References:
[1] C.M. Ernst, et al., J. Geophys. Res. Planets 123, 2628 (2018).
[2] N.G. Barlow, et al., Meteorit. Planet. Sci. 52, 1371 (2017).
[3] D. Koschny, E. Grun, Icarus 154, 391 (2001).
[4] K. Hiraoka, et al., Adv. in Space Res. 39, 392 (2007)
[5] P. Schenk, et al., Icarus 320, 159 (2019).
[6] H.G. Sizemore, et al., J. Geophys. Res. Planets 124, 1650 (2019).
[7] G. de Villers, et al., Meteorit. Planet. Sci. 54, 947 (2010).
[8] P.J. Mouginis-Mark, Meteorit Planet. Sci. 50, 51 (2015).
[9] C.C. Allen, et al., EOS Trans. AGU 79, 405 (1998).
[10] R. Hibbert, et al., Procedia Enginering 204, 208 (2017).
How to cite: Finch, J. E., Wozniakiewicz, P., Tandy, J., Burchell, M., Sefton-Nash, E., Alesbrook, L., Koschny, D., Avdellidou, C., and Spathis, V.: Experimental ice:silicate craters and their application to Mars, EPSC-DPS Joint Meeting 2025, Helsinki, Finland, 7–13 Sep 2025, EPSC-DPS2025-1580, https://doi.org/10.5194/epsc-dps2025-1580, 2025.
Water ice plays a fundamental role in the geological history of Mars, making the planet a primary target for supporting human activities and the search for life. Its distribution is a key constraint for the interpretation of the paleo-martian climate, while the amount of sub-surface ice (in terms of pore filling towards excess ice) provides essential information about deposition processes [1] [2].
Although surface water ice is easy to observe, detecting and studying underground ice is much more challenging. In this context, impact craters become a valuable tool for investigating deeper surface layers. Their morphology reflects the mechanical properties of the target material and can reveal variations in density, strength, water content, porosity, and composition.
Craters formed in ice-rich substrates tend to exhibit lower depth/diameter (d/D) ratios than those formed in dry regolith. This feature is attributed to the different resistance between ice and rock, as well as post-formative processes such as viscous relaxation and slumping [3]. A lower d/D ratio is particularly evident in small craters, which are more sensitive to the local properties of the substrate [6].
In addition, recent numerical modelling studies [5] showed that the formation of double terraces in craters of Arcadia Planitia can be explained by the presence of relatively pure ice layers with different cohesion and porosity. These observations suggest a possible ice stratification and offer new perspectives on the past Martian climate.
The goal of this study is to extend the analysis of the terraced craters catalog published by Bramson et al. [2], focused on the area of Arcadia Planitia (Figure 1). The database includes 187 craters, with diameters ranging from 125 meters to 2 kilometers. Among these, 62 have a single well-defined terrace, 35 show two distinct terraces, while the remaining 90 were classified as uncertain due to the presence of poorly distinguishable or difficult to interpret terraced morphologies.
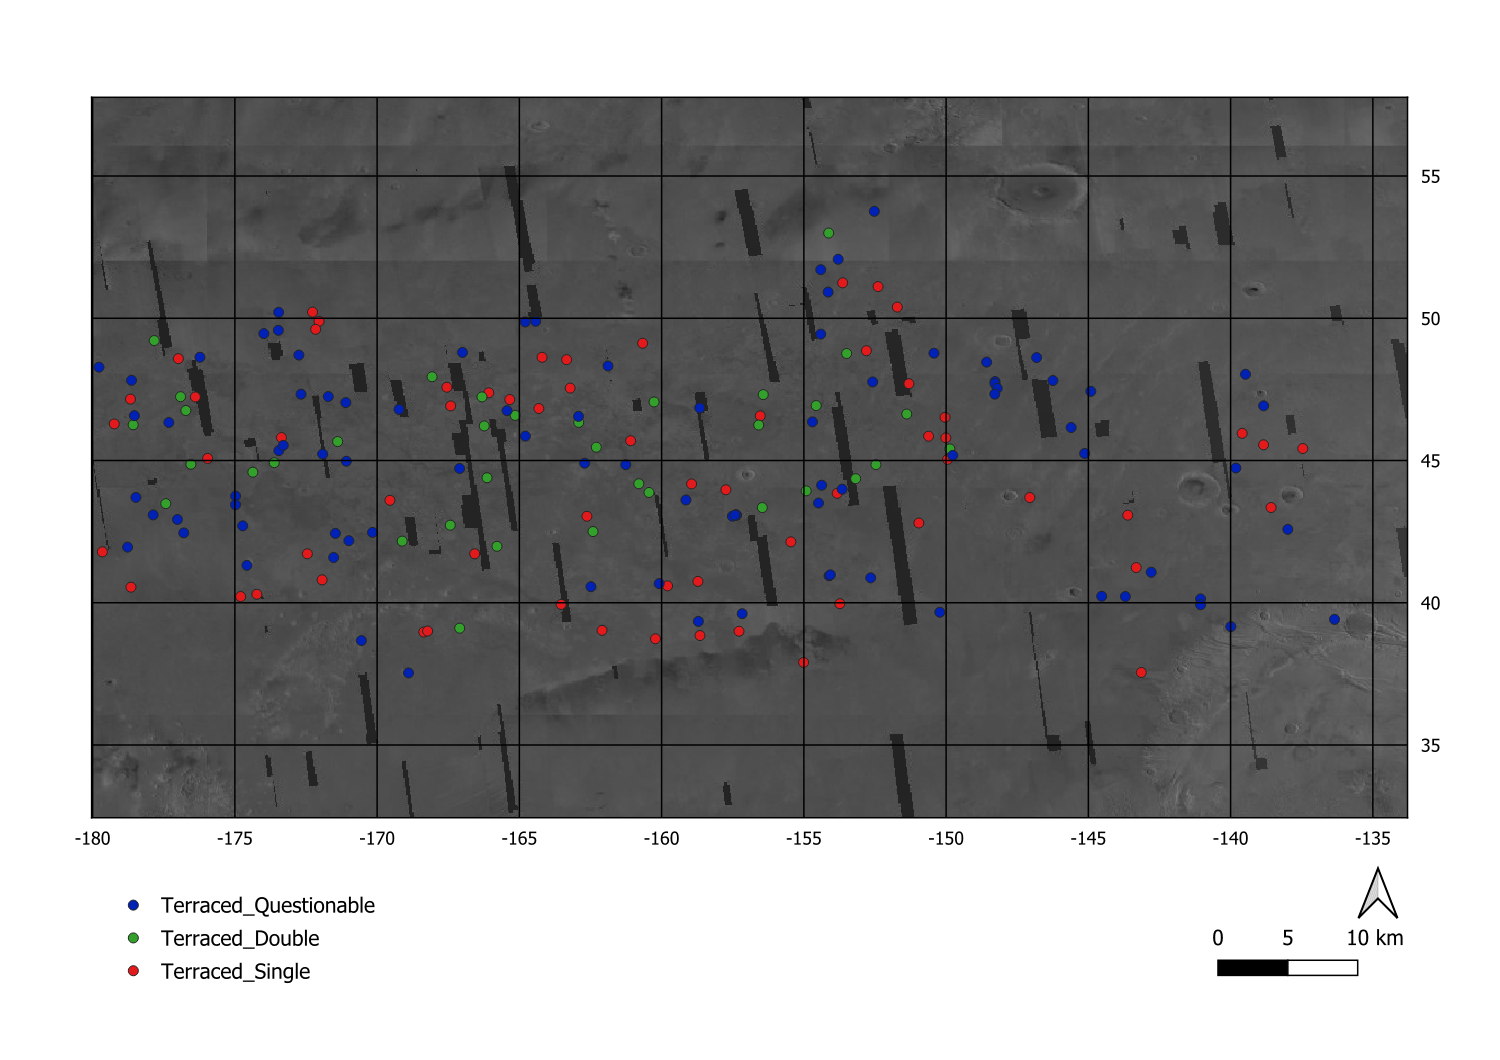
Figure 1: Spatial distribution of terraced craters in Arcadia Planitia.
The analysis was carried out using the open-source QGIS software, integrated with custom Python scripts. Based on the previous work [2], a detailed morphometric analysis was conducted using 14 high-resolution Digital Terrain Models (DTMs) from the HiRISE archive [4]. Among these, 10 had already been used in the original study, while 4 were added in the present work. Using the QGIS "Profile Tool", the elevation profiles of craters were analyzed, allowing the measurement of the depth of terraces, dip, and slope between different levels. The results obtained confirm and extend what has already been reported in the literature [2].
In a second step, an additional analysis was carried out, in which 20 radial profiles were extracted from each HiRISE DTM to calculate the crater d/D ratio and its associated uncertainties. The craters analyzed are located in the region of Arcadia Planitia, between longitudes 180°E and 225°E. For comparative purposes, a sample of 16 simple craters in the same longitudinal band was selected. The results were displayed in a three-dimensional plot d/D versus longitude and latitude (Figure 2).
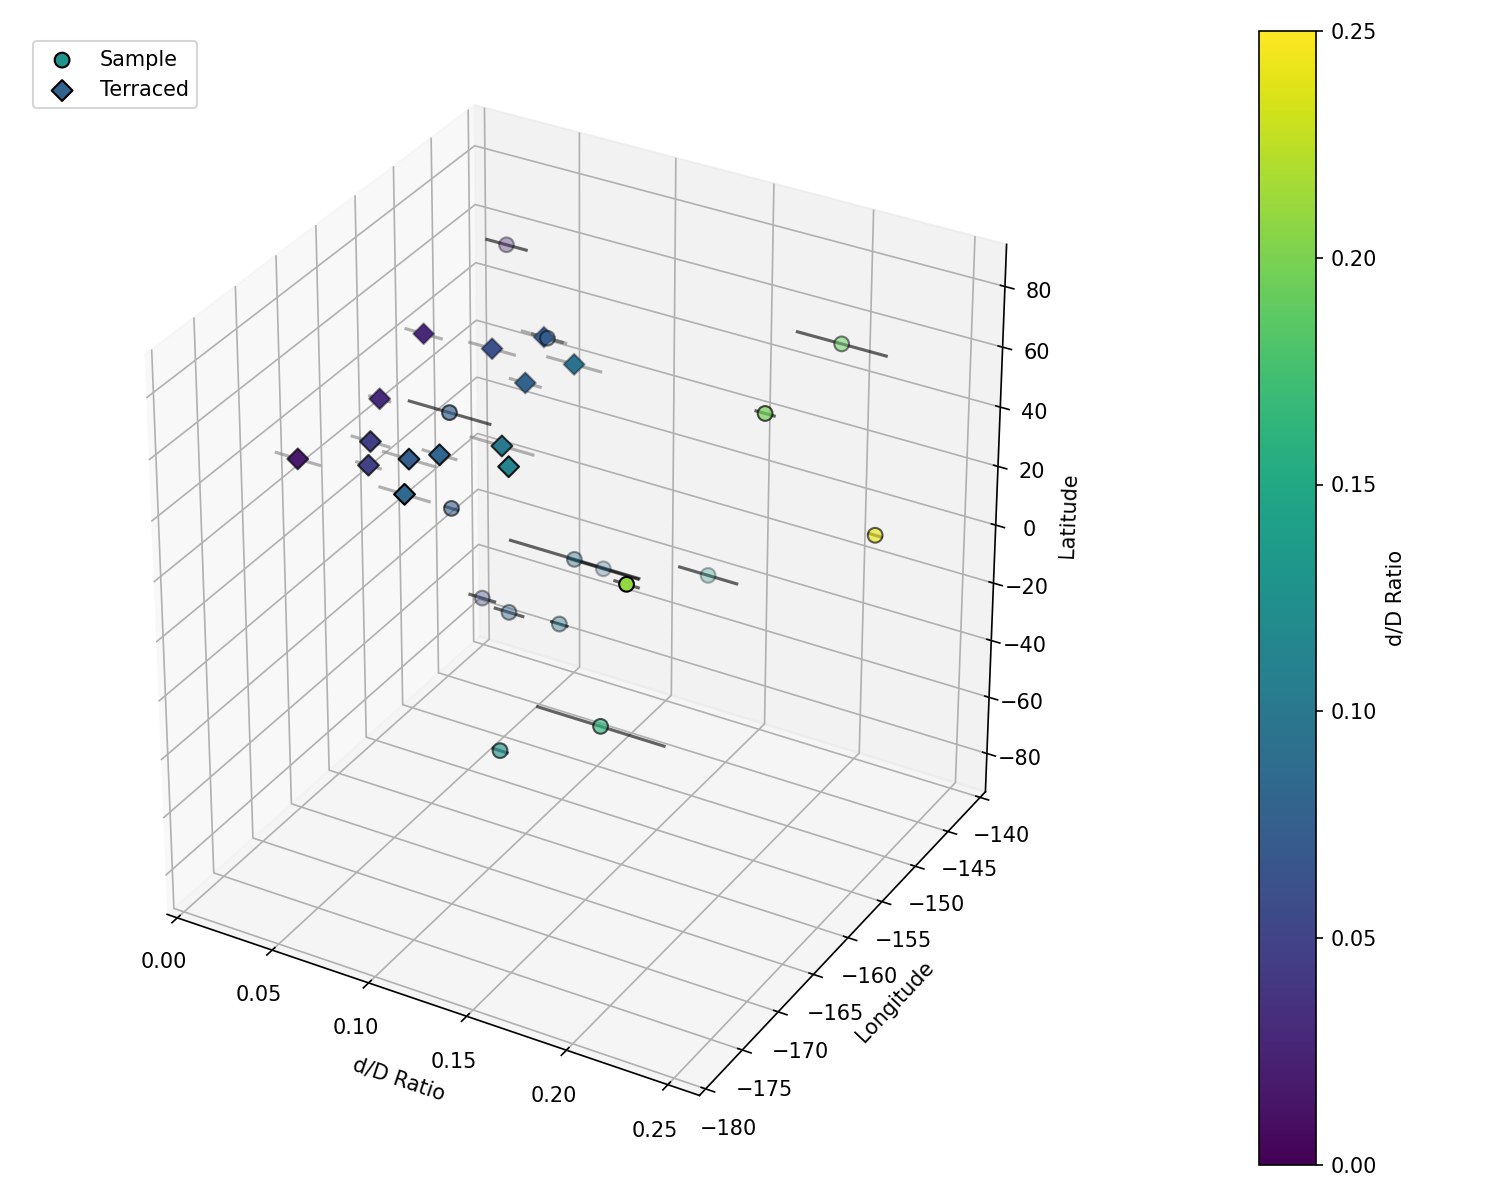
Figure 2: Three-dimensional distribution of the crater dataset as a function of d/D ratio, longitude, and latitude. Circles represent simple craters, rhombuses terraced ones. Marker color shows the d/D ratio, as indicated by the colorbar. Horizontal lines show d/D measurement error bars.
Referring to this plot, the analysis of the d/D ratio shows systematically lower values in terraced craters (rhombuses) than simple ones (circles), supporting the hypothesis that the presence of ice in the substrate reduces the resistance of the target material at the time of impact. The different gradients and
elevation variations observed within the terraces could provide further indications on the mechanical and stratigraphic properties of the subsurface, supporting the hypothesis of stratified deposits of relatively pure ice in Arcadia Planitia.
In conclusion, the results obtained seem to confirm that the presence of ice in the subsoil at the moment of impact may cause the formation of shallower craters, characterized by lower d/D ratios than those developed in ice-free substrates. Furthermore, the internal morphology of craters, in particular the presence, number and arrangement of terraces, shows a significant variability, potentially related to the stratified structure and composition of the subsoil.
It is currently planned to generate additional terraced crater DTMs located in the same area, using stereoscopic pairs of HiRISE images available from the public archive. In parallel, new DTMs will be produced using stereo pairs acquired from the CaSSIS imaging system [7]. Expanding the dataset will enable further refinement of the analysis and help verify the robustness of the results obtained so far.
Acknowledgments
This work has been developed under the ASI-INAF agreement n. 2024-40-HH.0
References
[1] Ali M Bramson, Shane Byrne, Nathaniel E Putzig, Sarah Sutton, Jeffrey J Plaut, T Charles Brothers, and John W Holt. Widespread excess ice in arcadia planitia, mars. Geophysical Research Letters, 42(16):6566–6574, 2015.
[2] AM Bramson, Shane Byrne, and J Bapst. Preservation of midlatitude ice sheets on mars. Journal of Geophysical Research: Planets, 122(11):2250–2266, 2017.
[3] B. S. Douglass and J. F. Bell III. Using impact crater depth/diameter ratios to search for evidence of subsurface ice on mars, 2025. 56th LPSC.
[4] HiRISE Team. Dtm map browser, 2025. University of Arizona, Lunar and Planetary Laboratory.
[5] E Martellato, AM Bramson, G Cremonese, A Lucchetti, F Marzari, M Massironi, C Re, and S Byrne. Martian ice revealed by modeling of simple terraced crater formation. Journal of Geophysical Research: Planets, 125(10):e2019JE006108, 2020.
[6] Stuart J Robbins and Brian M Hynek. A new global database of mars impact craters≥ 1 km: 2.global crater properties and regional variations of the simple-to-complex transition diameter. Journal of Geophysical Research: Planets, 117(E6), 2012.
[7] N Thomas, G Cremonese, R Ziethe, M Gerber, M Brndli, G Bruno, M Erismann, L Gambicorti, T Gerber, K Ghose, et al. snd markiewicz. W., Massironi, M., McEwen, A., Okubo, C., Tornabene, L., Wajer, P., and Wray, J, page 18971944, 2017.
How to cite: Faletti, M., Cremonese, G., Martellato, E., Tullo, A., Bertoli, S., Munaretto, G., Marzari, F., and Zinzi, A.: Analysis of terraced craters in Arcadia Planitia, EPSC-DPS Joint Meeting 2025, Helsinki, Finland, 7–13 Sep 2025, EPSC-DPS2025-729, https://doi.org/10.5194/epsc-dps2025-729, 2025.
Introduction:
Impact basins on terrestrial planets are the result of the intense and widespread impact events that affected the planetary bodies, usually recognized and studied through satellite images, topographic and gravity data.
Peak-ring and multi-ring basins have been deeply investigated in the last decades. While peak-ring basins are characterized by a rim crest and an interior peak ring, multi-ring basins are larger and characterized by additional concentric topographic rings (e.g., [1]).
Un updated catalog of such impact basins on the Moon was already provided by Neumann et al. [2]. They analyzed GRAIL data to show that large lunar basins are characterized by a central gravitational anomaly. The size of this gravitational anomaly is comparable to the diameter of the inner peak-ring of a basin, while the main ring is approximatively twice the diameter of the peak ring [2]. This work confirmed the existence of previously proposed basins, provided the size of inner ring and main rim structures, and allowed detecting new basins that were not yet identified.
For Mars, complete catalogs of the Martian impact basins were provided before the GRAIL mission (e.g., [3], [4], [5]). Later, un updated catalog of peak-ring basins and protobasins was then provided by [6]. However, Mars should be characterized by many more basins than observed (e.g., [7]), and previous databases suffered from difficulty of detection as a result of Martian sedimentary and erosive processes.
In our work we first develop a new approach to estimate the inner ring and rim crest sizes, based on the analysis of lunar gravity and crustal thickness data ([8], [9]), expanding upon the work of [2]. From this analysis, we also quantify how lower resolution gravity and crustal thickness datasets might bias the peak ring and main rim diameter estimates. Then, we present the first results obtained for Mars impact basins, working on the GMM-3 gravity [10] and crustal thickness data calculated after the Insight mission [11].
Methods:
In our approach, we first quantify the regional value of the Bouguer gravity anomaly and crustal thickness, which is defined as the average value obtained from azimuthally averaged profiles in the radius range 1.5 D to 2 D, where D is the crater diameter. The diameter of the Bouguer gravity high, as well as the diameter of the crustal thickness anomaly, were then estimated as the radius where the profiles first intersect the background regional values.
We tested this method using Bouguer gravity data for certain lunar peak-ring and multi-ring basins (see Table 1, e.g., [2]), by considering the spherical harmonic degree range from 6 to 540 (e.g., [2]). We then filtered the data using the spherical harmonic degree range 6-49 in order to simulate the lower resolution of the Mars gravity models. We then used the same approach using crustal thickness maps derived after GRAIL, both for the degree ranges 6-310 and 6-46, to simulate the loss of spatial resolution of Mars. Uncertainty estimates were obtained for the crustal thickness and the Bouguer anomaly diameter by considering the ±1σ values for the background values in the spatial range of 1.5D to 2D.
The same approach was used for eight Martian certain impact basins (see Table 2), based on the most updated catalogs ([5], [6]), including Antoniadi, Schiaparelli, Huygens, Cassini and four unnamed basins.
Table 1. Certain lunar impact basins (from database of [2]) considered in this work.
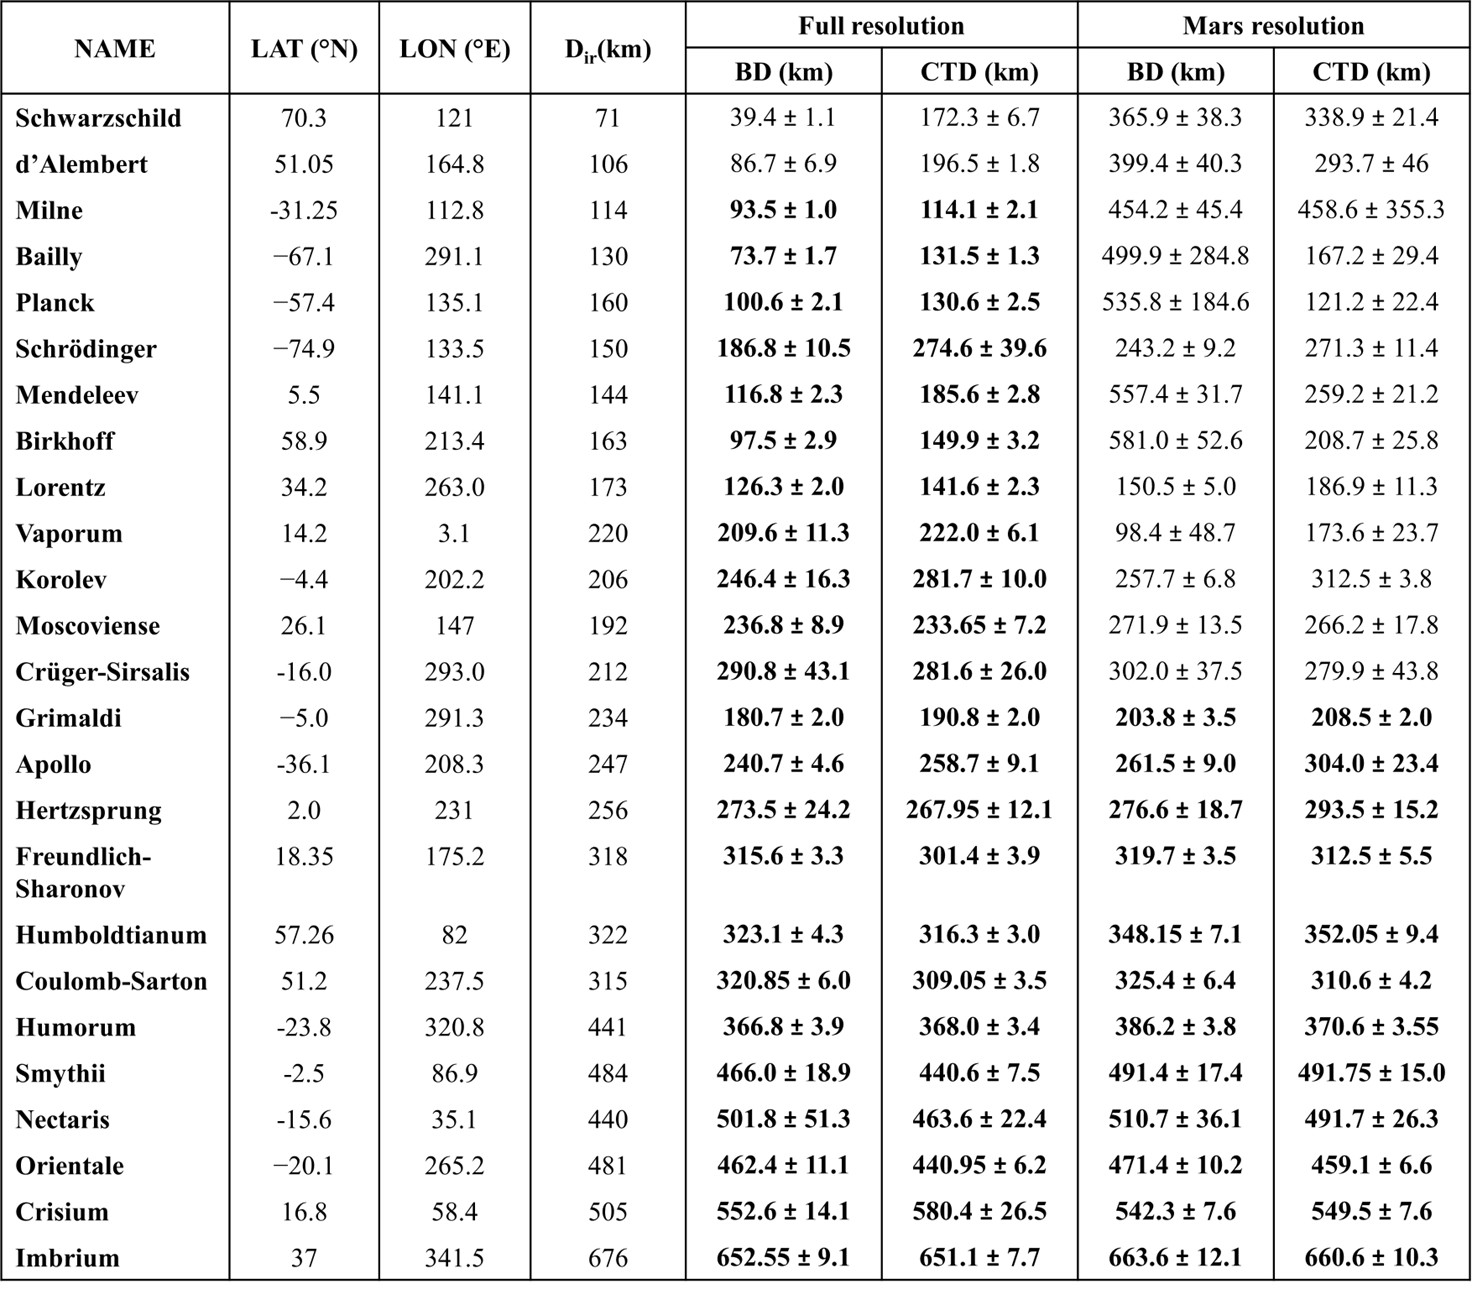
Dir: Inner ring diameter
BD: Bouguer diameter
CTD: Crustal thinning diameter
Table 2. Certain Martian impact basins considered in this work.
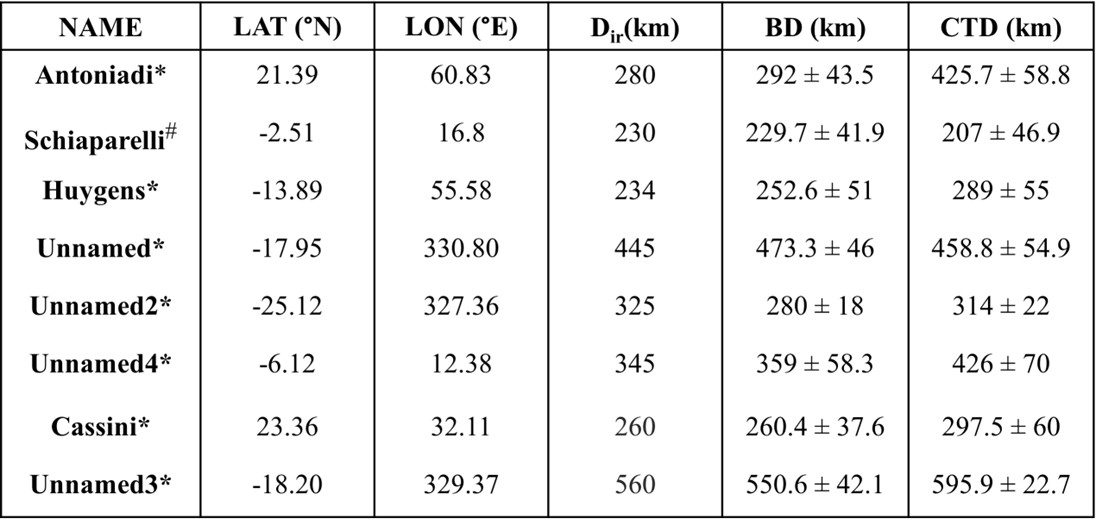
*[5] catalog; #[6] catalog
Conclusions and future work:
When considering the highest spatial resolution of the Bouguer gravity data and crustal thickness maps, our method properly detects peak-ring or inner ring sizes for lunar basins with main rim diameter greater than 250 km (i.e., for inner ring diameters greater than about 110 km). Nevertheless, when considering filtered versions of these datasets that correspond to the effective spatial resolution of the Mars gravity models, only basins with rim crest diameters greater than about 450 km can be detected with acceptable accuracy. Regardless, these results confirm a one-to-one relationship between the Bouguer anomaly diameter and the inner peak-ring diameter of lunar basins, as well as between crustal thinning size and peak-ring size (Fig. 1).
Results on Martian gravity data (Fig. 2) for eight selected certain peak-ring and multi-ring basins (e.g., [5],[6]) again confirm a 1:1 relationship between Bouguer anomaly diameter and the inner peak-ring diameter. Similar results were obtained when considering crustal thickness data.
We plan to apply this technique to first re-update the impact basins catalogs for the Moon and Mars, to obtain consistent database of basin sizes, and then Mercury, in view of the upcoming ESA-JAXA BepiColombo observations. We will also assess the use and advantage of gravity gradients and gravity tensor eigenvalues to determine Bouguer gravity size. Finally, these results will be useful to constrain the impact bombardment estimates of the early solar system.
Figure 1. Bouguer anomaly diameter (top) and crustal thinning diameter (bottom) versus peak-ring or inner-ring diameter (km) for certain lunar peak-ring and multi-ring basins (see Table 1, e.g., [2]). Red dashed lines indicate a 1:1 ratio.
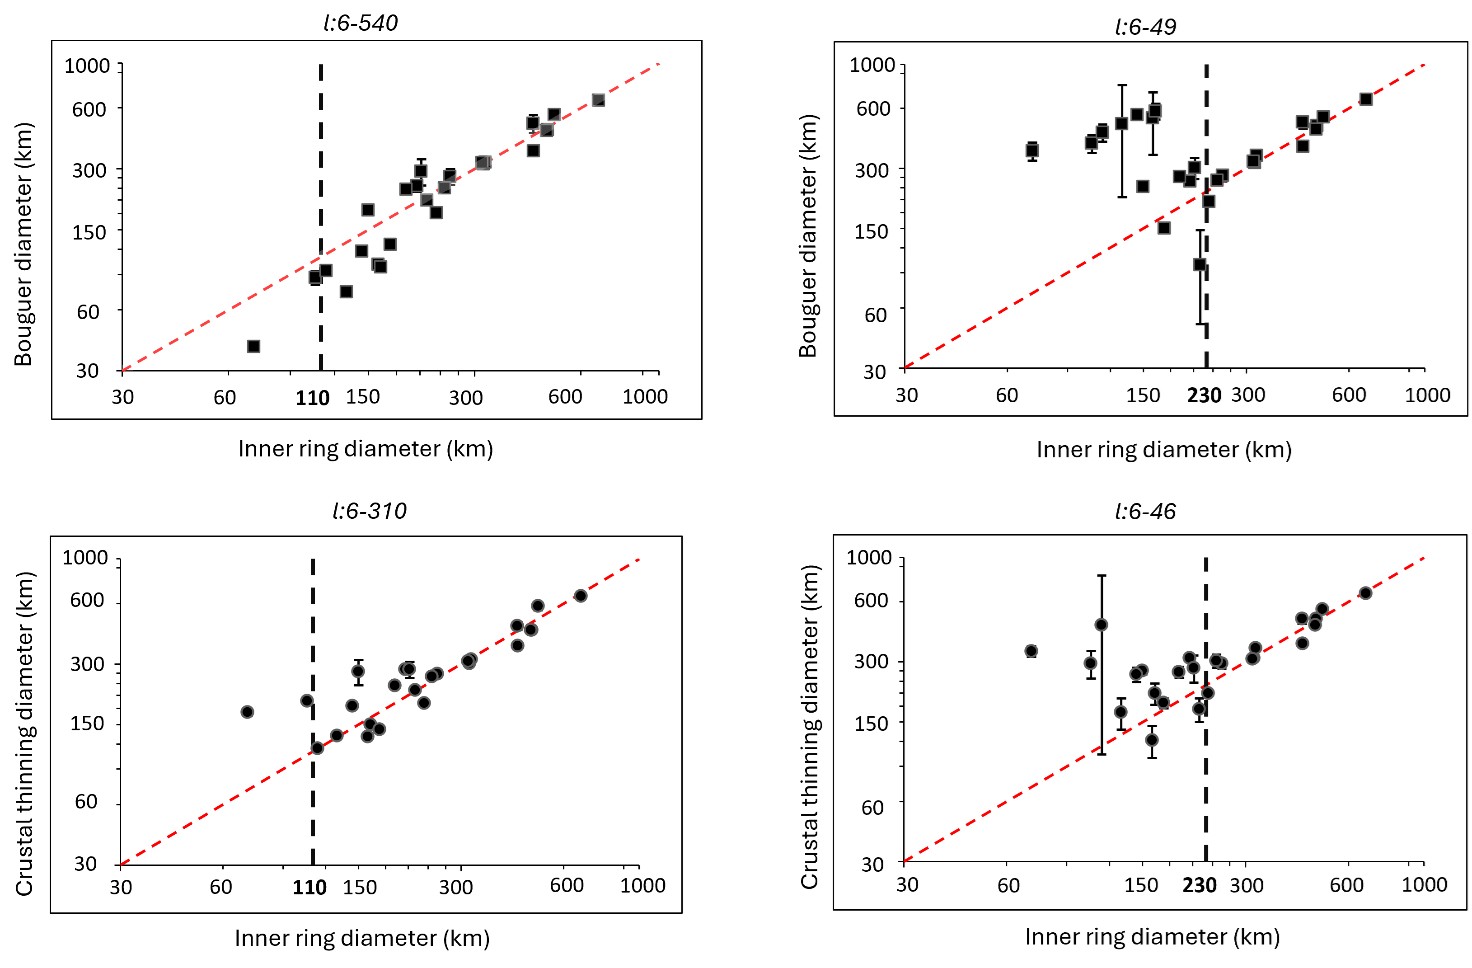
Figure 2. Bouguer anomaly diameter (top) and crustal thinning diameter (bottom) versus peak-ring or inner-ring diameter (km) for certain Martian impact basins (see Table 2, e.g., [5], [6]). Red dashed lines indicate a 1:1 ratio.
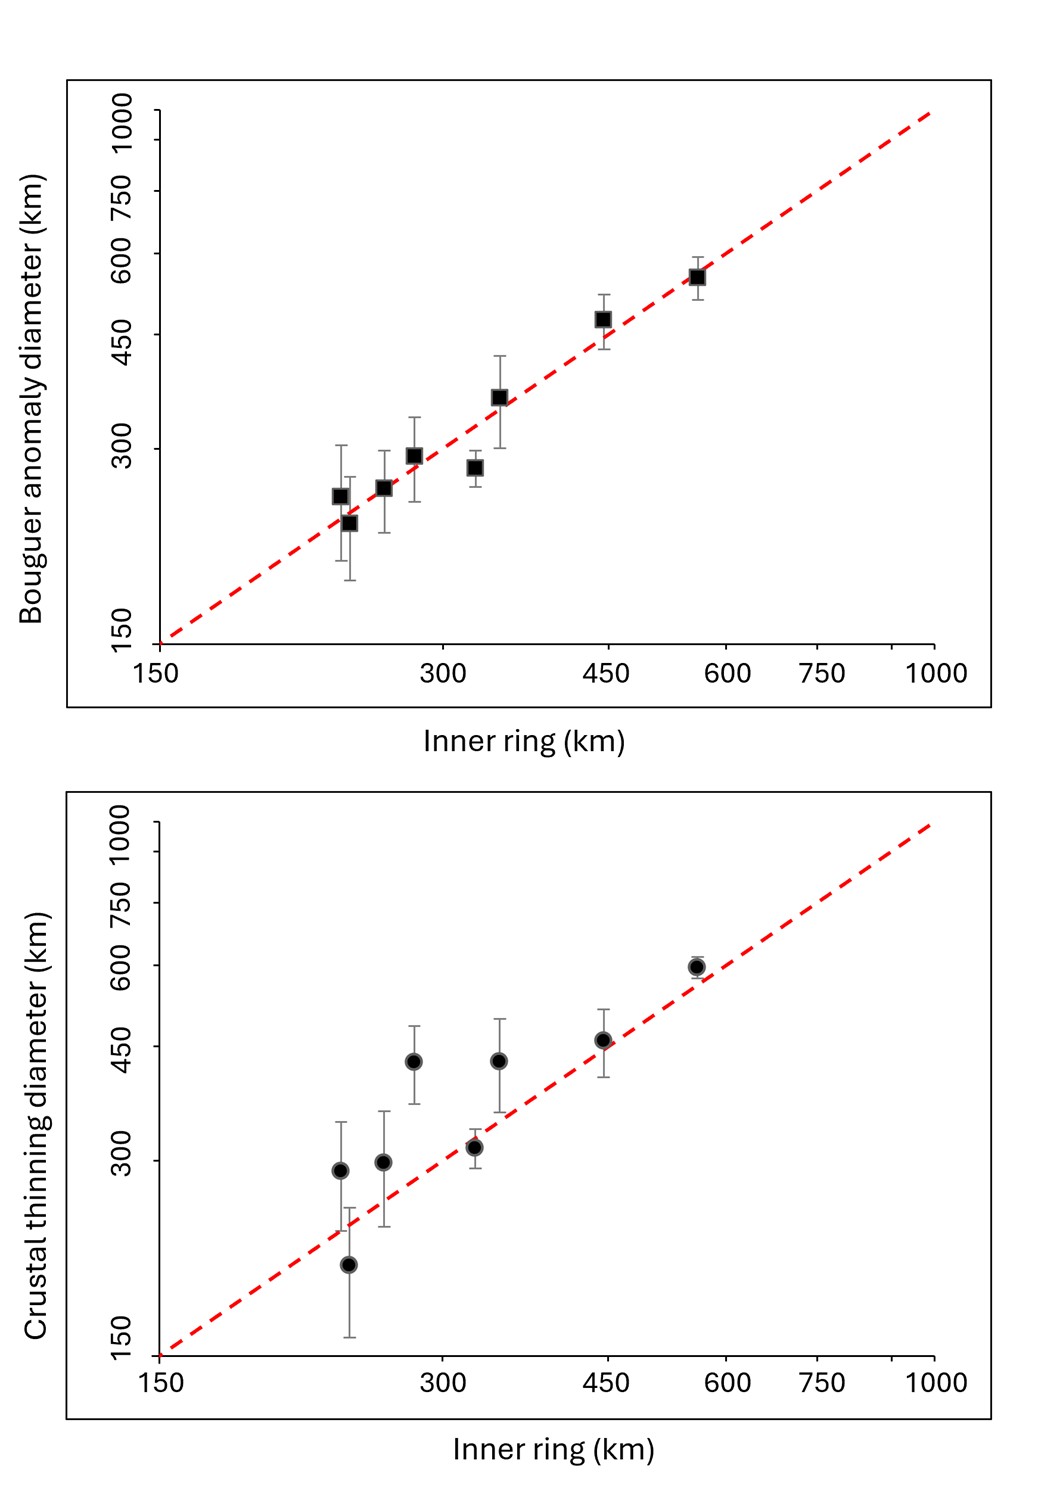
References:
[1] Baker D. M. H., et al. (2011). Planet. Space Sci.
[2] Neumann G. A., et al. (2015). Sci. Adv.
[3] Frey H. V. (2008). Geophys. Res. Lett.
[4] Edgar L. A. & Frey H. V. (2008). Geophys. Res. Lett.
[5] Robbins S. J. & Hynek B. M. (2012). JGR: Planets.
[6] Baker D. M. (2016). In Lunar Planet. Sci. Conf. XLVII.
[7] Robbins S. J. (2022). Planet. Sci. J.
[8] Goossens S. (2020). JGR: Planets.
[9] Wieczorek M. A., et al. (2013). Science.
[10] Genova A., et al. (2016). Icarus.
[11] Wieczorek M. A., et al. (2022). JGR: Planets.
Acknowledgements: We gratefully acknowledge funding from the Italian Space Agency (ASI) under ASI-INAF agreement 2024-18-HH.0.
How to cite: Buoninfante, S., Wieczorek, M. A., Galluzzi, V., Milano, M., Ferranti, L., Sepe, A., Fedi, M., and Palumbo, P.: A new geophysical approach to calculate the size of impact basins on the Moon and Mars, EPSC-DPS Joint Meeting 2025, Helsinki, Finland, 7–13 Sep 2025, EPSC-DPS2025-1563, https://doi.org/10.5194/epsc-dps2025-1563, 2025.
Introduction:
Jules Verne is one of the prominent craters of the lunar farside. Its diameter is around 150 km and it is centered at 35°S, 147°E, just south of Gagarin crater and west of Mare Ingenii. Its age is estimated to be 4.21 Ga. [1], but it was involved in multiple volcanic events which reshaped its floor by filling it with basaltic mare-like material. This caused a resurfacing of the crater floor, accompanied by the formation of fractures, cracks and scarps [2,3]. Jules Verne crater shows a slightly irregular rim interrupted by multiple large superposed craters and a relatively shallow depth. It is also characterized by an extensive lobate scarps region which extends for tens of kilometers from the rim toward the floor. Recognizing various types of crater floor materials and volcanic features such as open cracks and pyroclastic deposits is essential for reconstructing the sequence of impact-related processes. Hence, to foster further study of this crater, we have prepared a high-resolution geologic map (scale 1:250.000) of the Jules Verne crater interior considering both geomorphological and spectral information.
Datasets and Methods:
To analyze the Jules Verne crater we exploited both morphological and multispectral data. As morphological data we used LROC-NAC (0.5 m/px) and WAC (100 m/px, Fig. 1A) [4] images coupled with the topographic data derived from the LOLA [5] and Kaguya [6] merged DEM (59 m/px).
For the multispectral analysis, we relied extensively on Clementine mosaic UVVIS Warped Color Ratio Mosaic [7]. This is traditionally displayed as an RGB false color composition with the following band ratios: Red = 750/415 nm; Green = 750/1000 nm; and Blue = 415/750 nm (Fig. 1B). We also used spectral maps derived from the Kaguya Lunar Multiband Imager [8], which display the percentage content of FeO (Fig. 1C), plagioclase (Fig. 1D), olivine (Fig. 1D), and orthopyroxene (Fig. 1E). The mapping has been conducted following established methodologies [10,11] and considering also the previous studies [1,2,3].
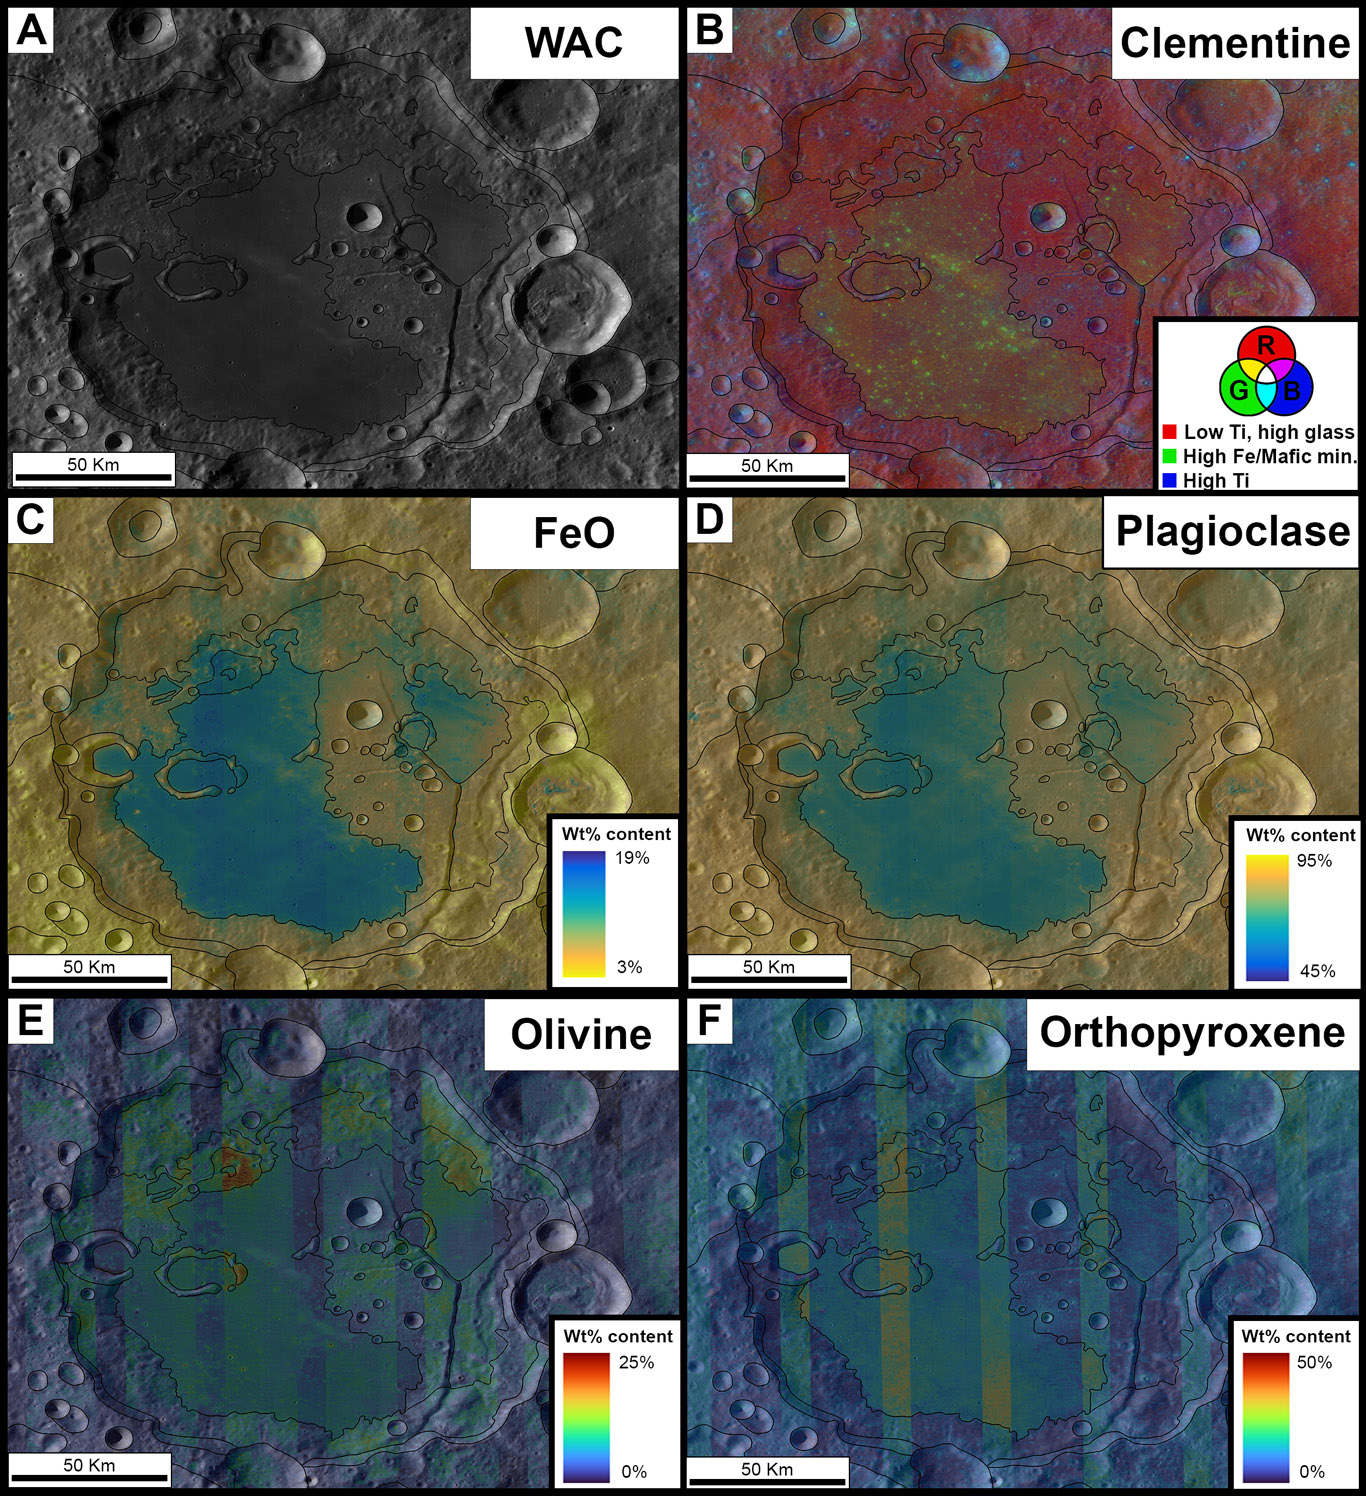
Fig. 1: A) WAC image of the Jules Verne crater, overlaid by different color palettes representing the: B) Clementine RGB false color composition data, where Red = high 750/415nm, Blue = high 415/750nm, and Green high 750/1000nm; C) Weight percentage content of FeO, D) Weight percentage content of plagioclase; E) Weight percentage content of Olivine; and F) weight percentage content of Orthopyroxene.
Results and future developments:
Within the resulting geologic map of the Jules Verne crater interior (scale 1:250.000, Fig. 2), we identified a total of 10 geologic units and 4 linear features which take also into account those already described by [2].
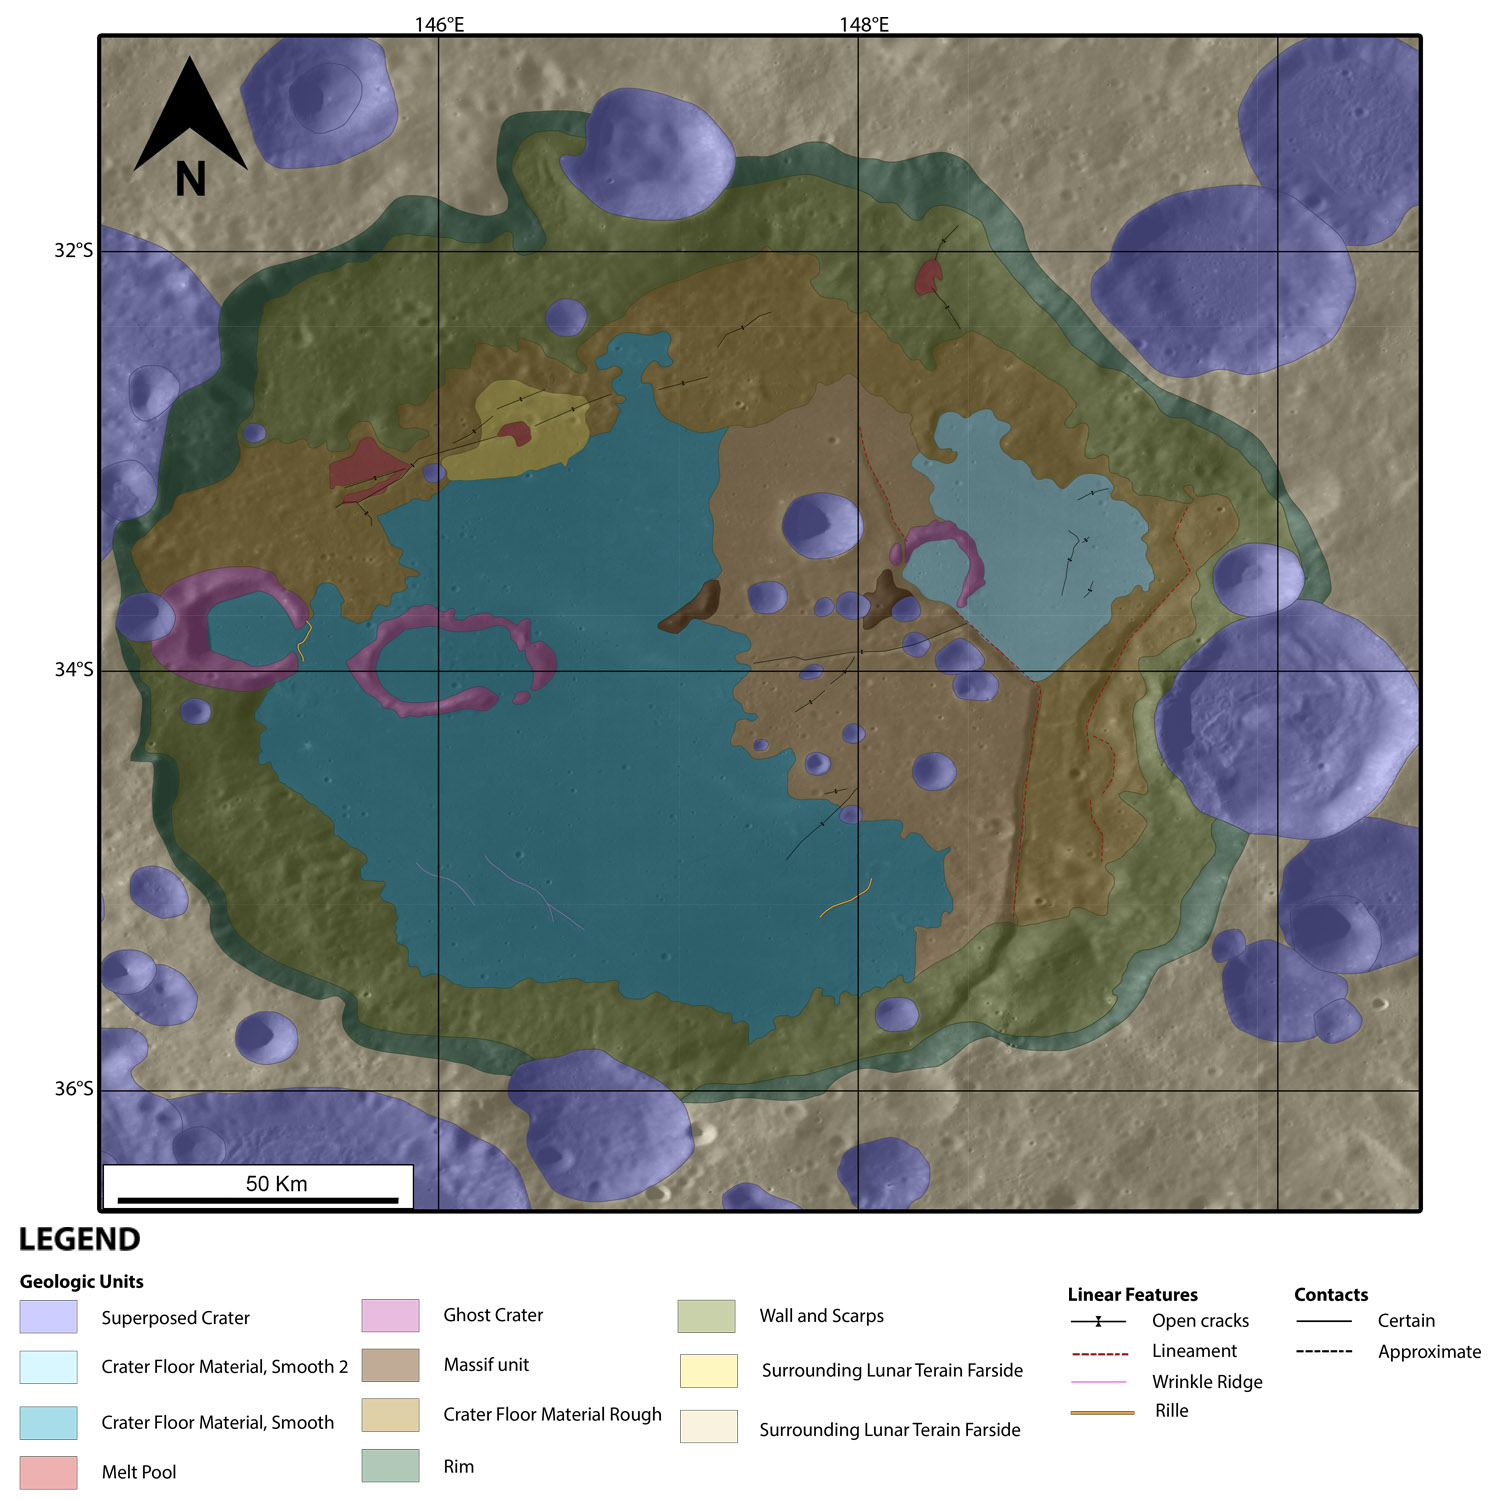
Fig. 2: Geologic Map of the Jules Verne crater with the corresponding legend shown on the right.
The Scarps unit encompasses the areas characterized by a relatively gentle slopes, which are located between the rim and the floor. The Wall unit corresponds to the steep slope just adjacent to the rim. The crater floor is characterized by four main units i.e. two smooth floor material (SF1 and SF2) and two rough floor material (RF1 and RF2). The first two units both appear as flattish regions mainly composed of basaltic mare-like material. However, SF1 shows lower TiO2 content and higher FeO content with respect to SF2, which appears more intermixed with or covered by with the rim material. On the other hand, RF units appear to resemble the highland-like units which surround the Jules Verne crater. Indeed, it shows high content in plagioclase and lower content in FeO, olivine, and pyroxenes. Specifically, RF1 is located adjacent to the crater’s wall, while RF2 is near to the center of the crater and surrounded by SF1 and SF2. Moreover, from a spectral point of view RF1 appears more intermixed with the highland-like material compared to the RF2 unit.
Many craters are superposed on these units. Those on top of SF1 and SF2 have diameters up to ~1.3 km and exposed stratigraphically lower and older material enriched in olivine. Conversely, those placed on top of RF1 unit appear larger (i.e. diameters up to ~11 km) and reveal lower layers with high plagioclase content, low olivine content, and compositionally similar to the rim or the surrounding highland material. Among the floor of the Jules Verne crater are also visible volcanic features which witness the past magmatic activity of the crater. Indeed, rilles, melt pools, pyroclastic deposits, open fractures, and lineaments are present. All these characteristics depict Jules Verne as result of an ancient impact that occurred in the Nectarian time and then involved in multiple volcanic events which reshaped the original crater floor, by infilling it with basaltic mare-like material. A complete version of the geologic map with further spectral sub-unit distinction will be presented at the conference.
This study provides an overview of the geologic units of the entire Jules Verne crater distinguished through spectral and morphological analyses. The same methodologies will be applied to the upcoming ESA-ASI LUMIO mission, which aims to observe impact flashes on the lunar farside with the collaboration of the LROC team. By exploiting these two datasets together it will be possible to produce pre and post impact geologic maps of the identified impacts, like the one presented in this work.
Acknowledgements: This research was supported by the Italian Space Agency under ASI-INAF grant agreement no. 2024-6-HH.0.
References: [1] Fortezzo C. et al., (2020). Proceedings of the 51st LPSC. [2] Wu C. et al., (2025). Remote sensing, 17, 1582. [3] Yigst, R.A.et al., (1999). J. Geophys. Res. 104, 1857-1879. [4] Robinson M.S., et al., (2010). Space Sci. Rev., 150(1–4), 81-124. [5] Smith D.E., et al., (2010). Space Sci. Rev. 150, 209-241. [6] Haruyama J., et al., (2008). Earth Planet. Sp., 60, 243 255. [7] Lucey P.G., et al., (2000). JGR. 105(E8), 20377-20386. [8] Ohtake M., et al., (2008). Earth Planets Sp., 60, 257-264. [10] Tusberti, F. et al., (2024). GFT &M, 16(1.1), 1-19. [11] Tusberti, F. et al., (2024). Icarus, 423, 116255.
How to cite: Tusberti, F., Pajola, M., Lucchetti, A., Penasa, L., Beccarelli, J., Rossi, C., and Munaretto, G.: Geological Map of the Jules Verne lunar farside crater (Moon), in the context of the Future Lumio Mission., EPSC-DPS Joint Meeting 2025, Helsinki, Finland, 7–13 Sep 2025, EPSC-DPS2025-966, https://doi.org/10.5194/epsc-dps2025-966, 2025.
Introduction
We are a team of primarily undergraduate student researchers, led by Dr. Martin-Wells, who are creating an IDL-based data analysis pipeline that will combine multiple existing techniques [e.g., 1-5] for classifying craters. We aim to develop a transparent, accessible tool that can be used to sort primary and secondary craters on the Moon, even by novice crater classifiers. The pipeline will mimic how an experienced crater classifier sorts primary and secondary craters “by hand,” but in a semi-automated pipeline that tracks the exact criteria used for classification and reduces the time needed to make these decisions. This work focuses on how craters will be assigned a recommended classification based on the data that the pipeline will collect.
Background and Methods
Our IDL pipeline will extract and analyze lunar data obtained from the freely-available JMARS [6] GIS platform [see our previous work, 7-10]. We will use the data extracted by the pipeline in combination to generate automated suggestions for crater classification as either secondary or primary. Because the characteristics that distinguish primary and secondary craters on the Moon are contextual (with secondary characteristics dependent on factors such as crater age, underlying surface age, and distance from the parent primary), we have developed four different frameworks for assessing each crater.
Framework 1: Total “Points”
In the first framework, we will test each criterion separately, using the same classification characteristics for all craters in the dataset. Each crater will be assessed in terms of seven secondary criteria: shallow depth-to-diameter ratio (d/D); asymmetric uprange-to-downrange elevation profile slope ratio (Slope Ratio); high degree of clustering (Clustering); cluster orientation toward a parent primary (Orientation); elliptical planform shape (Planform); secondary morphology (Morphology); and the presence of block-rich material downrange (Debris Tail). In Framework 1, we will assign one point for each secondary criteria the crater exhibits. We will classify craters with four or more points as secondary crater candidates.
Framework 2: Cluster-Focused
In the second framework, we will evaluate each crater based on the same seven criteria, with an emphasis on clustered craters. First, we will assess all craters in the dataset for membership in a cluster, using the same clustering criteria for all craters. In this first step, we aim to identify all craters in the dataset that are even mildly spatially clustered. We will then remove false-positive secondary craters from this list of craters using the remaining six criteria. If clustered craters exhibit at least three remaining criteria, we will classify them as potential secondary craters.
Framework 3: Crater-Age-Focused
In the third framework, the cut-offs for each secondary crater criterion will be tuned depending on relative crater age for each crater in the dataset [11]. The process will begin by assessing the degradation state of each crater in the dataset and classifying it as Fresh, Moderately Degraded, or Heavily Degraded. We will then evaluate all Fresh craters by the same criteria cut-offs. A differently tuned set of criteria cut-offs will be used for Moderately Degraded craters, and so on. After we determine the degradation state of each crater, the order that we will assess the remaining criteria will be: Clustering, Orientation, Planform, d/D, Slope Ratio, Morphology, and Debris Tails.
Framework 4: Underlying-Surface-Age-Focused
This framework will follow the same basic structure and logic as Framework 3, except that a proxy for the underlying surface age will first be determined for each crater. This relative surface age will be based on the number of craters with diameter greater than 1 km per square kilometer (N(>1)) in the surrounding terrain. After determining this N(>1) value, we will classify each crater in the dataset as being on Sparsely Cratered, Moderately Cratered, or Heavily Cratered terrain. Using the same order of evaluating the criteria as in Framework 3, we will assess all craters on Sparsely Cratered terrains using the same cut-off criteria, and so on.
Combining the Frameworks
After each crater in the dataset has been assessed using all four frameworks, all craters that are determined to be potential secondary craters by at least two of the four frameworks will be classified as secondaries. The results for each of the seven criteria in each of the four frameworks will be output in a file for each of the craters in the dataset, along with the final classification of secondary or primary. This will allow for a quick final decision to be made by an experienced crater classifier, using the recorded data from each crater as a guide in accepting or rejecting the recommendation made by the semi-automated pipeline. If the decision of the pipeline is overturned, the wealth of data extracted will allow the experienced counter to clearly justify their classification decision. This will make this method both transparent and repeatable.
Conclusions
We will present our results after an eight-week summer research experience of combining the existing pieces of the pipeline into a single, streamlined procedure. Specifically, we will compare our semi-automated classification of Tycho secondary craters with diameters greater than 1 km, located within 8 crater radii, against existing secondary classifications by various workers [e.g., 12].
References
[1] Dundas, C. M. and McEwen, A. S., (2007), Icarus, 186, 31-40. [2] Lucchitta, B. K., (1977), Icarus, 30, 80-96. [3] McEwen, A. S. et al., (2005), Icarus, 176, 351-381. [4] Robbins, S. J. and Hynek, B. M., (2011), Geophys. Res. Letters, 38, L052201. [5] Wells, K. S. et al., (2010), J. Geophys. Res., 115, E06008. [6] Christensen, P. R. et al., (2009), In: American Geophysical Union Conference, Abstract IN22A-06. [7] Martin-Wells, K. S. et al., (2022), Lunar Planet. Sci. Conf., 53rd, 2678, id. 2557. [8] Powers, L. T. et al., (2022), 13th Planet. Crater Consortium Meeting, 2702, id. 2023. [9] Powers, L. et al., (2023), Lunar Planet. Sci. Conf., 54th, 2806, id. 2259. [10] Martin-Wells, K. S. et al., (2024), Lunar Planet. Sci. Conf., 55th, 3040, id. 2093. [11] C. I. Fassett and B. J. Thomson, (2014), J. Geophys. Research: Planets, 119, 2255–2271. [12] K. N. Singer et al., (2020), J. Geophys. Research: Planets, 125.
How to cite: Martin-Wells, K., Dickinson, A., Powers, L., Barker, B., Ways, T., Soueidan, G., Snyder, M., Perrine, T., and Baer, D.: Evaluating Characteristics of Potential Lunar Secondary Craters Extracted by a Semi-Automated Data Pipeline , EPSC-DPS Joint Meeting 2025, Helsinki, Finland, 7–13 Sep 2025, EPSC-DPS2025-1034, https://doi.org/10.5194/epsc-dps2025-1034, 2025.
Introduction
Lappajärvi is a ~22 km impact crater of Late Cretaceous age (77.85 ± 0.78 Ma) in western Finland, hosting a lake of the same name (Fig. 1). The crater morphology is preserved with an almost continuous rim rising up to 100 m above the lake surface. As an open body of water within the preserved topographic rim of an impact crater, Lappajärvi is Europe’s largest impact crater lake.
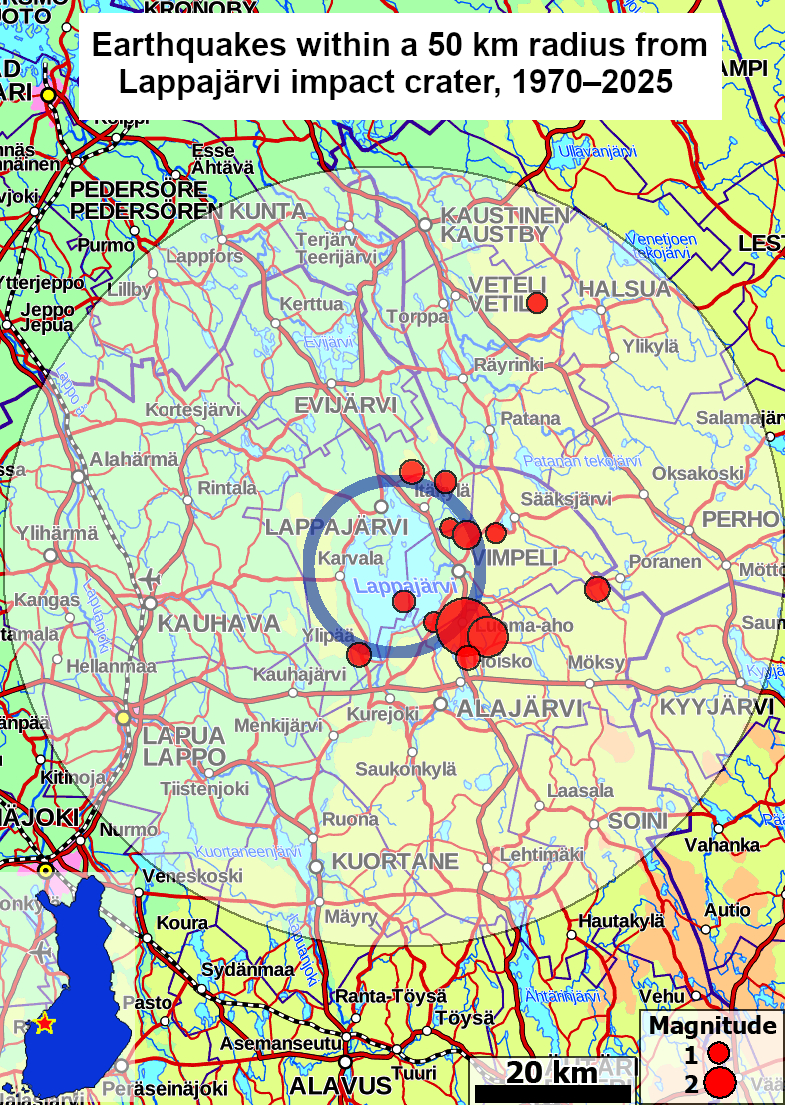
Figure 1. The red dots mark the epicentres of earthquakes within a 50 km radius of Lappajärvi crater. The blue circle approximates the 22 km rim-to-rim diameter. Earthquake data: Inst. of Seismology, Univ. of Helsinki. Base map: Nat. Land Surv. of Finland / CC BY 4.0.
The target rocks consist mainly of ~1.96–1.91 Ga mica schists and gneisses with minor mafic volcanics (e.g., pillow lavas) and carbonate rocks. The latter have been quarried since the late 1800s. The supracrustal sequence was intruded by granitoids at ~1.91–1.88 Ga, but although significant in the region, they are not a major component of the crater itself. One of the intrusions, the Paalijärvi granodiorite, includes the enigmatic “lumpy granite”, which has puzzled researchers for over a century (Fig. 2). The last important igneous event in the area was the intrusion of granite pegmatites at ~1.82–1.80 Ga.
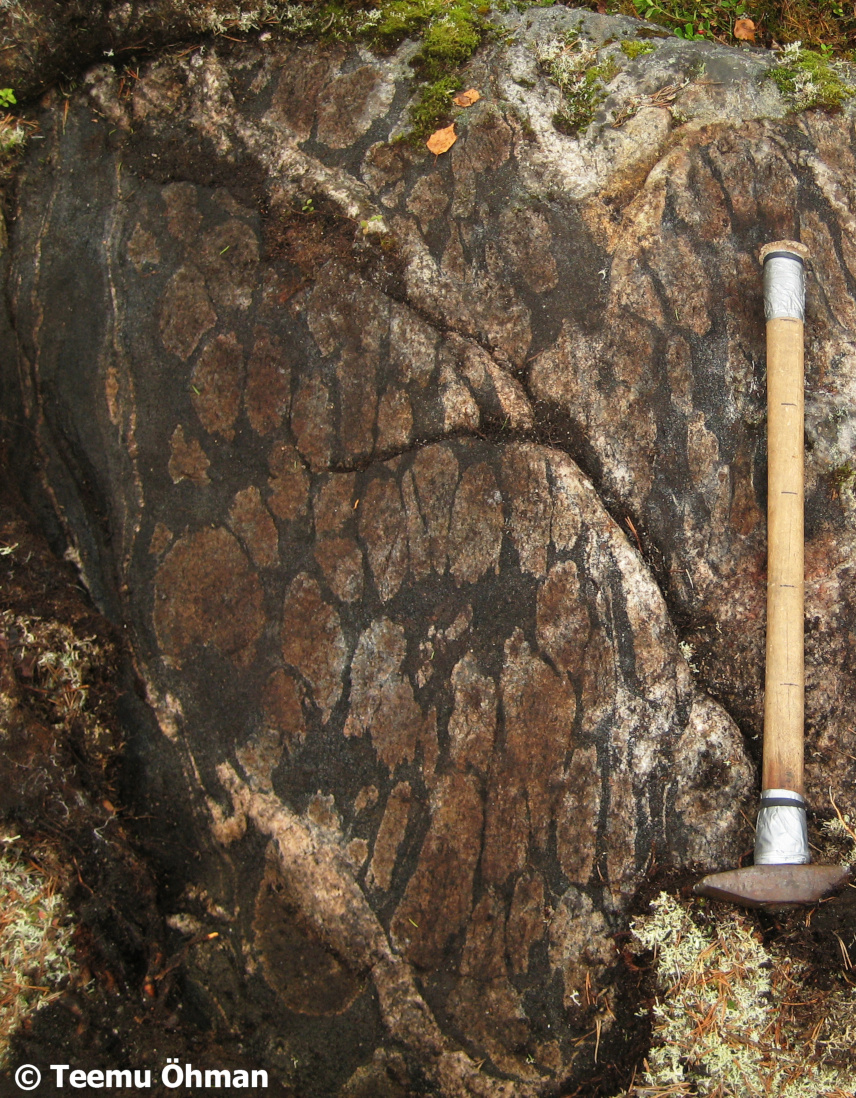
Figure 2. “Lumpy granite” displays elliptical granitic lumps within a hornblende-rich matrix. Hammer shaft has scale marks every 10 cm.
Early Cambrian and Ordovician sedimentary rocks were also present at the time of the impact. They are not cropping out, but have been encountered in drillings as well as rare boulders within the glacial drift. They contain small carbonaceous fossils (SCFs), including possibly the world’s oldest remains of annelids (ringed worms).
In 2024, the world-class geological, biological, historical and cultural heritage of the region was formally recognised as Impact Crater Lake Lappajärvi UNESCO Global Geopark (UGGp) was established. In addition to, e.g., natural resources, geoconservation and education, science is one of the main focus areas of Geoparks. Thus, Geoparks are encouraged to work with academic institutions to engage in active scientific research. Here, some of the outstanding science questions in Impact Crater Lake Lappajärvi UGGp are highlighted.
Geology
The Geological Survey of Finland carried out four deep drillings in Lappajärvi in 1988–1990, three of them being crucial for understanding the structure of the crater (henceforth referred to as kärnäite, suevite and sediment cores). The first drilling penetrated ~145 m of impact melt rock, locally known as kärnäite after the central Kärnä island where it crops out. Beneath the impact melt rock is suevitic breccia. However, different authors provide highly diverging views of the thickness of the suevitic layer (5 m vs. 30 m). This, combined with the evolving understanding of suevitic breccias in general, warrants a new look at the kärnäite core, especially as detailed logging reports or descriptions have never been published.
The severely understudied suevite core in the southern part of the Kärnä island encompasses over 140 m of suevitic and lithic breccias. In addition, two intercalations of sedimentary rocks were found within the suevitic rocks. They contain Early and Middle Cambrian as well as Ordovician acritarchs, although the age of their redeposition is considered unknown. Given the recent developments in the analytical methods of SCFs, a new assessment of the siltstones in the suevite core are in order. This is emphasized by the fact that pre-Quaternary Phanerozoic sediments are exceedingly rare in Finland.
The sediment core was drilled in the eastern annular trough of the crater. In addition to preserving a unique sequence of post-impact Pleistocene sediments, the core contains ~18 m of pre-impact sand- and siltstones. These were previously interpreted to be Mesoproterozoic in origin, but a subsequent study of acritarchs and SCFs has shown them to be over half a billion years younger, i.e. Early Cambrian. This highlights the scientific potential of reanalysing the existing drill cores and other data.
Lappajärvi impactites were affected by hydrothermal alteration for hundreds of thousands of years. This resulted in, e.g., the formation of chalcedony and agate, as well as calcite veins and vugs. A peculiar, colour-changing green mineral may well be a result of the hydrothermal phase too (Fig. 3). These poorly studied precipitates offer ample opportunities for mineralogical and stable isotope research.
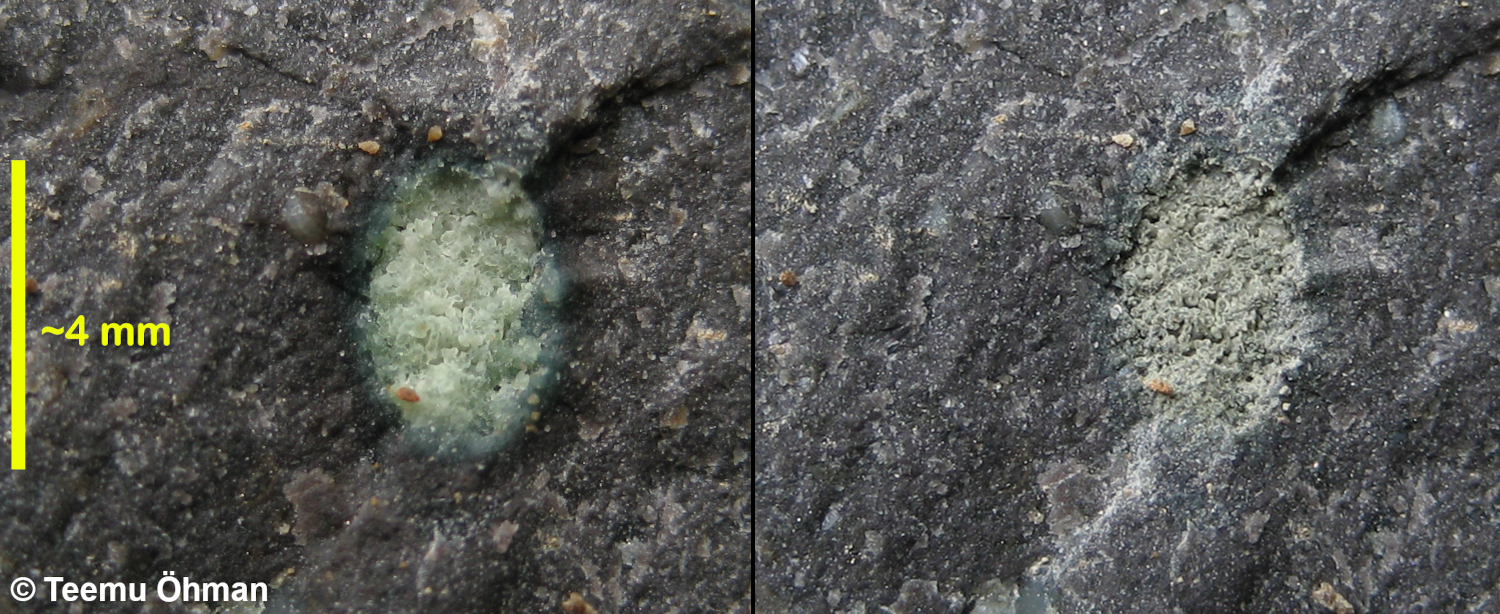
Figure 3. Kärnäite contains a mineral that changes its colour within minutes of being exposed.
Geophysics
Geophysically, one of the prominent but generally unknown features of the Lappajärvi crater is the striking clustering of seismic activity on the rim (Fig. 1). This includes the largest earthquake (magnitude 3.8) in Finland since the beginning of systematic seismic measurements in 1970. This is hardly a coincidence. However, no studies of this apparent prolonged instability of the crater rim have been published.
Lappajärvi also offers great possibilities for muon imaging. This rapidly evolving field is based on the ability of cosmic-ray induced atmospheric muons to pass through materials of different densities. Density variations between different impactites, target rocks and crater-fill sediments would be easily detectable by muon imaging, as should, for example, be the faults of the terrace zone. However, muon imaging has not yet been utilized in an impact crater setting. In Lappajärvi, a muon downhole detector could be placed in the still largely open kärnäite drill hole. This would provide a cost-effective means to precisely determine the rather poorly constrained horizontal extent of the impact melt sheet. Muon telescopes, in concert with microseismic monitoring, could shed light on the rim structure and the causes of its on-going shaking.
Conclusions
Lappajärvi is an easily accessible impact crater with a long research history. A wealth of data already exists, but much of it is in need of new interpretations. Impact Crater Lake Lappajärvi UNESCO Global Geopark can serve as a nexus for researchers as well as for educators wanting to visit and study this classic impact site.
References
Due to limitations in the local space-time continuum, references will be provided in the presentation.
How to cite: Öhman, T.: Lappajärvi Impact Crater – Fostering Research in a UNESCO Global Geopark, EPSC-DPS Joint Meeting 2025, Helsinki, Finland, 7–13 Sep 2025, EPSC-DPS2025-1047, https://doi.org/10.5194/epsc-dps2025-1047, 2025.
Double-layered ejecta (DLE) craters feature distinct ejecta layers, striated surfaces, moat and rampart structures, widely seen as evidence for an ejecta emplacement with fluidized components derived from subsurface volatiles such as water or ice on Earth, Mars, and potentially other bodies like Ceres or Ganymede.
The boundary conditions driving DLE crater formation remain poorly constrained, especially across varying planetary environments. This study examines DLE processes through comparative field analysis of two terrestrial analogs: the 1.2 km-diameter basaltic Lonar crater (India), smaller than typical Martian DLE craters, and the 24 km Ries crater (Germany), which closely matches Martian DLE dimensions and preserves a well-defined ejecta blanket. Both craters provide well-preserved, accessible sites ideal for studying impact dynamics and potential double-impact systems. Ries, paired with the nearby Steinheim crater in a confirmed double impact, is compared to Lonar and the adjacent “Little Lonar” structure, which may represent a secondary impact. Field investigations included drone-based photogrammetry for high-resolution topography, 100 MHz bi-static ground-penetrating radar for subsurface mapping, as well as petrography, rock magnetics, micro-fracture analysis, and identification of shock features such as shatter cones.
Lonar and Ries craters provide rare insight and access on Earth into the mechanisms behind DLE formation. Their study helps refine our understanding of how impact crater formation interacts with the crust in potentially volatile-bearing planets.
How to cite: Wilk, J., Agarwal, A., Dey, G., and Tiwari, S.: Shaped by the Double: Investigating Double-Layered Ejecta at Ries and Lonar Craters, EPSC-DPS Joint Meeting 2025, Helsinki, Finland, 7–13 Sep 2025, EPSC-DPS2025-1537, https://doi.org/10.5194/epsc-dps2025-1537, 2025.
Introduction: Shock deformation arises from the hyper-velocity impact from two or more bodies. It is a key mechanism for planetary formation in the primordial solar system. Olivine is the fundamental rock-forming mineral and the major building-block for a rocky planetary body. In a differentiated planet, Mg-rich olivine is crystallized primarily from the magma forming planet’s mantle. Its orthorhombic crystal structure provides well-defined ways (slip systems) to accommodate the deformation stress and its high melting point makes it a perfect candidate to record the deformations for extreme condition, e.g., shock metamorphism. The interplanetary collision unloads the pressure instantaneously, resulting in an extreme strain rate deformation (up to106/s), with the pressure decaying from the epic centre. Thus, in the same body, it is possible to have both high-shocked (>45GPa) and low-shocked rocks (<20GPa)1,2. The dislocations induced by shock are distributed randomly in the crystal with no preferred orientation, forming shock mosaicity1,2,3. It is a crucial petrographic texture to distinguish shock from other plastic deformation (e.g., tectonism). Achondrite meteorites, such as those from the Moon, Mars, or ureilites (Figure 1), originate from fully or partially differentiated planetary bodies. These meteorites record both shock deformation from ejection events and information about their parent bodies.
Methods and samples: In this work, we used the synchrotron-based dark-field X-ray microscopy (DFXM) coupled with other imaging method, electron-backscattered diffraction (EBSD) and 2 dimensional X-ray diffraction (2D-XRD), to systematically explore the microstructure development in differently deformed olivine, including non-shocked terrestrial olivine peridotite and kimberlite, to low-shock ureilite EET 96042, and to highly shocked Martian shergottite NWA 7721 and Martian chassignite NWA 2737. By using a line-focus beam, we scanned grain in different layers in sample z-dimension with DFXM, offering maximum resolution of 35 nm, 105 nm, and 500 nm in sample x, y, and z dimension. In the end, it allowed the in-situ reconstruction of 3D deformation volume of the examine grain non-destructively.
Results: DFXM shows superior power of resolving microstructures formed by the low-angle boundaries, revealing a distinctive difference between non-shock and shock olivine. We report the development of the “dislocation networks” converging to or diverging from the point of failure of the fractures, forming the incipient shock mosaicity, corresponding well with previous work of Li et al. (2021, 2023, and 2025)3,4,5. In detail, the dislocation distributions in the 3D grain volume that 1) “dislocation network” formed by very-low-angle misorientation boundaries (<0.1 º) and 2) incipient subdomain walls formed by low-angle misorientation boundaries (> 0.3º). These features are not observed in the non-shocked samples. Furthermore, we performed autocorrelation using 2D fast-Fourier transformation on the misorienation maps. We discovered the disrupted and broadened slip-band features at spacing of 10 µm in each layer. By comparing the observation with terrestrial deformed olivine, we conclude they are remnant features from the crustal process rather than impact. Our research highlights the potential of using microstructures to understand different deformation features using observations from multi-techniques at multi-scales. It sheds light into deconvoluting the shock features from parent body process, offering a novel way to decode meteoritic materials and their parent body deformation history.
Reference:
[1] Fritz, J., Greshake, A., and Fernandes, V.A. (2017). MAPS, 52, 1216–1232. [2] Stöffler, D., Hamann, C., and Metzler, K. (2018) MAPS, 53, 5–49. [3] Li, Yaozhu, McCausland, P.J.A., and Flemming, R.L. (2021) MAPS, 56, 1422-1439. doi:10.1111/maps.13706. [4] Li Y., McCausland P. J. A., Flemming R. L., and Hetherington C. J. 2023. AmMin. 108:1897–1905. [5] Li, Y., McCausland, P. J. A., Flemming, R. L., & Osinski, G. R. (2025 MAPS, 60(2), 347-370.
How to cite: Li, Y., Kalacska, S., Yildirim, C., Detlefs, C., Flemming, R. L., and McCausland, P. J. A.: Dislocation migration in terrestrial and impact deformed olivine, EPSC-DPS Joint Meeting 2025, Helsinki, Finland, 7–13 Sep 2025, EPSC-DPS2025-1573, https://doi.org/10.5194/epsc-dps2025-1573, 2025.
Please decide on your access
Please use the buttons below to download the supplementary material or to visit the external website where the presentation is linked. Regarding the external link, please note that Copernicus Meetings cannot accept any liability for the content and the website you will visit.
Forward to presentation link
You are going to open an external link to the presentation as indicated by the authors. Copernicus Meetings cannot accept any liability for the content and the website you will visit.
We are sorry, but presentations are only available for users who registered for the conference. Thank you.
Please decide on your access
Please use the buttons below to download the supplementary material or to visit the external website where the presentation is linked. Regarding the external link, please note that Copernicus Meetings cannot accept any liability for the content and the website you will visit.
Forward to session asset
You are going to open an external link to the asset as indicated by the session. Copernicus Meetings cannot accept any liability for the content and the website you will visit.
We are sorry, but presentations are only available for users who registered for the conference. Thank you.